Read the
following bar graph and answer the following questions:
What
information is given by the bar graph?
In which
year the export is minimum ?
In which
year the import is maximum ?
In which
year the difference of the values of export and import is maximum?

(i)The bar graph represents the import and export (in 100 crores of rupees) from 1982-83 to 1986-87
(ii)The export is minimum in the year 1982-83
(iii)The import is maximum in the year 1986-87
(iv) The difference (in 100 crore of rupees) between the values of export and import are as follows,
for the year 1982−83, difference =14−8=6
for the year 1983−84, difference =18−10=8
for the year 1984−85, difference =19−12=7
for the year 1985−86, difference =20−11=9
for the year 1986−87, difference =22−10=12
Hence, the difference between the values of import and export is maximum in the year 1986−87
Topper's Solved these Questions
Similar Questions
Read the graph and answer the following questions
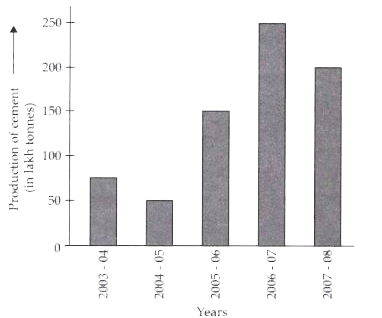
What information is conveyed by the bar graph
View SolutionRead the bar graph given below and answer the following questions:
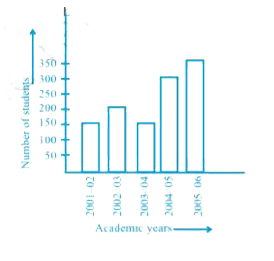
What information is given by the þar graph?
View SolutionRead the bar graph and answer the following questons.
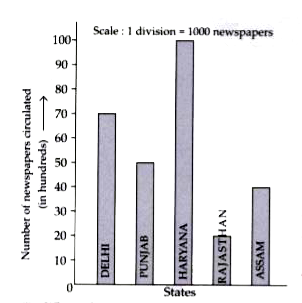
What information is given by graph ?
View SolutionRead the following bar graph given in figure and answer the following questions.
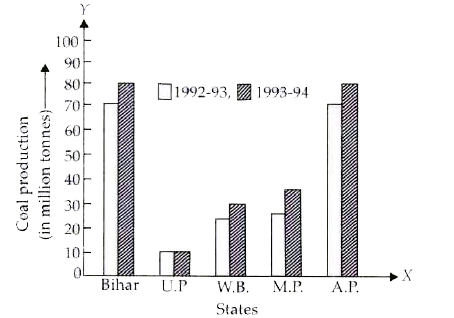
(i) What information is given by this bar graph?
View SolutionRead the bar graph shown in figure and answer the following questions.
What is the information given by the bar graph?
View SolutionRead the following bar graph and answer the following questions: What information is given by the bar graph? Which state is the largest producer of rice? Which state is the largest producer of wheat? Which state has total production of rice and wheat as its maximum? Which state has the total production of wheat and rice minimum?
View SolutionRead the following bar graph (Figure) and answer the following questions: What information is given by the bar graph? What was the production of cement in the year 1980-81? What is the minimum and maximum productions of cement and corresponding years?
View SolutionRead the following bar graph shown in Figure and answer the following questions: What is the information given by the bar graph? In which month was the sale of the book maximum? In which month was the sale of the book minimum? What is the total sale of the book during these five months?
View SolutionRead the bar graph given below
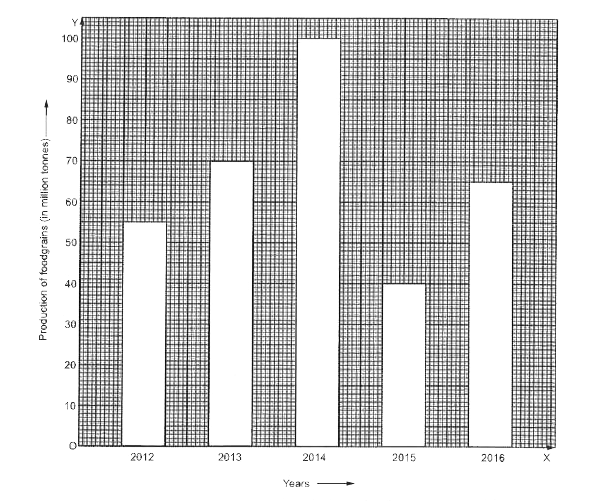
Read the bar graph carefully and answer the following questions
Q(i) What information is given by the bar graph
(ii) In which year was the production maximum
(iii) After which year was there a sudden fall in the production
(iv) Find the ratio between the maximum production and the minimum production during the given period
View SolutionRead the following bar graph given in figure and answer the following questions.
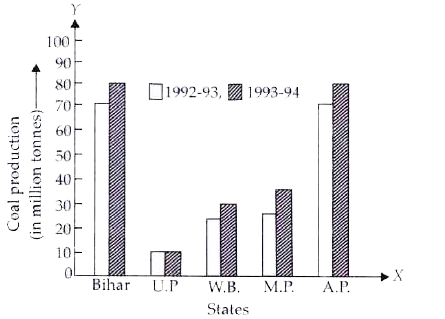
Name the state having same production in both the years?
View Solution
