The
following table shows the daily production of T.V. sets in an industry for 7
days of a week:

Represent
the above information by a pictograph
Topper's Solved these Questions
Similar Questions
The following table gives the frequencies of most commonly used letters a,e,I,o,r,t,u, from a page of a book

Represent the information above by a bar graph.
View SolutionThe following table shows the percentage of buyers of four different brands of bathing soaps.

Represent the above data by a pie chart.
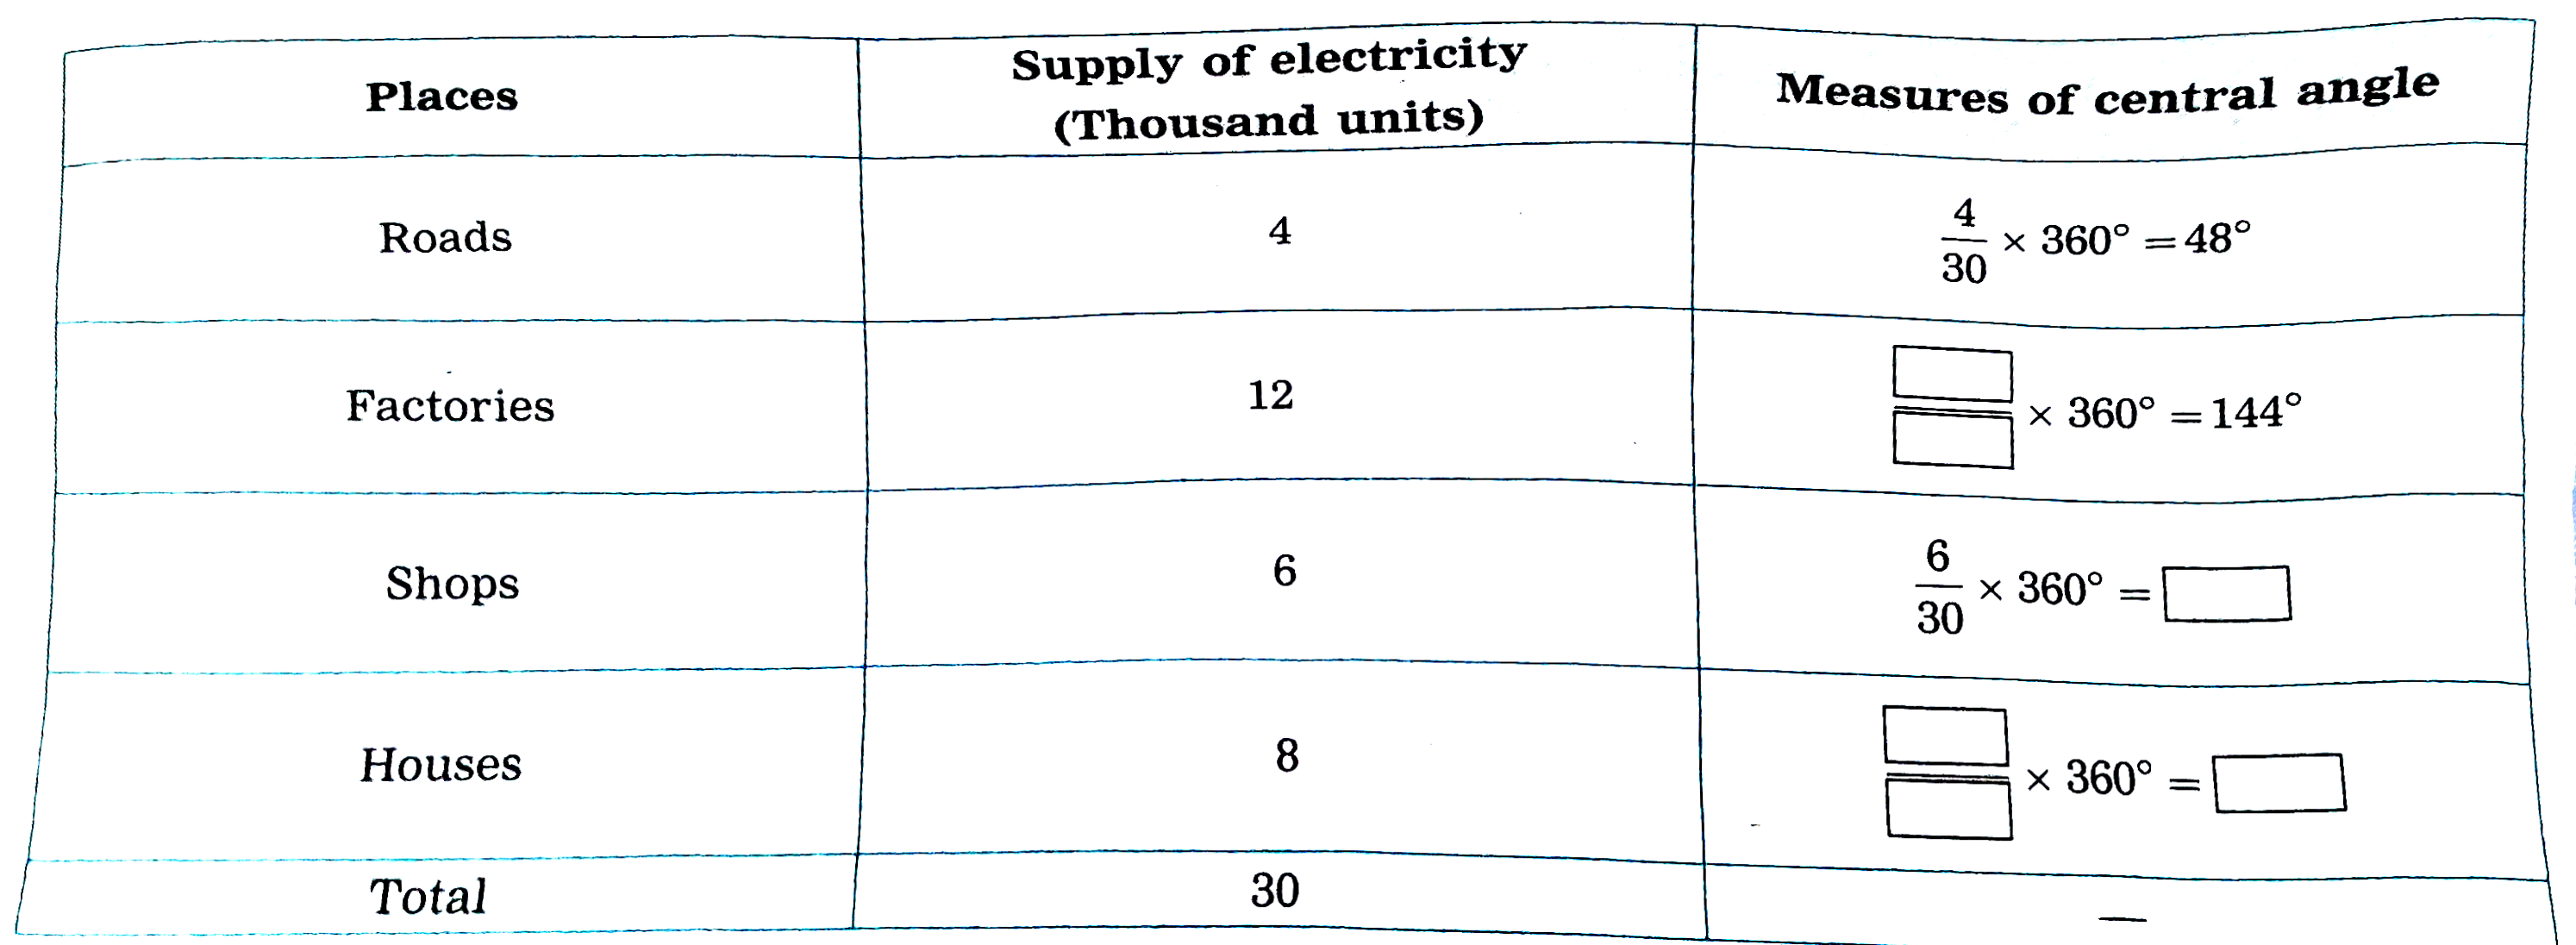
View SolutionThe following table shows the daily supply of electricity to different places in a town. To show the information by a pie diagram measure of central angles of sectors are to be decided. Complete the following activity to find the measures:

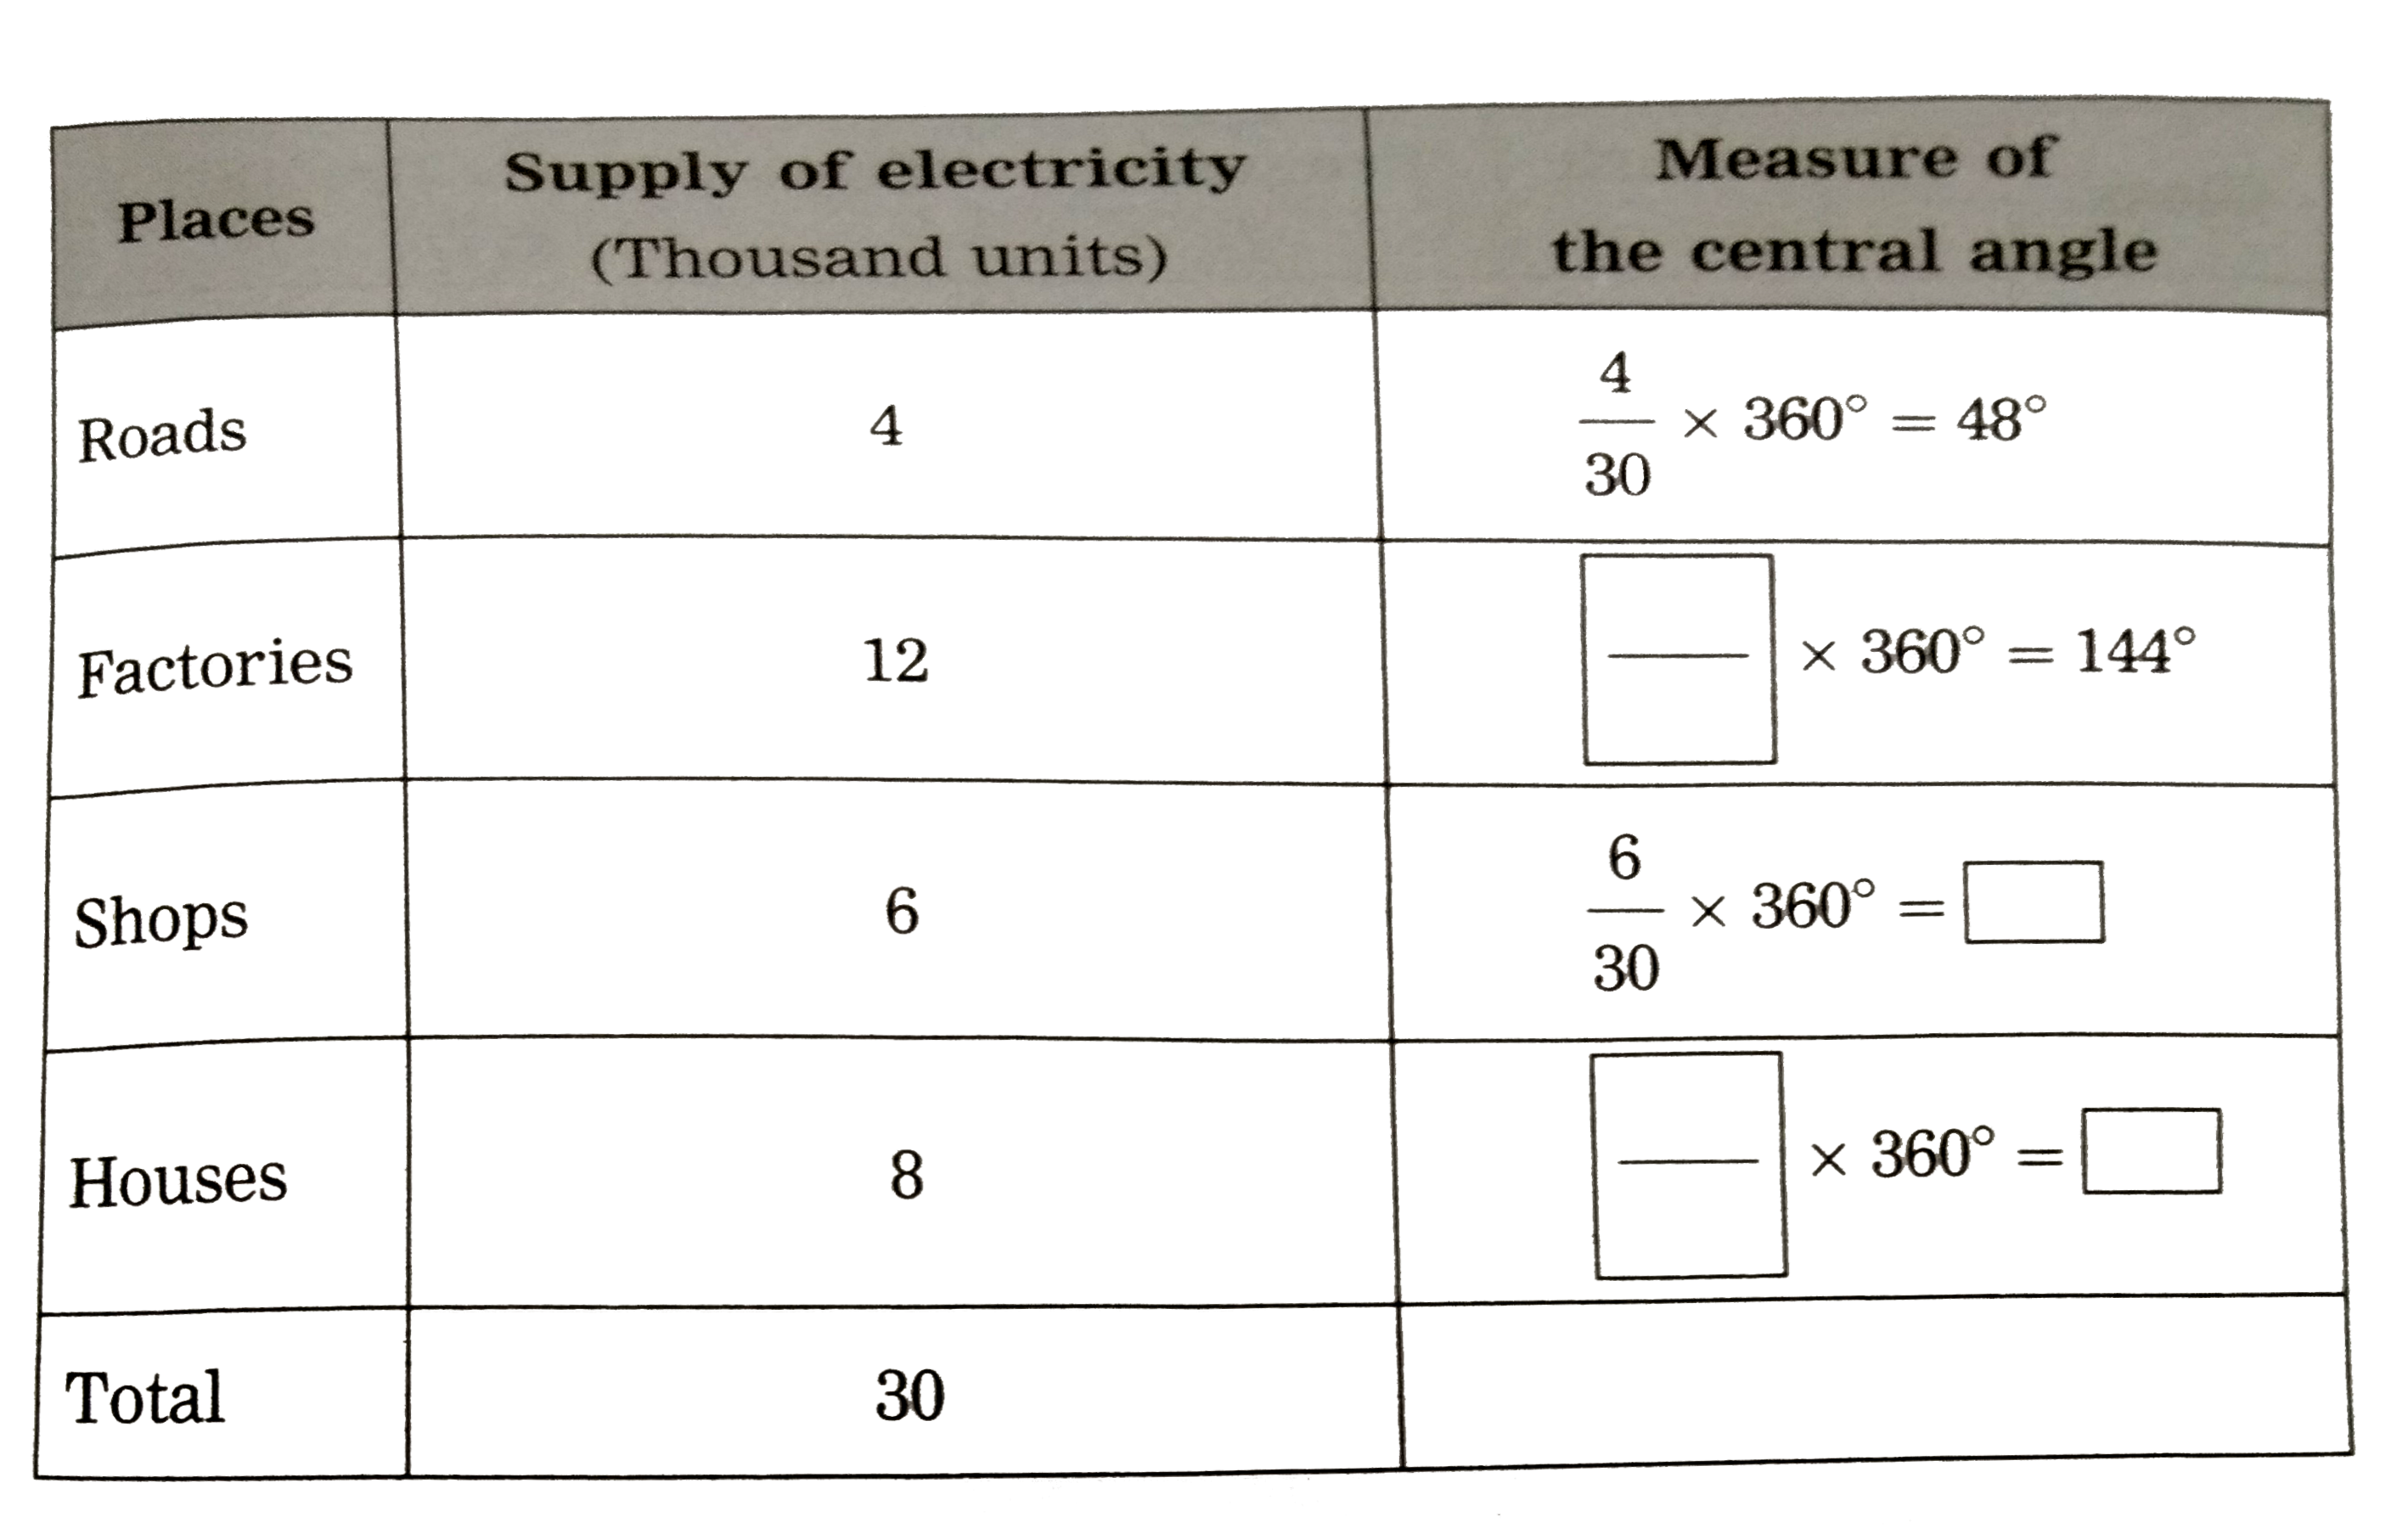
View SolutionThe following table shows the daily supply of electricity to differenet places in a town. To show the information by a pie diagram, measures of central angles of sectors are to be decided. Complete the following activity to find the measures.

View SolutionThe following table shows the percentages of demands for different fruits registered with a fruit vendor. Show the information by a pie diagram.

View SolutionThe following table shows the percentages of demands for different fruits registered with a fruit vendor. Show the information by a pie diagram.

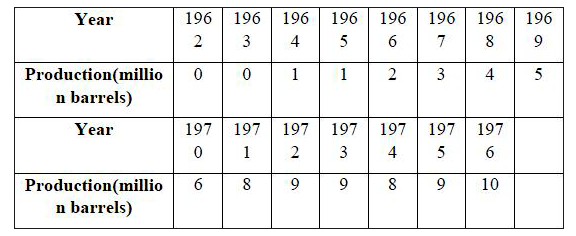
View SolutionThe following table shows the production of gasoline in U.S.A. for the years 1962 to 1976. Obtain trend values for the above data using 5-yearly moving averages.

View SolutionThe following table shows the marks obtained by Sumit in the annual examination.

Draw a bar graph to show the above information.
View SolutionThe following table shows the number of fruits in a fruit shop. Represent the above data by a bar graph
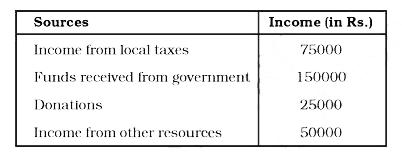
View SolutionThe following table represents income of a Gram Panchayat from different sources in a particular year:

Draw a bar graph to represent the above information
View Solution
