A volume absolute temperature diagram was obtained when a given mass of gas was heated. During the heating process from state to , the pressure
_E01_062_Q01.png)
Remain constant
Decreased
Changed erratically
Increased
The correct Answer is:A
_E01_062_S01.png)
constant slope of graph gives pressure from state to graph is a straight line, slope of the graph ramains constant then pressure remains constant
Topper's Solved these Questions
- THERMAL PROPERTIES OF MATTERBook:NARAYNAChapter:THERMAL PROPERTIES OF MATTERExercise:LEVEL-I (C.W.)
Explore 23 Videos
- THERMAL PROPERTIES OF MATTERBook:NARAYNAChapter:THERMAL PROPERTIES OF MATTERExercise:LEVEL-II (C.W.)
Explore 27 Videos
- THERMAL PROPERTIES OF MATTERBook:NARAYNAChapter:THERMAL PROPERTIES OF MATTERExercise:Examples
Explore 50 Videos
- SYSTEM OF PARTICLES AND ROTATIONAL MOTION Book:NARAYNAChapter:SYSTEM OF PARTICLES AND ROTATIONAL MOTION Exercise:EXERCISE - IV
Explore 39 Videos
- THERMODYNAMICSBook:NARAYNAChapter:THERMODYNAMICSExercise:Exercise
Explore 187 Videos
Similar Questions
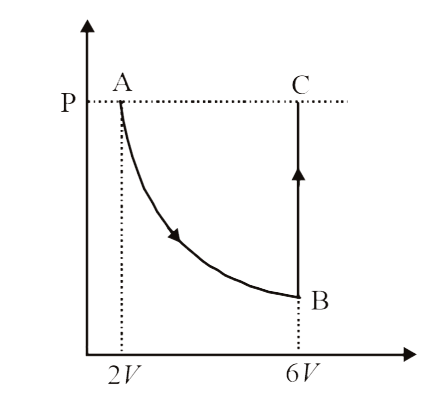
In the figure n mole of a monoatomic ideal gas undergo the process ABC as shown in the P-V diagram. The process AB is isothermal and BC is isochoric. The temperature of the gas at A is T0 total heat given to the gas during the process ABC is measured to be
Q. The average molar heat capacity of the gas in process ABC is
View Solution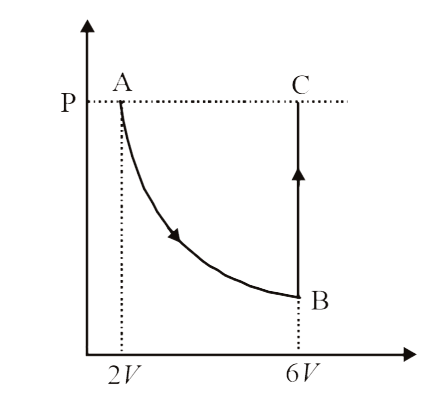
In the figure n mole of a monoatomic ideal gas undergo the process ABC as shown in the P-V diagram. The process AB is isothermal and BC is isochoric. The temperature of the gas at A is T0 total heat given to the gas during the process ABC is measured to be
Q. Heat absorbed by the gas in the process BC
View Solution
Knowledge Check
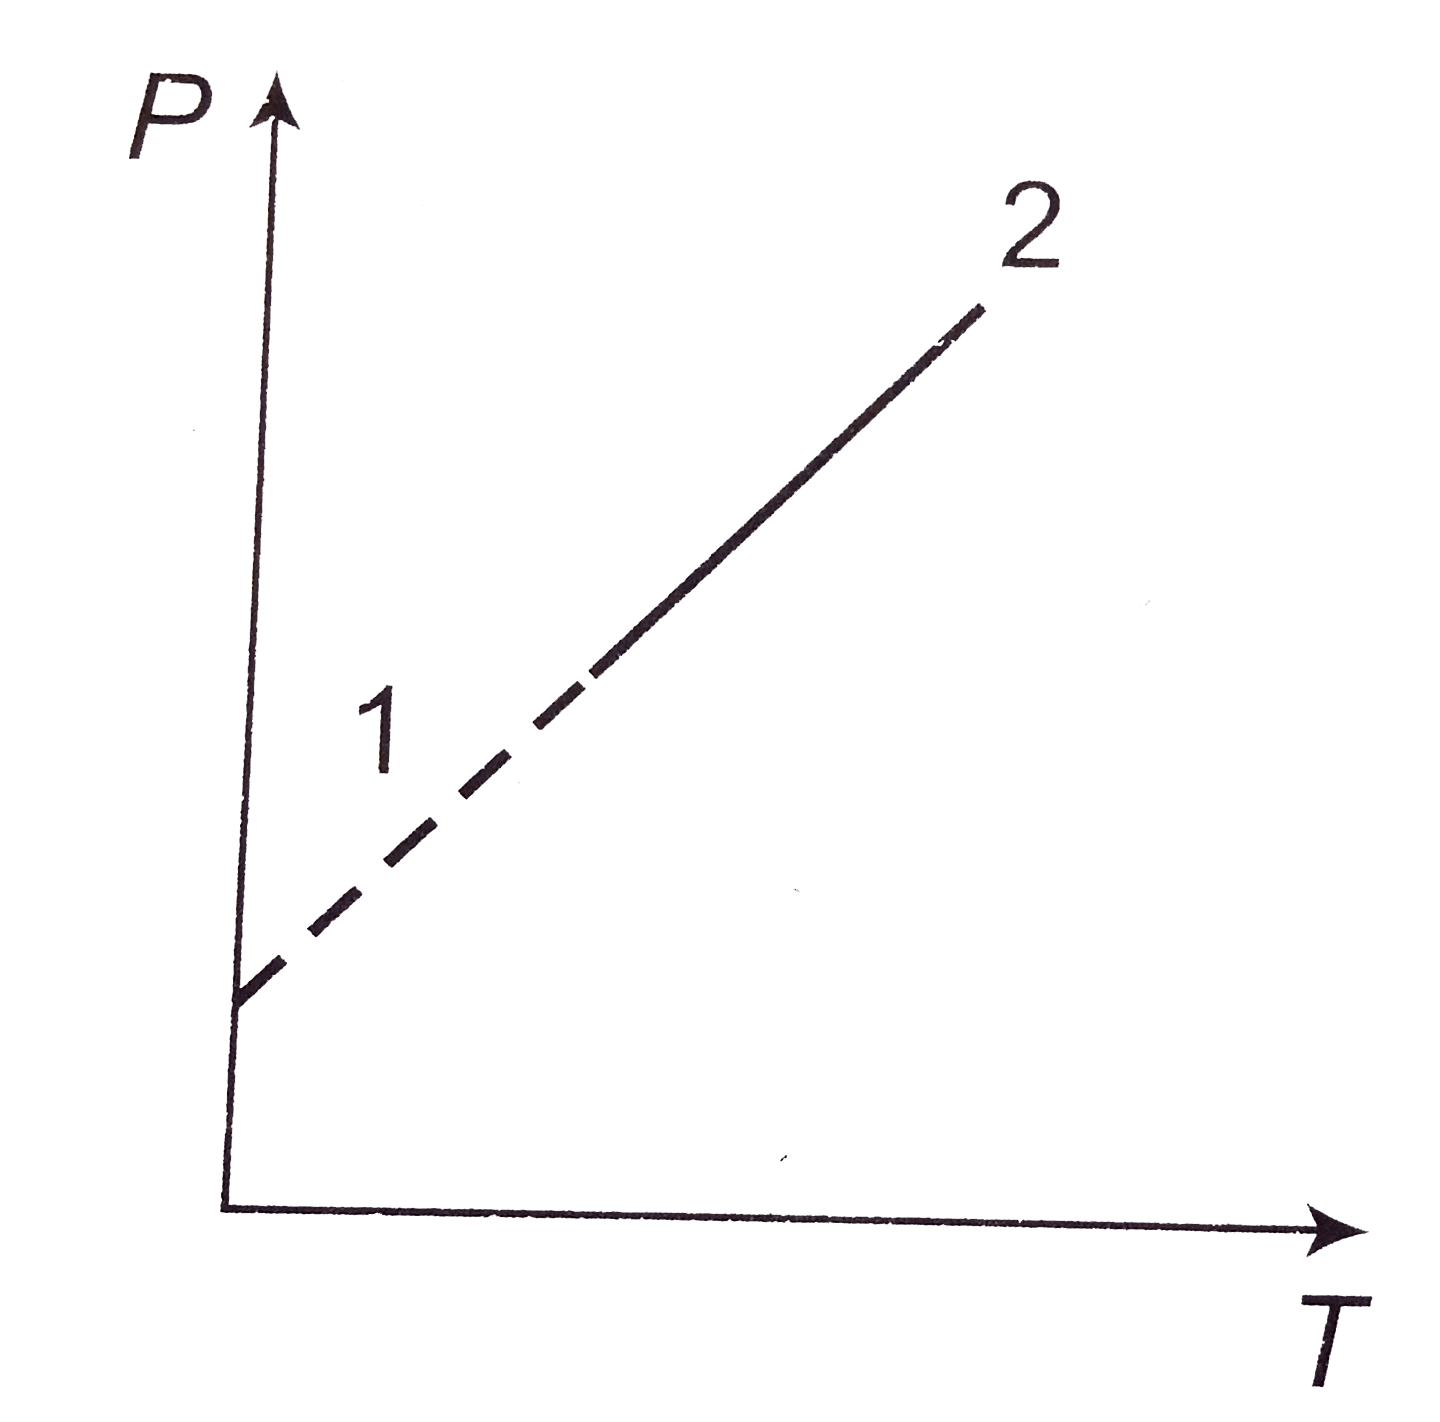
A pressure P, absolute temperature T, graph was obtained whe a given mass of a gas heated. During the heating process from the state 1 to the state 2, the volumeAremained sameBdecreasedCincreasedDnoneV−T diagram for a process of given mass of ideal gas is as shown in fig. During the process pressure of the gas
_E01_072_Q01.png) AFirst increases then decreasesBFirst decreases then increasesCcontinously decreasesDcontinously increases
AFirst increases then decreasesBFirst decreases then increasesCcontinously decreasesDcontinously increasesA ideal gas has pressure 'p', volume 'V' and absolute temperature 'T'. It 'm' is the mass of each molecules and 'K' is the Boltzmann constant , the density of the gas is
ApmMTBKTpmCKmpTDpKTm
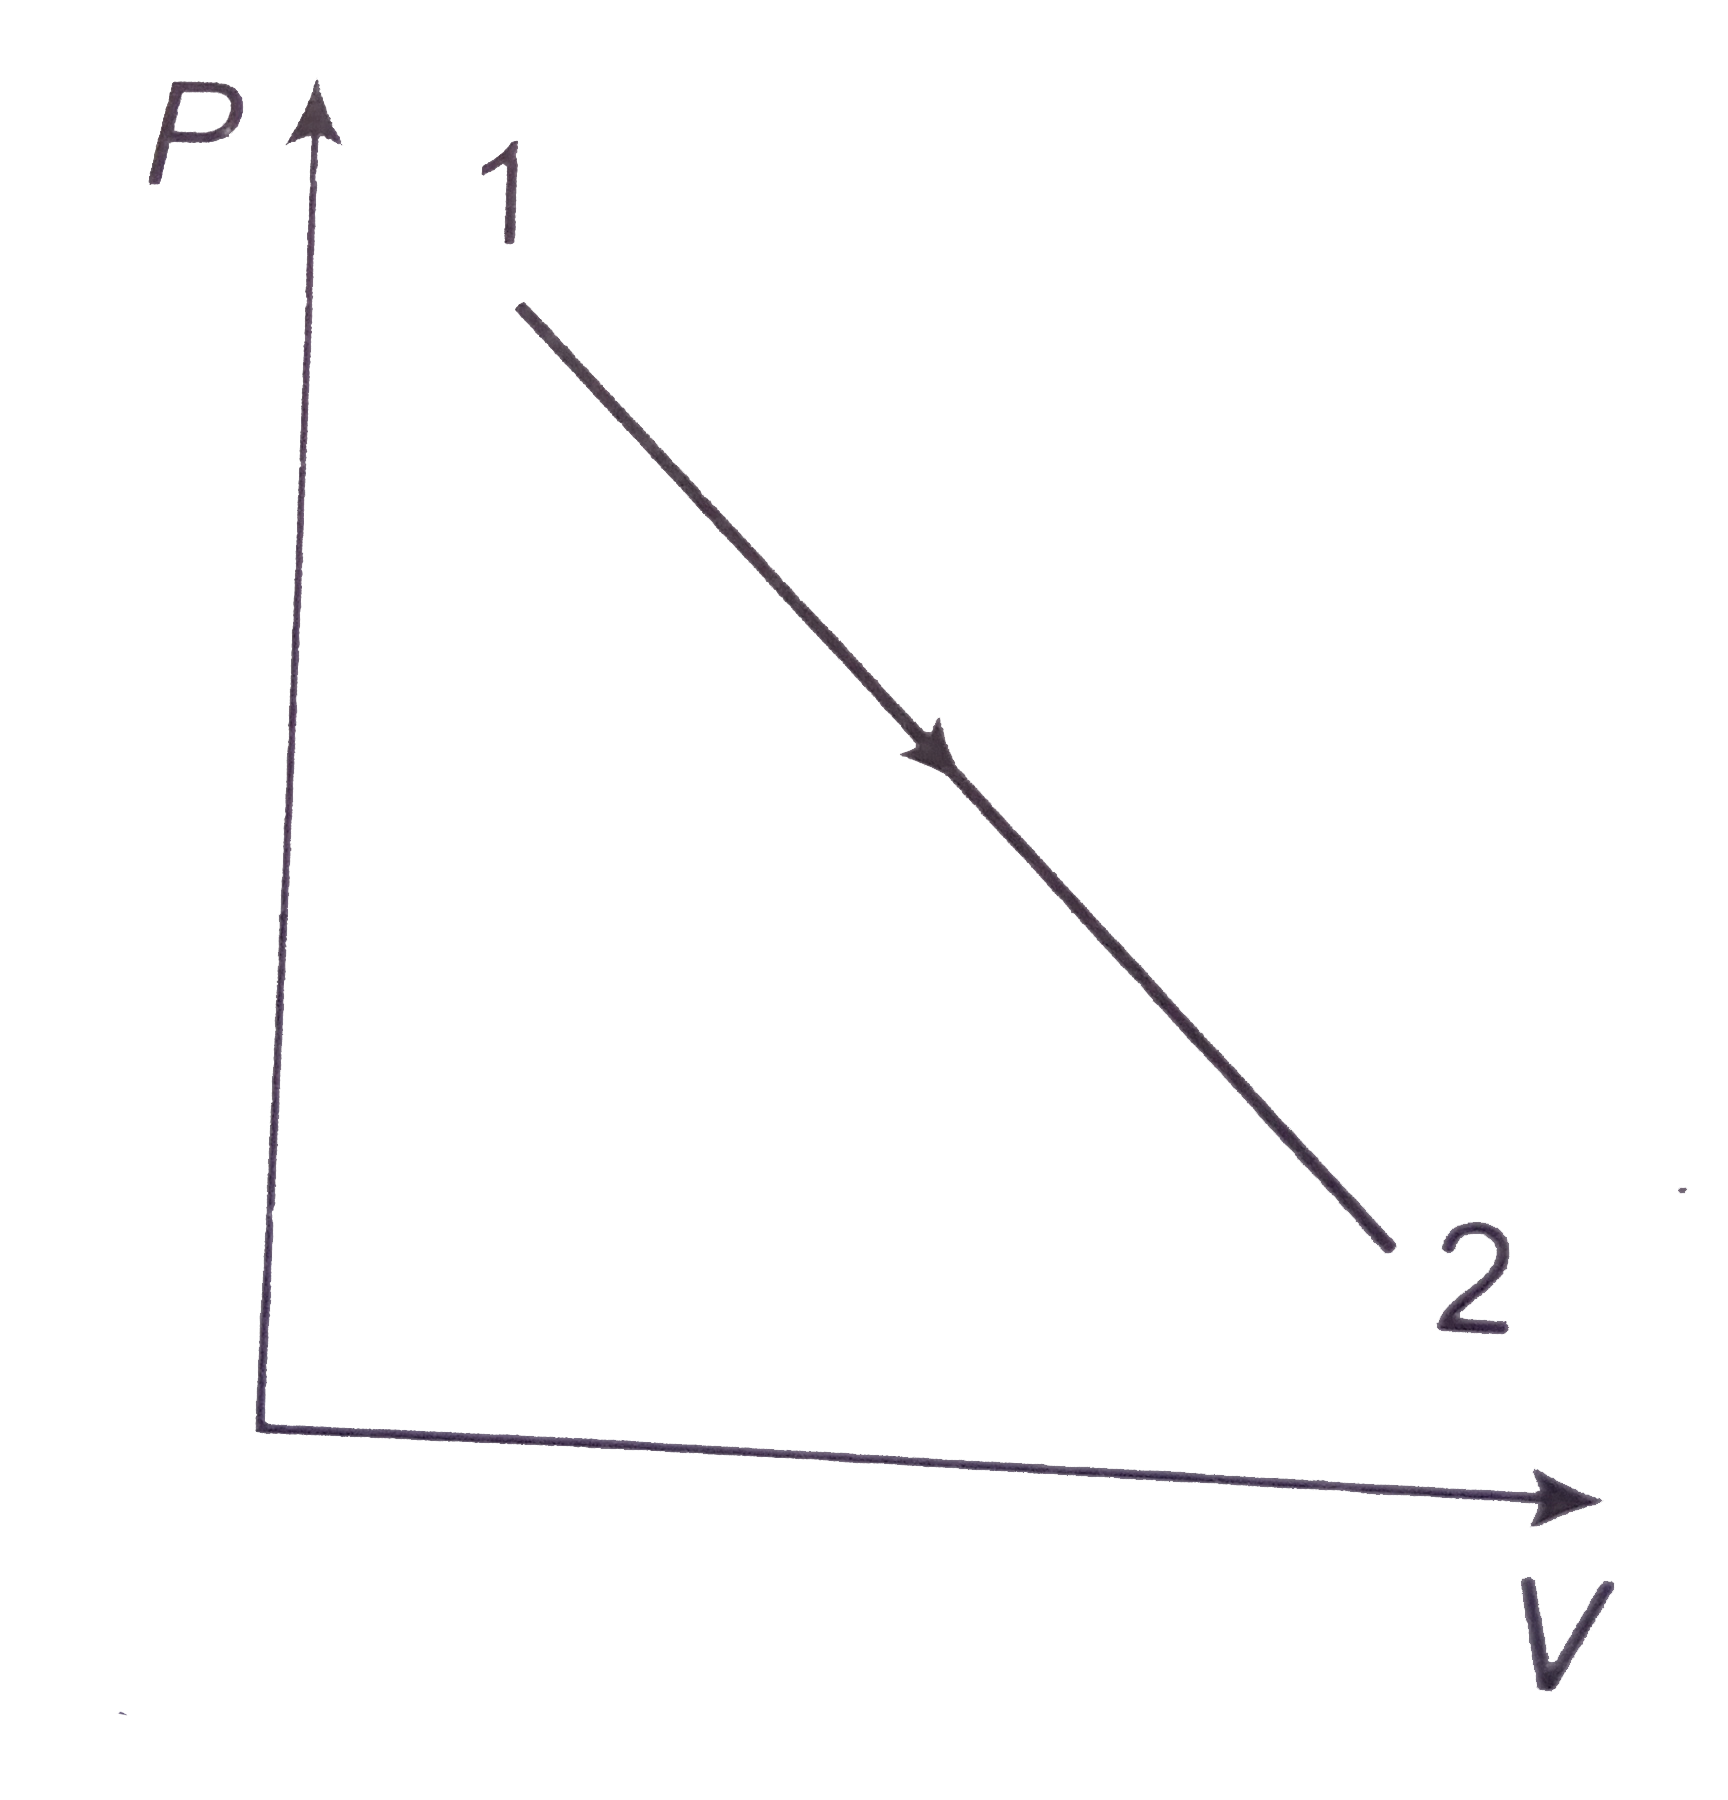
P−V graph was obtained from state 1 to state 2 when a given mass of a gas is subjected to temperature changes during the process the gas is
View SolutionFor an adiabatic change in a gas, if P,V,T denotes pressure, volume and absolute temperature of a gas at any time and γ is the ratio of specific heats of the gas, then which of the following equation is true?
View SolutionAn ideal gas in thermally insulated vessel at internal (pressure)=P1,(volume)=V1 and absolute temperature=T1 expands irreversiby against zero external, pressure , as shown in the diagram,
The final internal pressure, volume and absolute temperature of the gas are p2,V2andT2, respectively . For this expansion
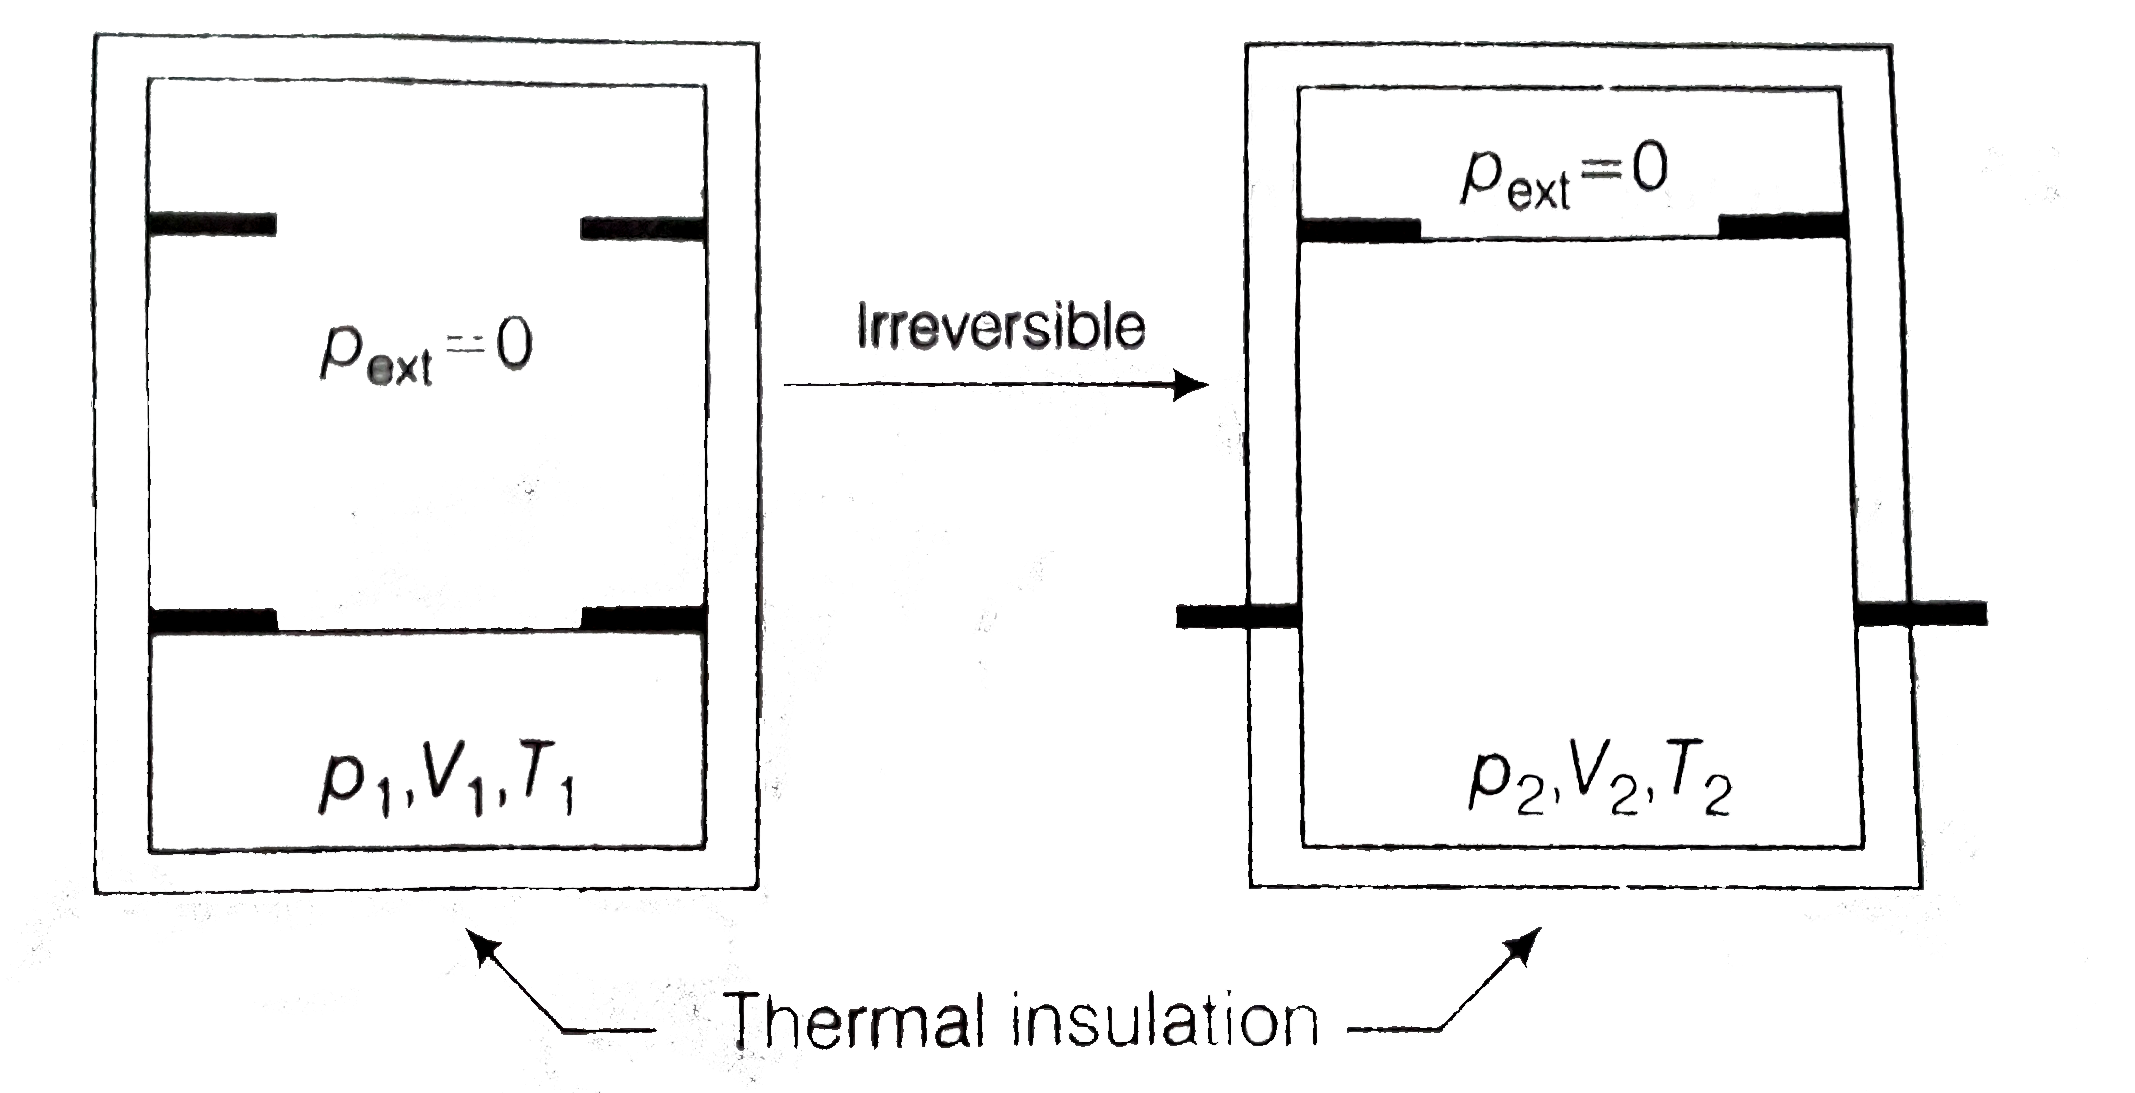
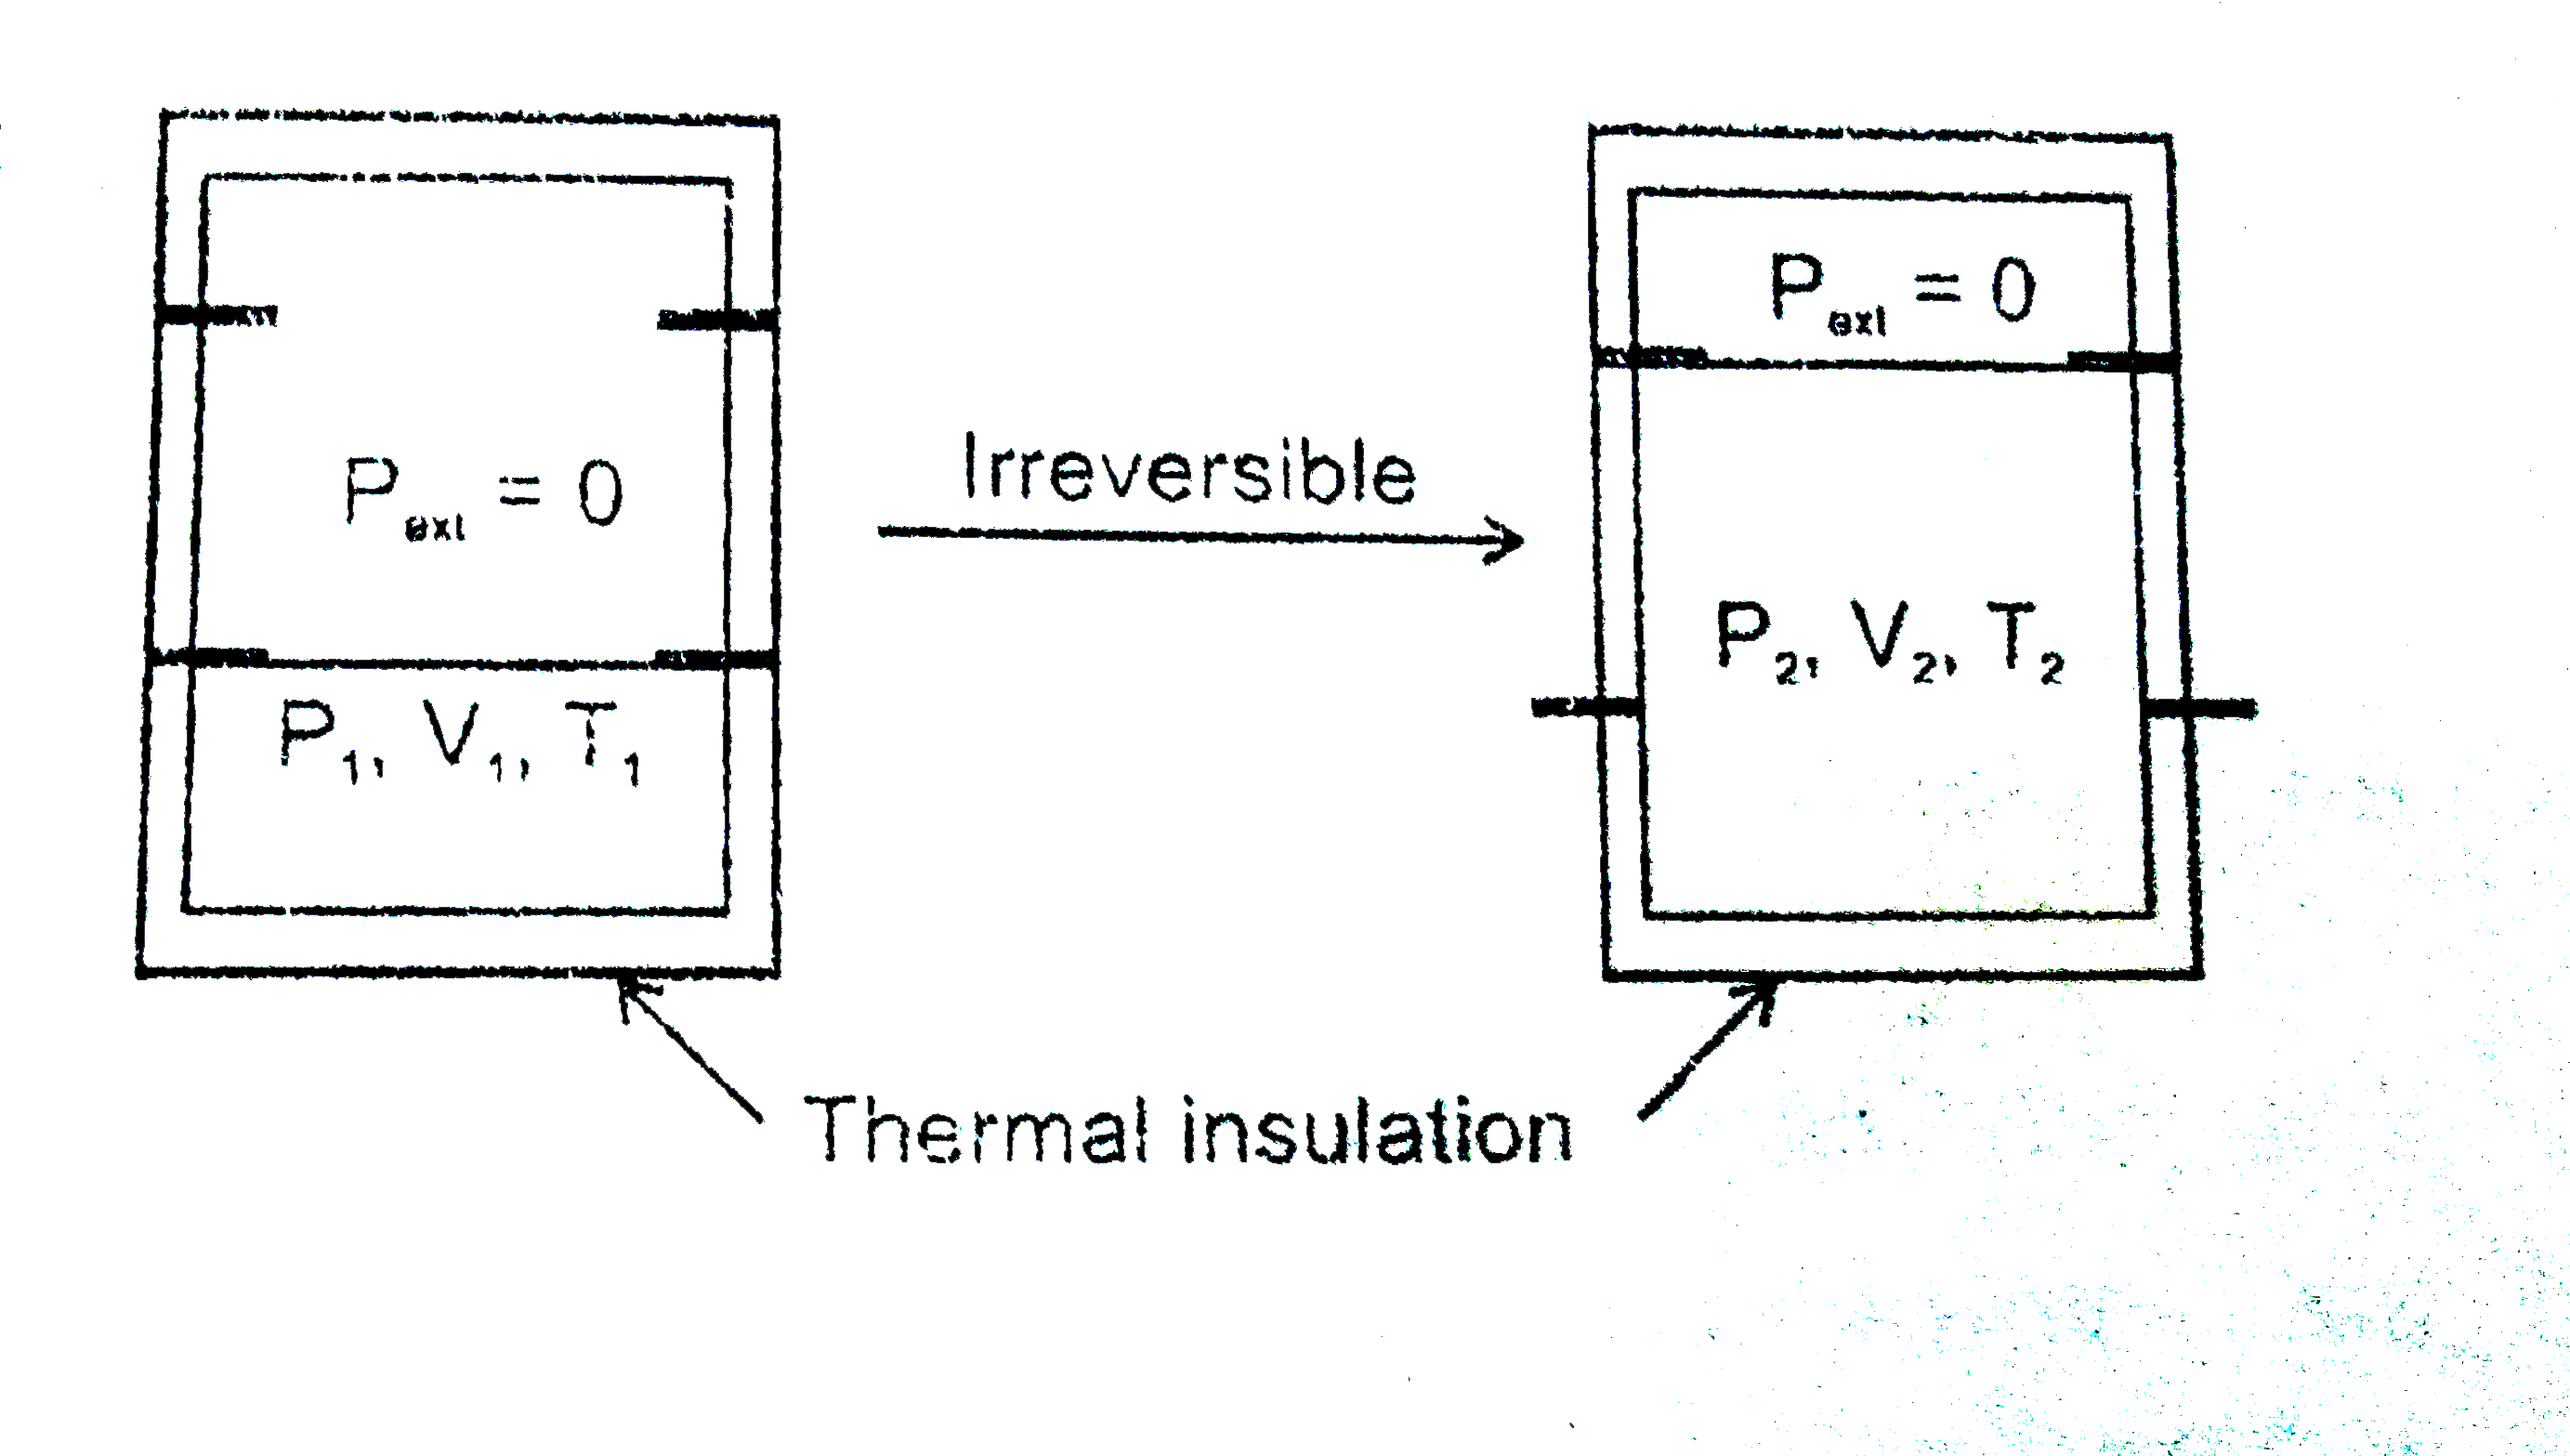
View SolutionAn ideal gas in a thermally insulated vessel at internal pressure =P1, volume =V1 and absolute temperature =T1 expands irreversibly against zero external pressure, as shown in the diagram. The final internal pressure, volume and absolute temperature of the gas are P2,V2 and T2 respectively. For this expansion.
View SolutionIf the ratio of specific heat of a gas of constant pressure to that at constant volume is γ, the change in internal energy of the mass of gas, when the volume changes from V to 2V at constant pressure p is
View Solution