In Boyles experiment for a given gas at different temperature the graph drawn between pressure and density are straight lines as shown then
_E01_060_Q01.png)
T1>T2
T2>T1
T1=T2
T31=T2
The correct Answer is:A
_E01_060_S01.png)
P = constant , At constant pressure d∝1T from graph d2>d1 then T2<T1
Topper's Solved these Questions
- THERMAL PROPERTIES OF MATTERBook:NARAYNAChapter:THERMAL PROPERTIES OF MATTERExercise:LEVEL-I (C.W.)
Explore 23 Videos
- THERMAL PROPERTIES OF MATTERBook:NARAYNAChapter:THERMAL PROPERTIES OF MATTERExercise:LEVEL-II (C.W.)
Explore 27 Videos
- THERMAL PROPERTIES OF MATTERBook:NARAYNAChapter:THERMAL PROPERTIES OF MATTERExercise:Examples
Explore 50 Videos
- SYSTEM OF PARTICLES AND ROTATIONAL MOTION Book:NARAYNAChapter:SYSTEM OF PARTICLES AND ROTATIONAL MOTION Exercise:EXERCISE - IV
Explore 39 Videos
- THERMODYNAMICSBook:NARAYNAChapter:THERMODYNAMICSExercise:Exercise
Explore 187 Videos
Similar Questions
Knowledge Check
For a given mass of gas isobar is the graph drawn between
AP and volume at constant TBT and P at constant VCT and V at constant PDP and 1V at constant TAt a given temperature, the pressure of an ideal gas of density ρ is proportional to
A1ρ2B1ρCρ2Dρ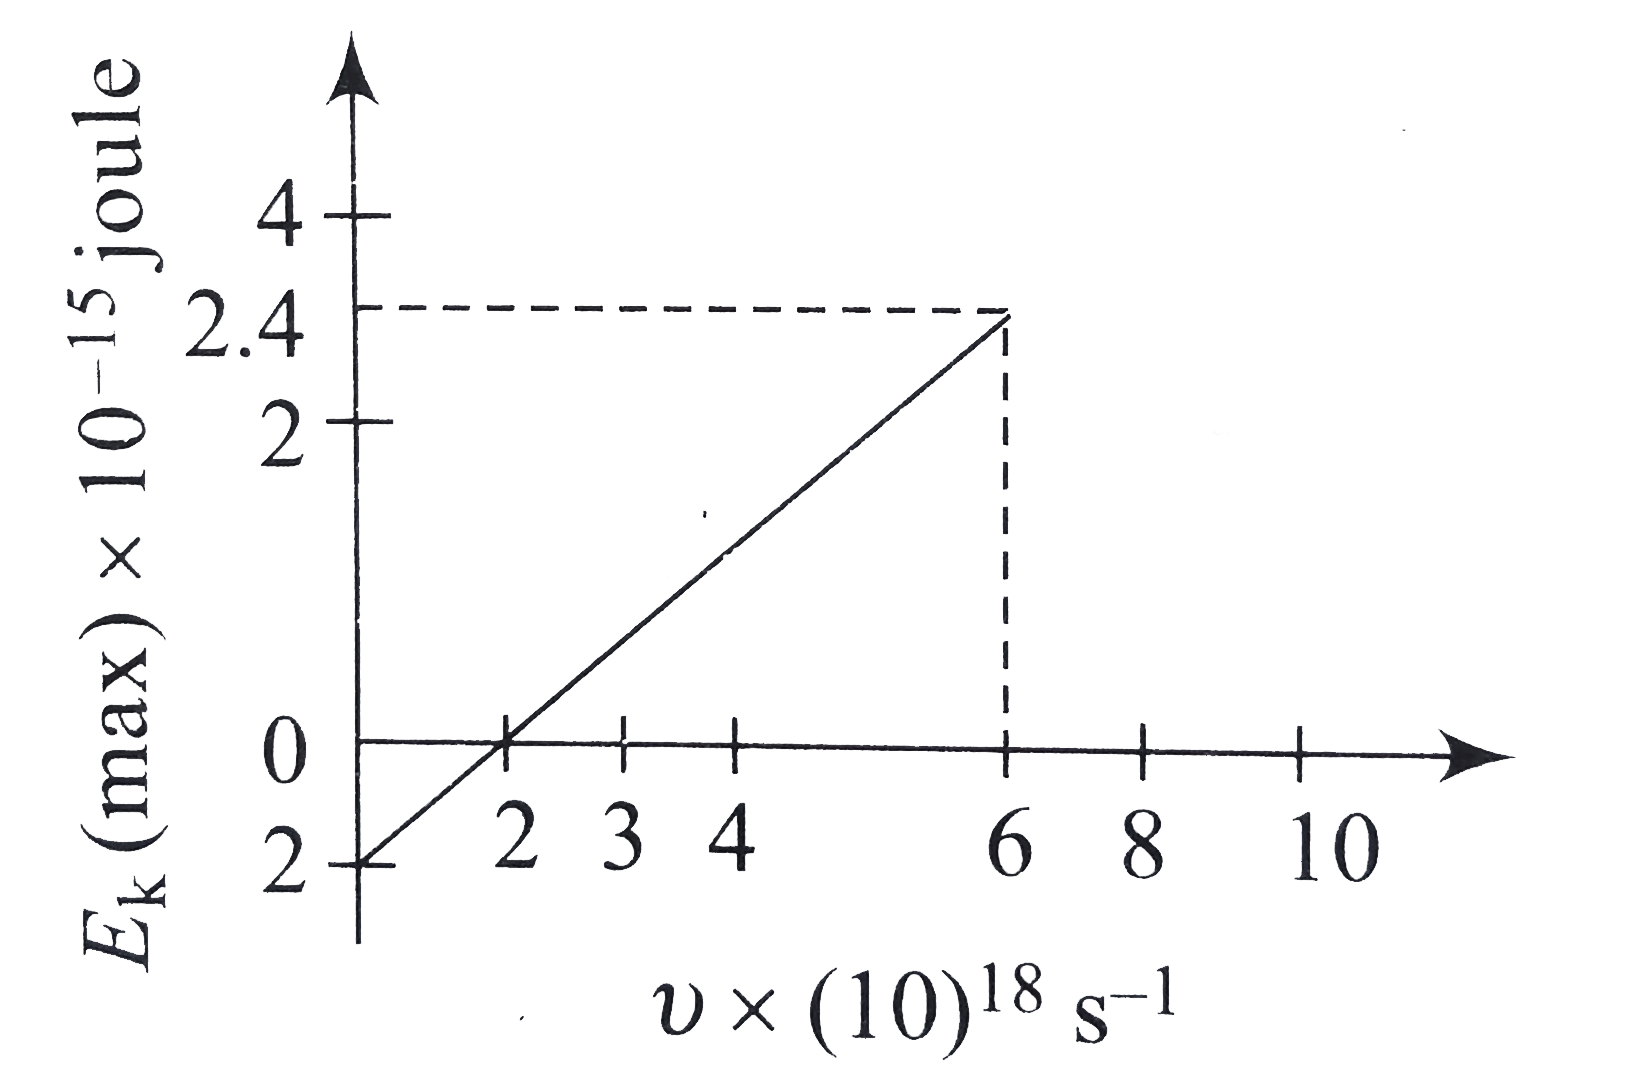
In the experiment on photoelectric effect, the graph between EK(max) and v is found to be a straight line as sshoen in fig. The threshold frequency and Planck's constant according to this graph areA3.33×1018s−1,6×10⁻³⁴J−sB6..1018s−1,6×10⁻³⁴J−sC2.66×1018s−1,4×10⁻³⁴J−sD4×1018s−1,3×10⁻³⁴J−s
The graph drawn between rate and time is a straight line parallel to x-axis.The order of the reaction is
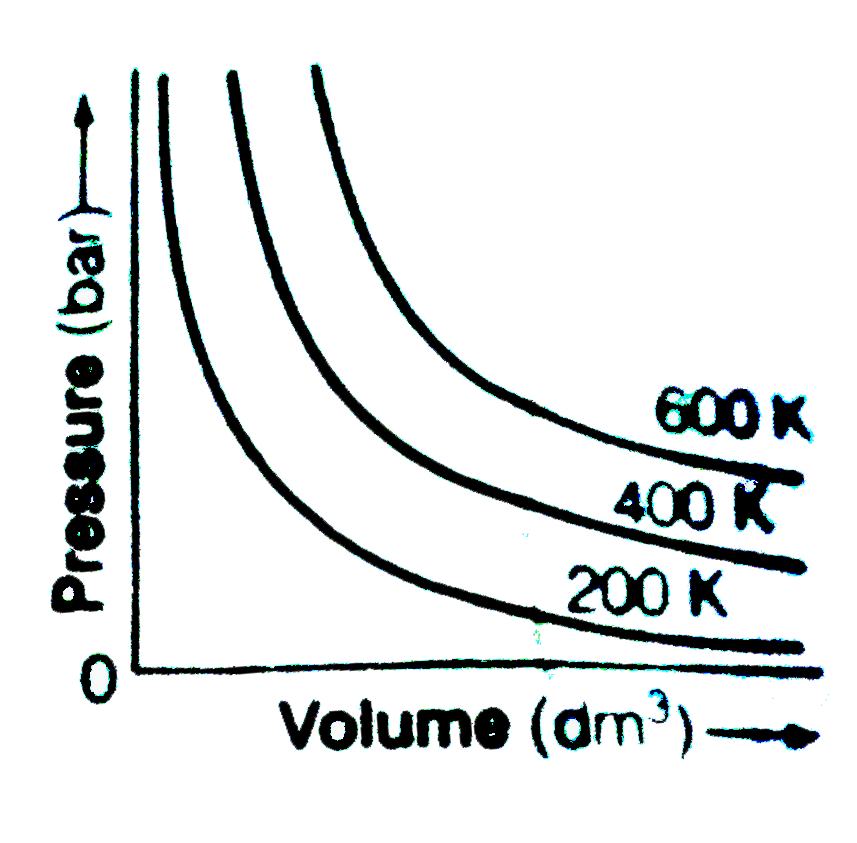
View SolutionThe variation of pressure with volume of the gas at different temperatures can be graphically represented as shown in figure. On the basis of this graph answer the following questions.
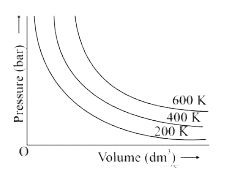
How will the volume of a gas change if its pressure is increased at constant temperature?
View SolutionThe variation of pressure with volume of the gas at different temperatures can be graphically represented as shown in figure. On the basis of this graph answer the following question.
(i) How will the volume of a gas change if its pressure is increased at constant temperature ?
(ii) At a constant pressure, how will the volume of a gas change if the temperature is increased from 200 K to 400 K ?
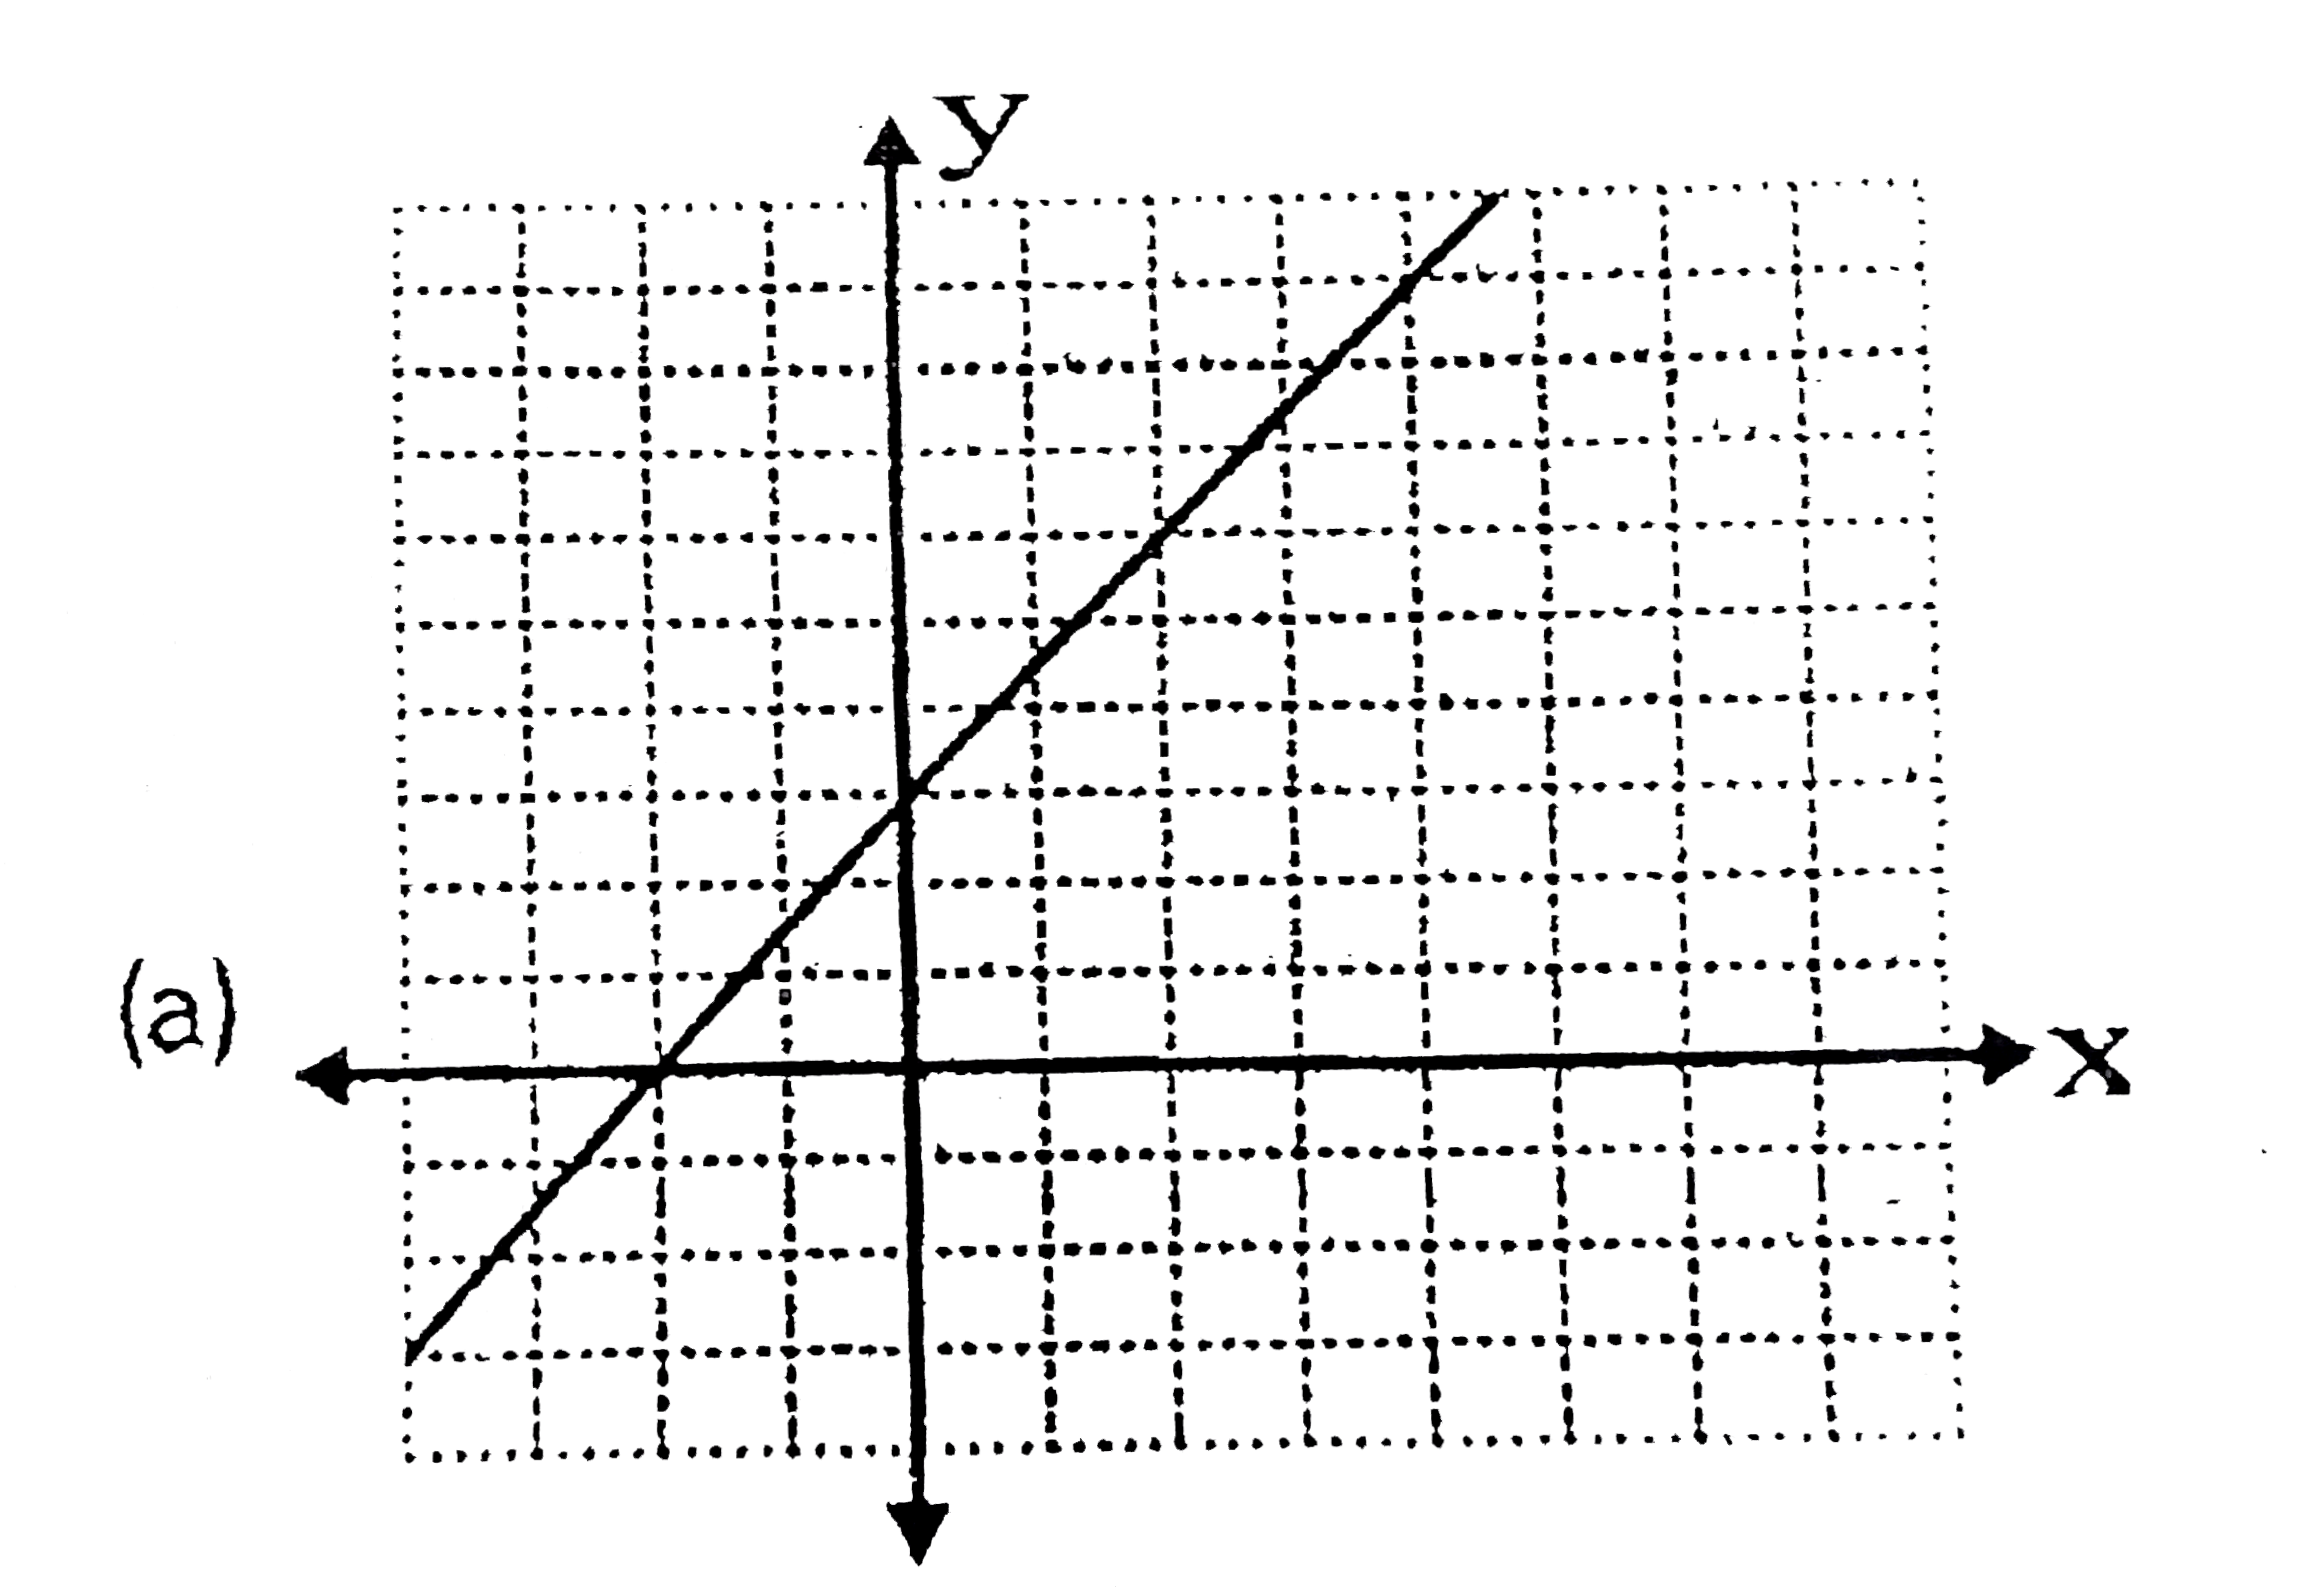
View SolutionWrite equations for the straight lines shown in the following graphs.
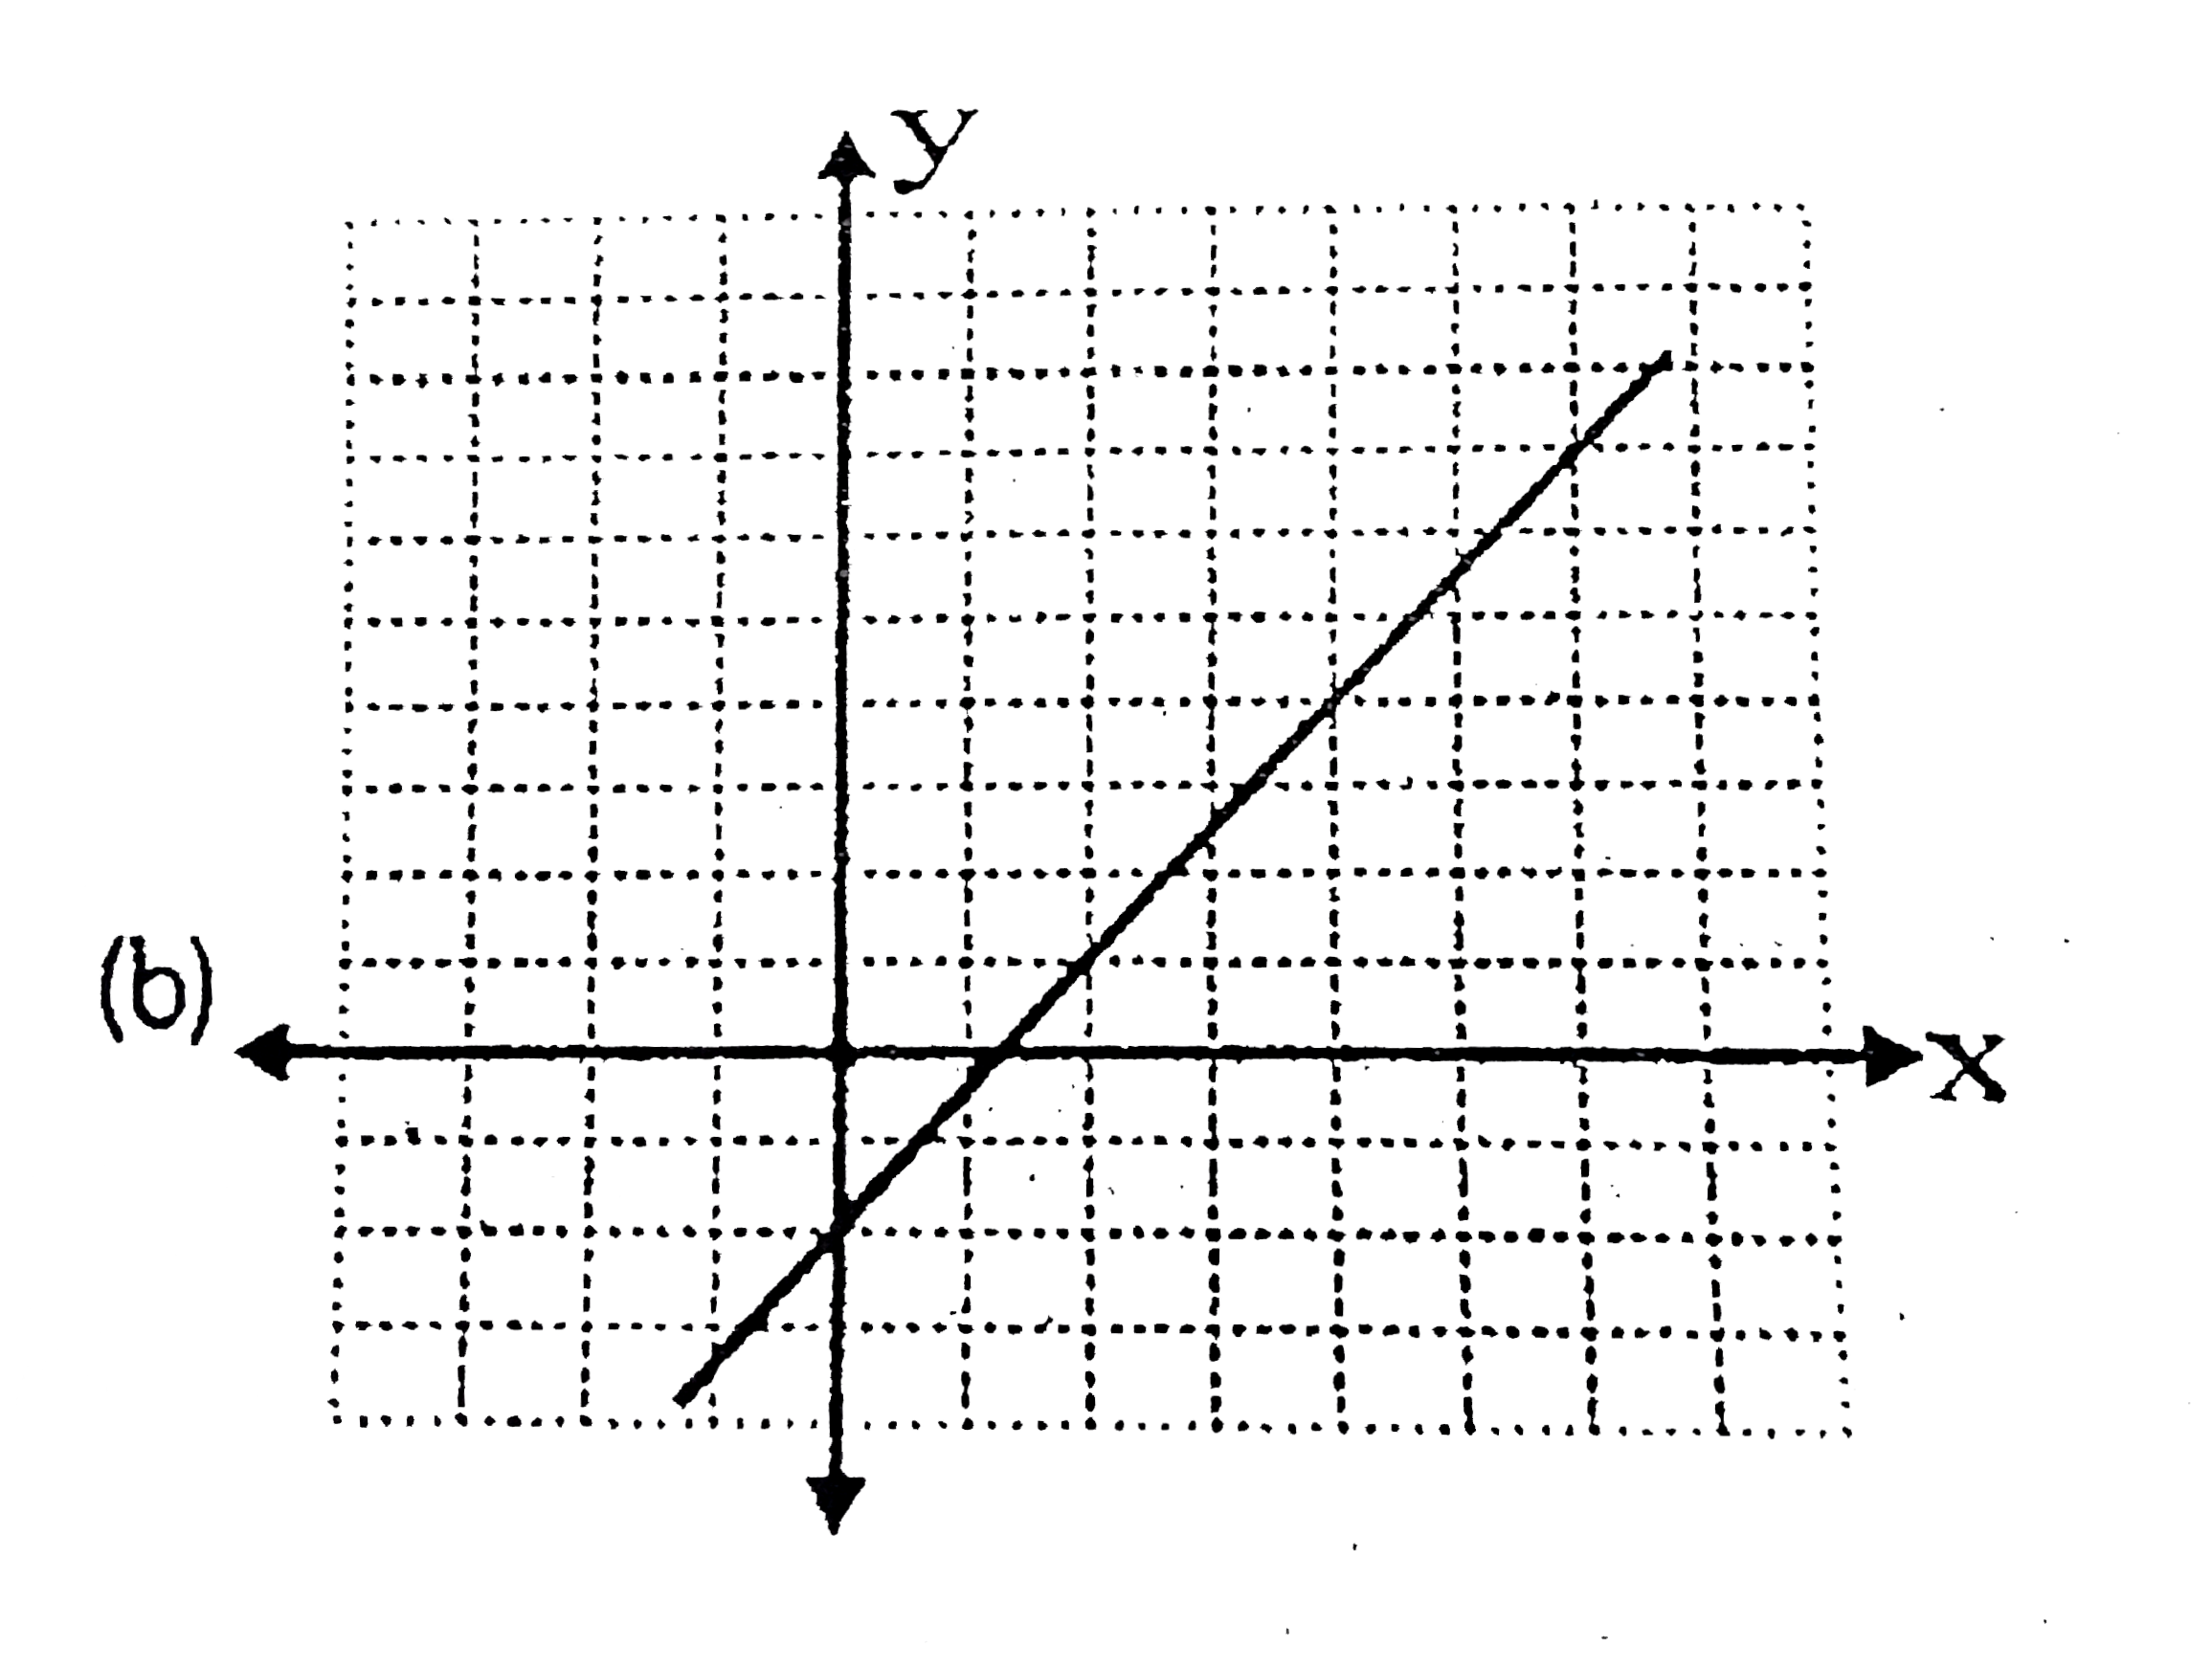
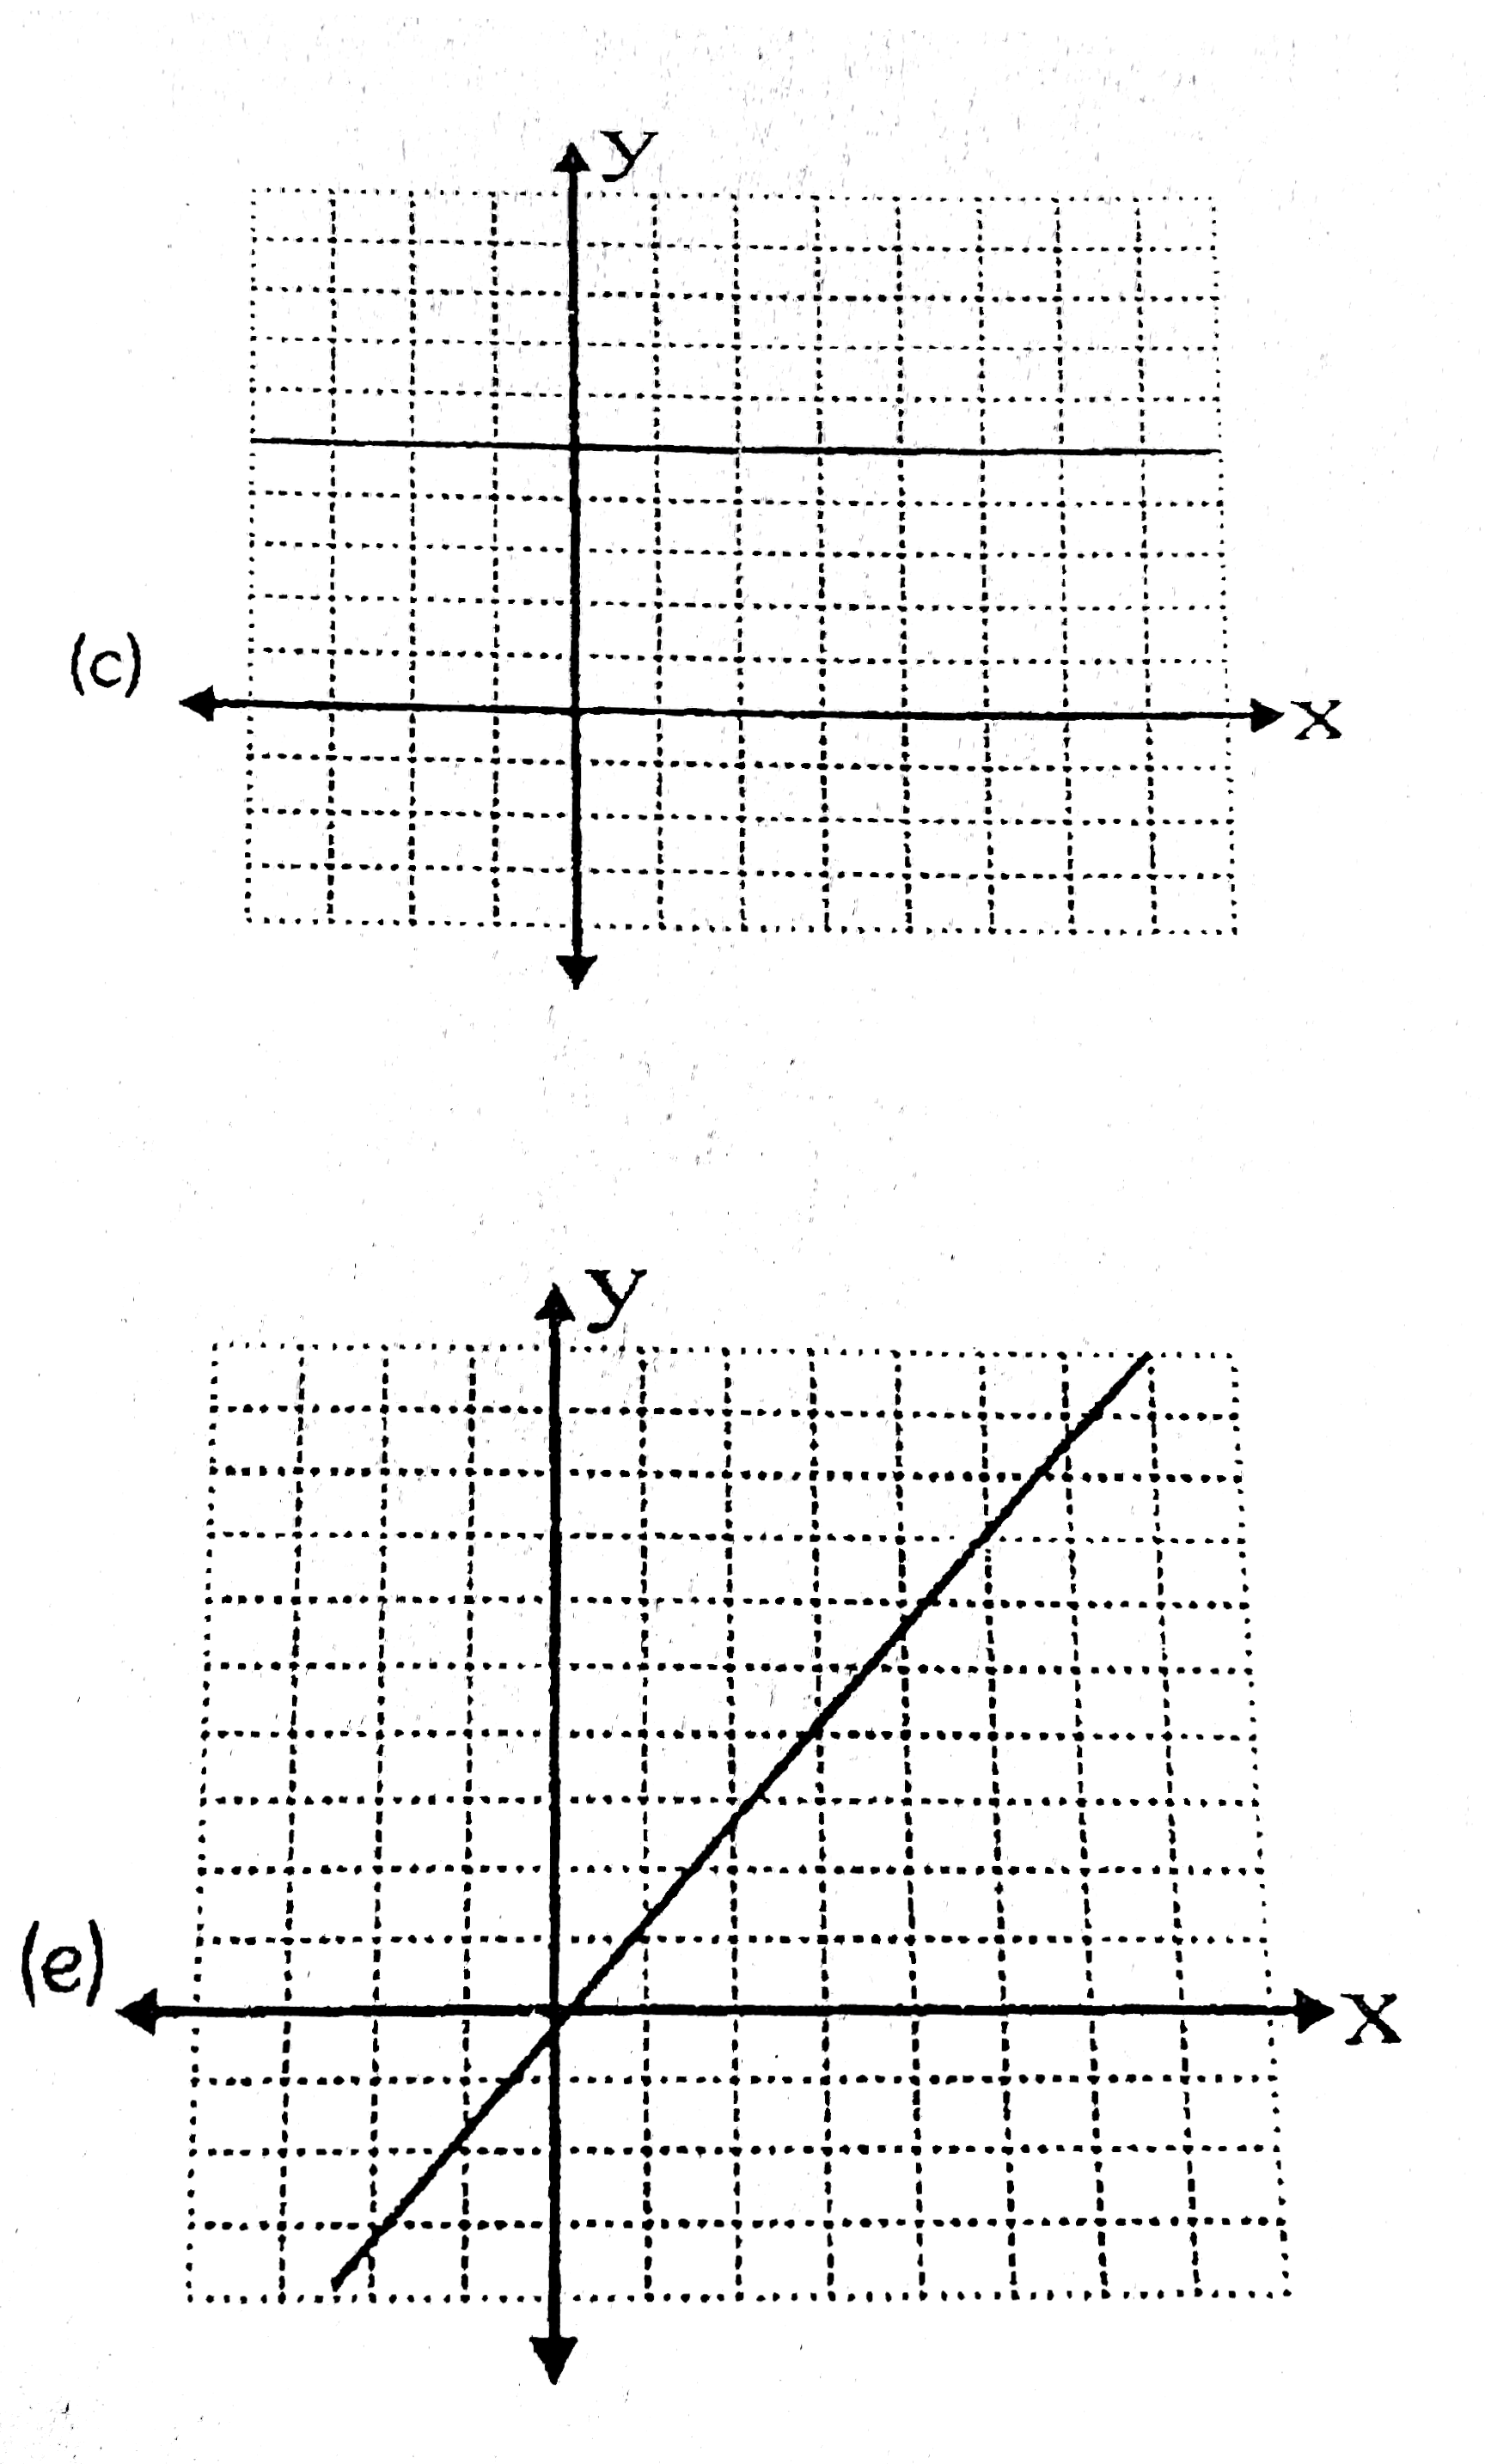

View SolutionAt a given volume and temperature the pressure of a gas
View Solution
