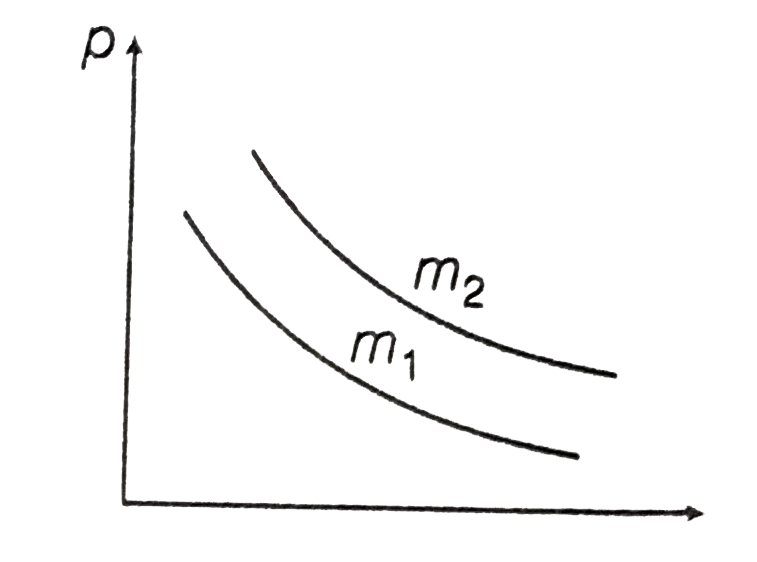
The graph drawn between pressure and volume lin Boyles law experiment is shown in figure for different masses of same gas at same temperature then _E01_059_Q01.png)
A
m2>m1
B
m1<m2
C
m1=m2
D
m31=m2
Video Solution
Text Solution
The correct Answer is:A
_E01_059_S01.png)
PV=mMRRT same gas is used at constant pressure
V∝m from graph, V2>V1 then m2>m1
|
Topper's Solved these Questions
- THERMAL PROPERTIES OF MATTERBOOK - NARAYNACHAPTER - THERMAL PROPERTIES OF MATTEREXERCISE - LEVEL-I (C.W.)
23 Videos
- THERMAL PROPERTIES OF MATTERBOOK - NARAYNACHAPTER - THERMAL PROPERTIES OF MATTEREXERCISE - LEVEL-II (C.W.)
27 Videos
- THERMAL PROPERTIES OF MATTERBOOK - NARAYNACHAPTER - THERMAL PROPERTIES OF MATTEREXERCISE - Examples
50 Videos
- SYSTEM OF PARTICLES AND ROTATIONAL MOTION BOOK - NARAYNACHAPTER - SYSTEM OF PARTICLES AND ROTATIONAL MOTION EXERCISE - EXERCISE - IV
39 Videos
- THERMODYNAMICSBOOK - NARAYNACHAPTER - THERMODYNAMICSEXERCISE - Exercise
187 Videos
Similar Questions
Knowledge Check
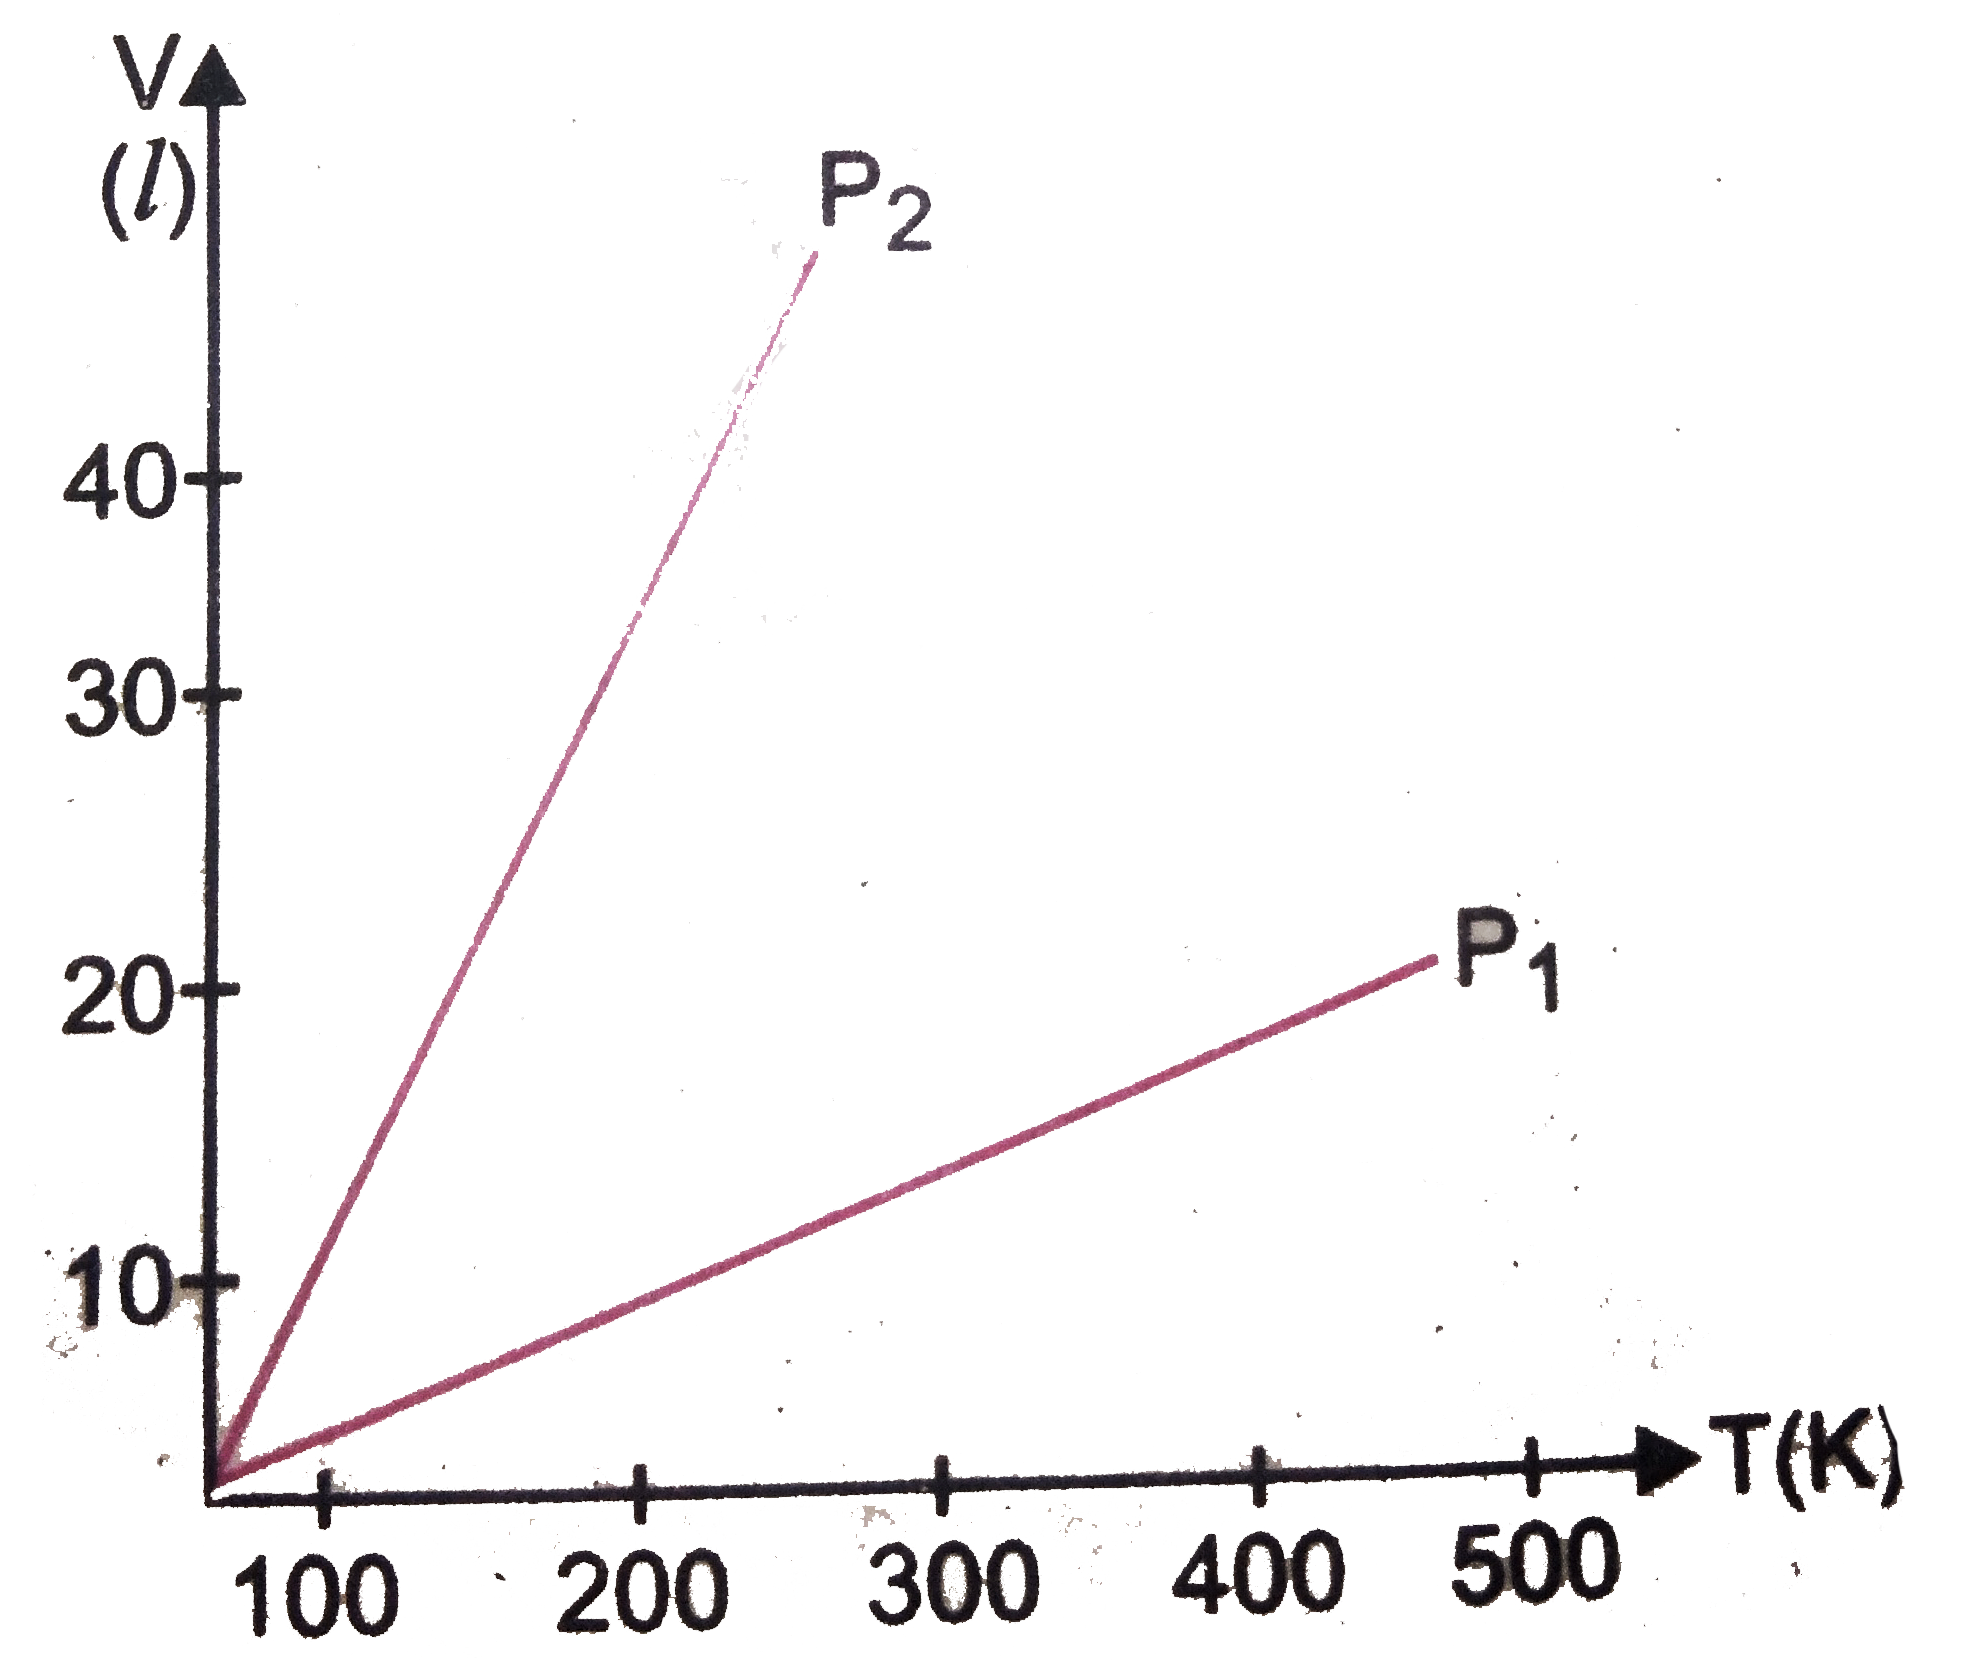
Volume versus temperature graphs for a given mass of an ideal gas are shown in figure. At two different values of constant pressure. What can be inferred about relation between P1 and P2 ?
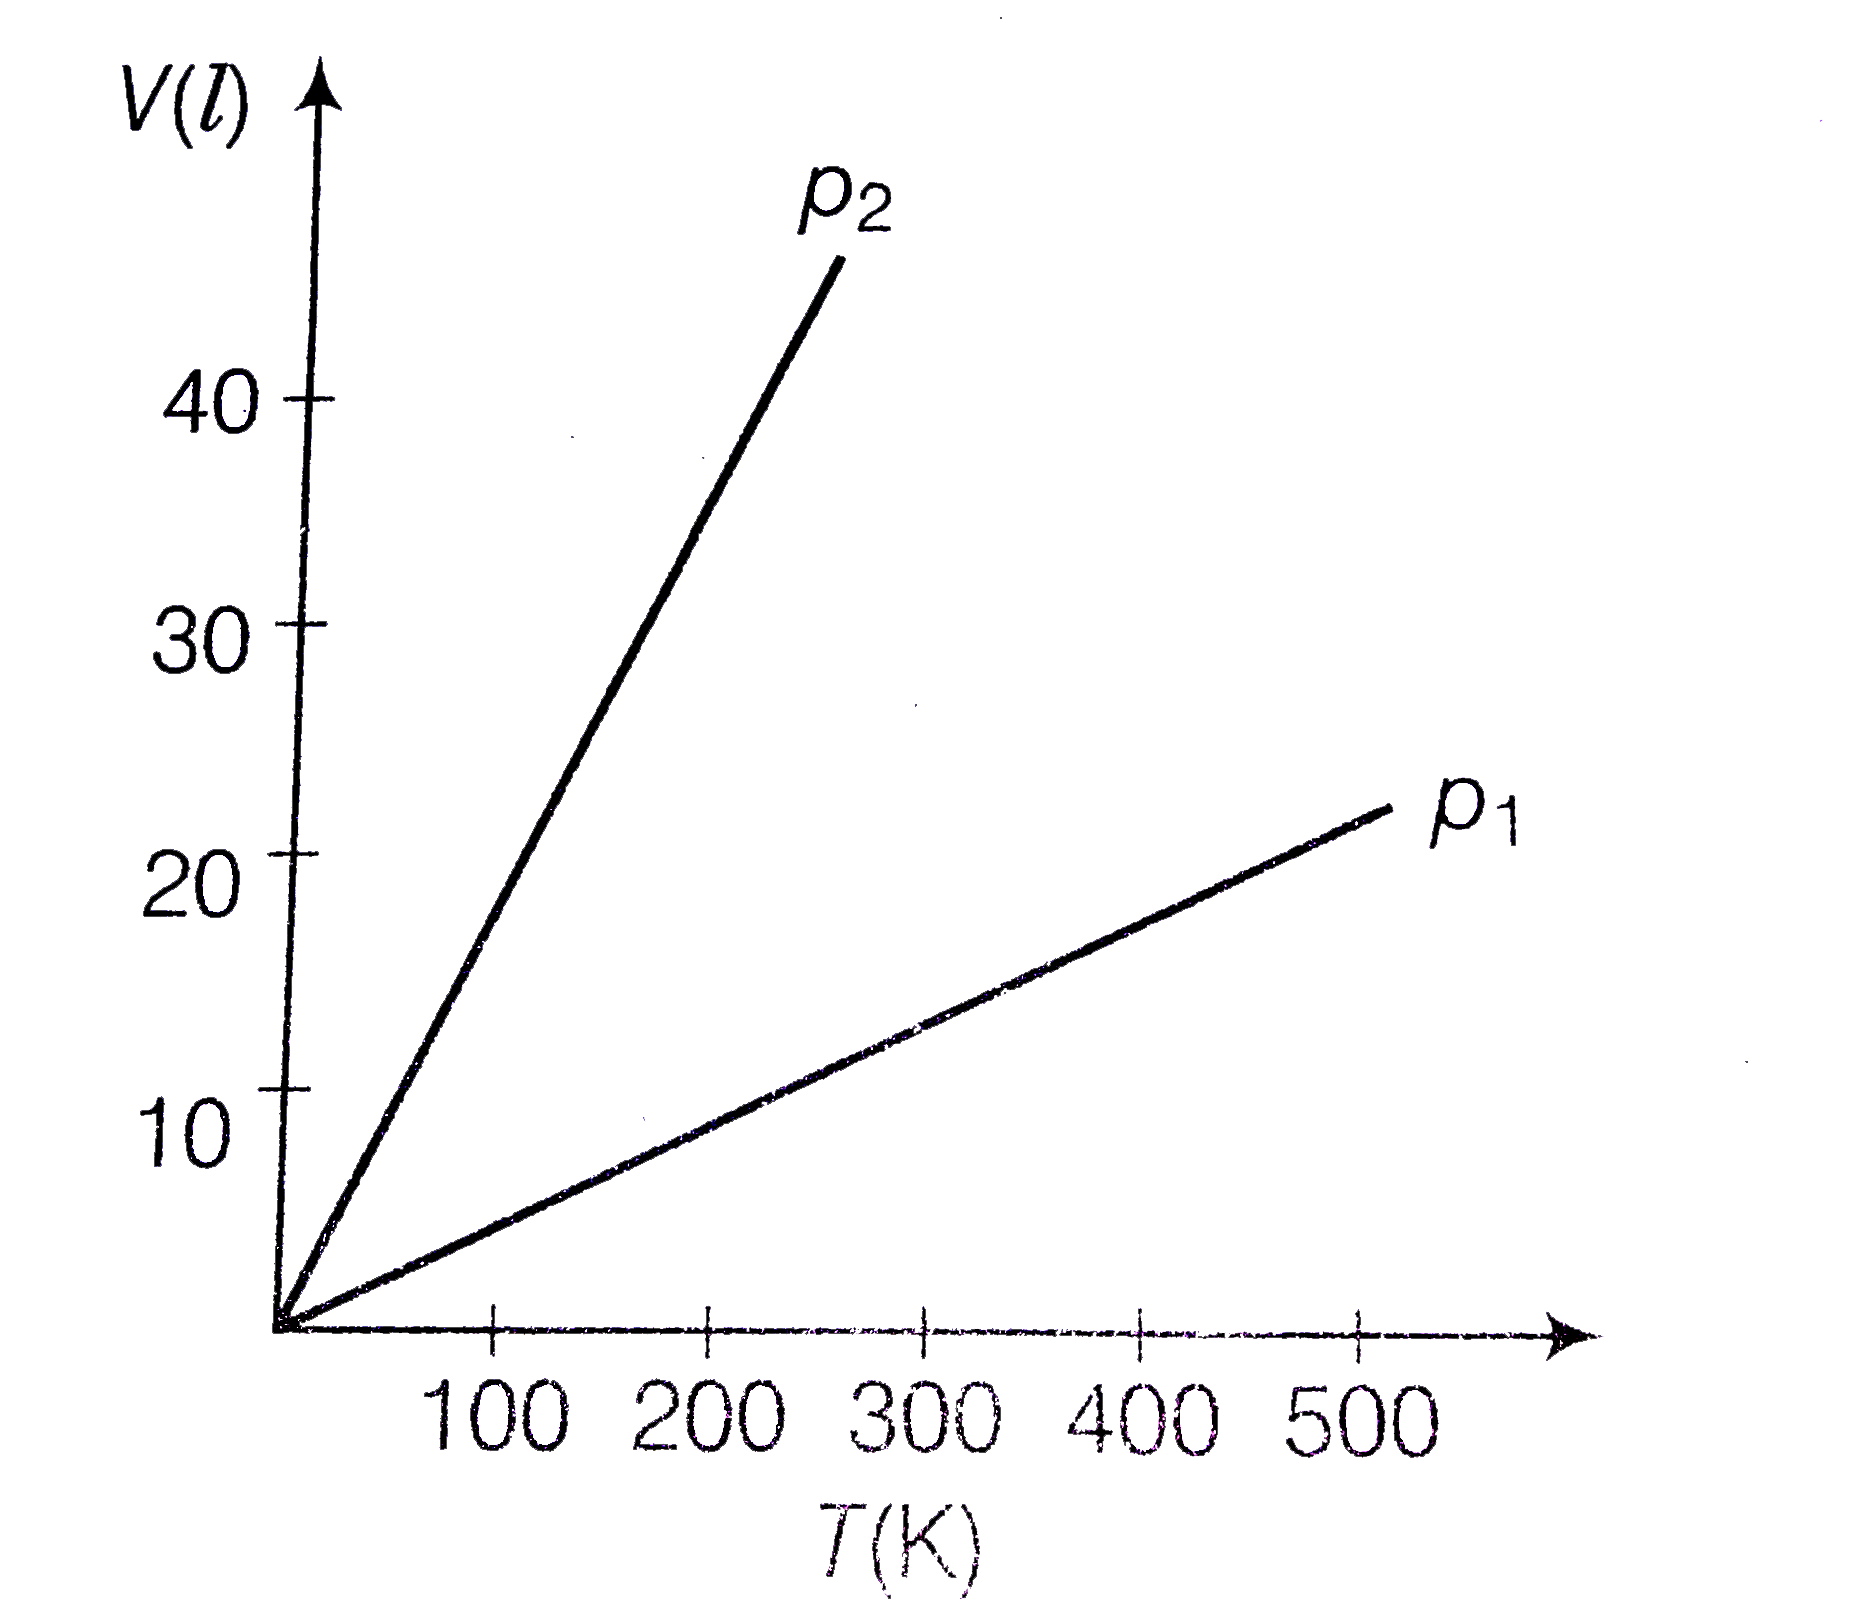 AP1>P2BP1=P2CP1<P2DData is insufficient
For a given mass of gas isobar is the graph drawn between
AP and volume at constant TBT and P at constant VCT and V at constant PDP and 1V at constant TDensity vs volume graph is shown in the figure . Find corresponding pressure vs temperature graph :
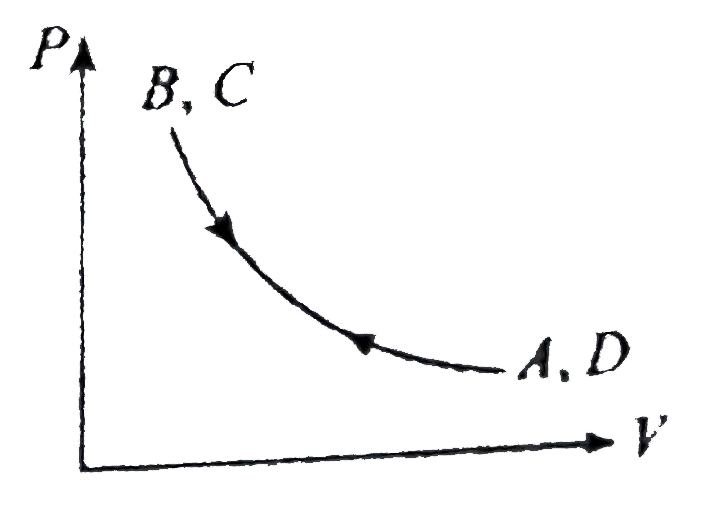 A
A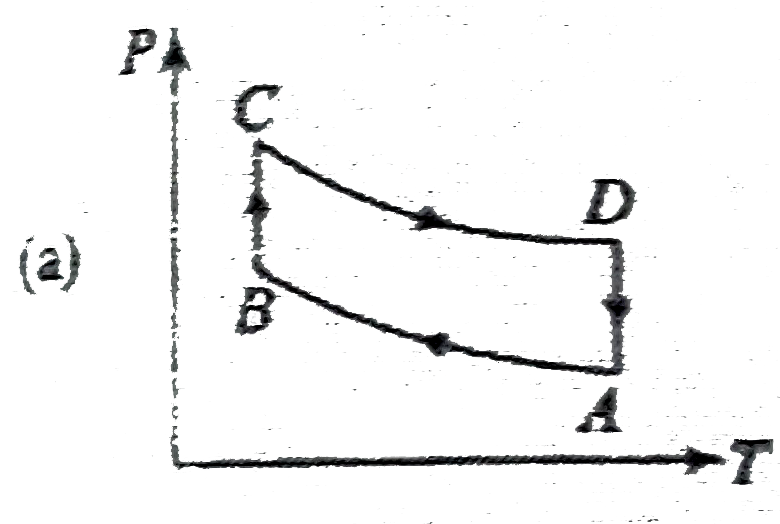 B
B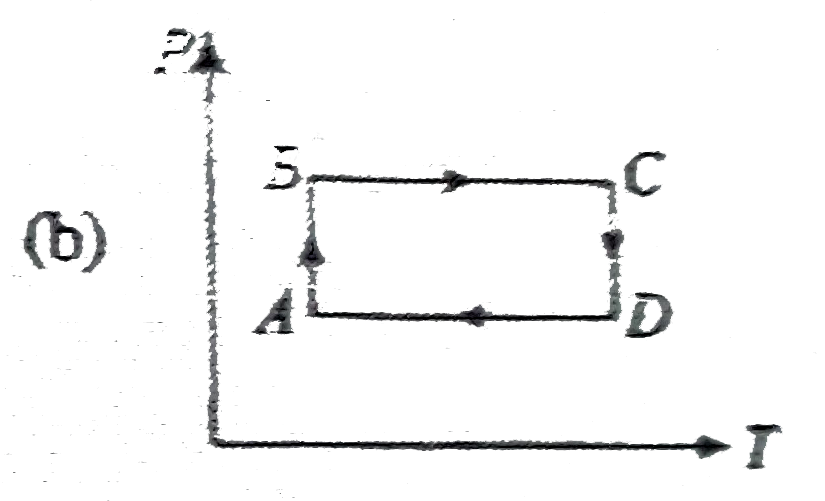 C
C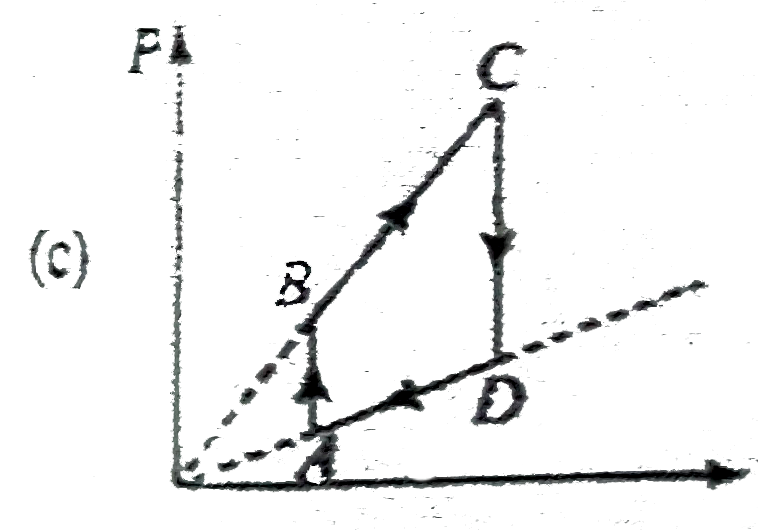 D
D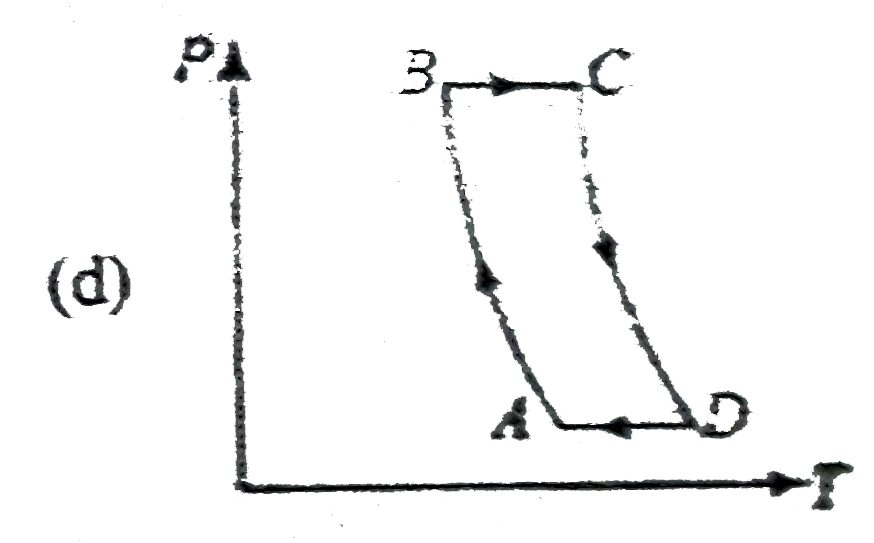
What is the nature of graph between pressure (P) and volume(V)for a given mass of a gas at a fixed temperature ?
View SolutionEstablish the relationship between temperature pressure and volume of a given mass of a gas.
View SolutionDensity vs volume graph is shown in the figure. Find corresponding pressure vs temperature graph
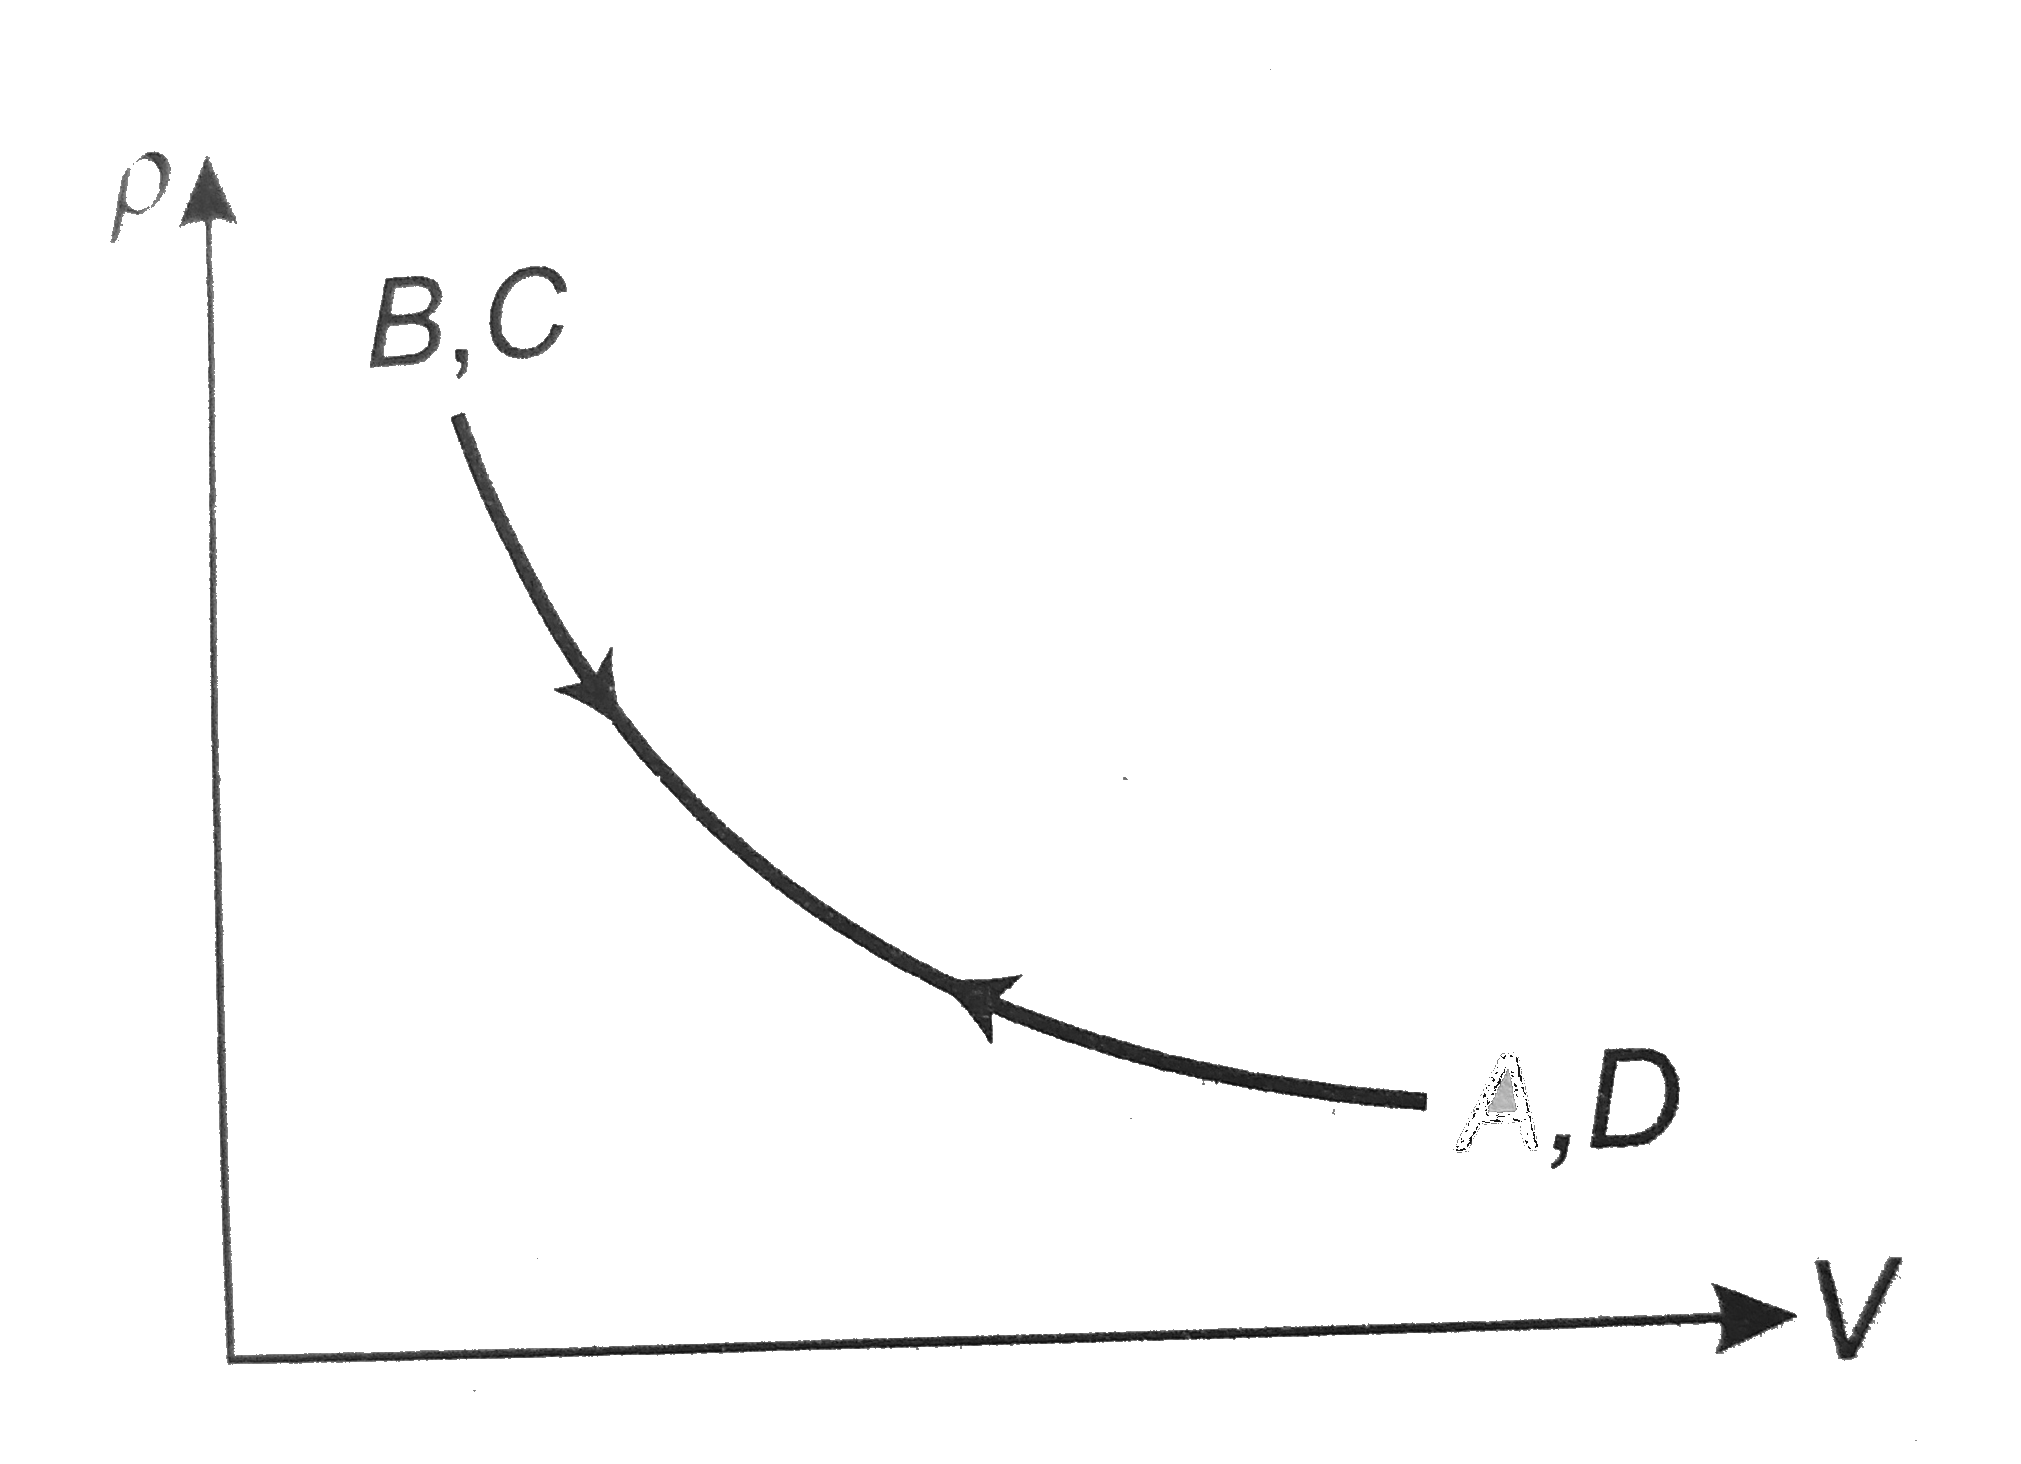
View SolutionTwo different isotherms representing the relationship between pressure p and volume V at a given temperature of the same ideal gas are shown for masses m1 and m2 then
View SolutionVolume versus temperature graphs for a given mass of an ideal gas are shown in Fig. at two different values of constant pressure. What can be inferred about relation between P1andP2?
View Solution