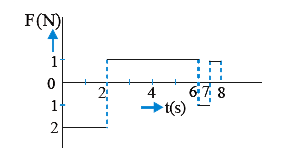
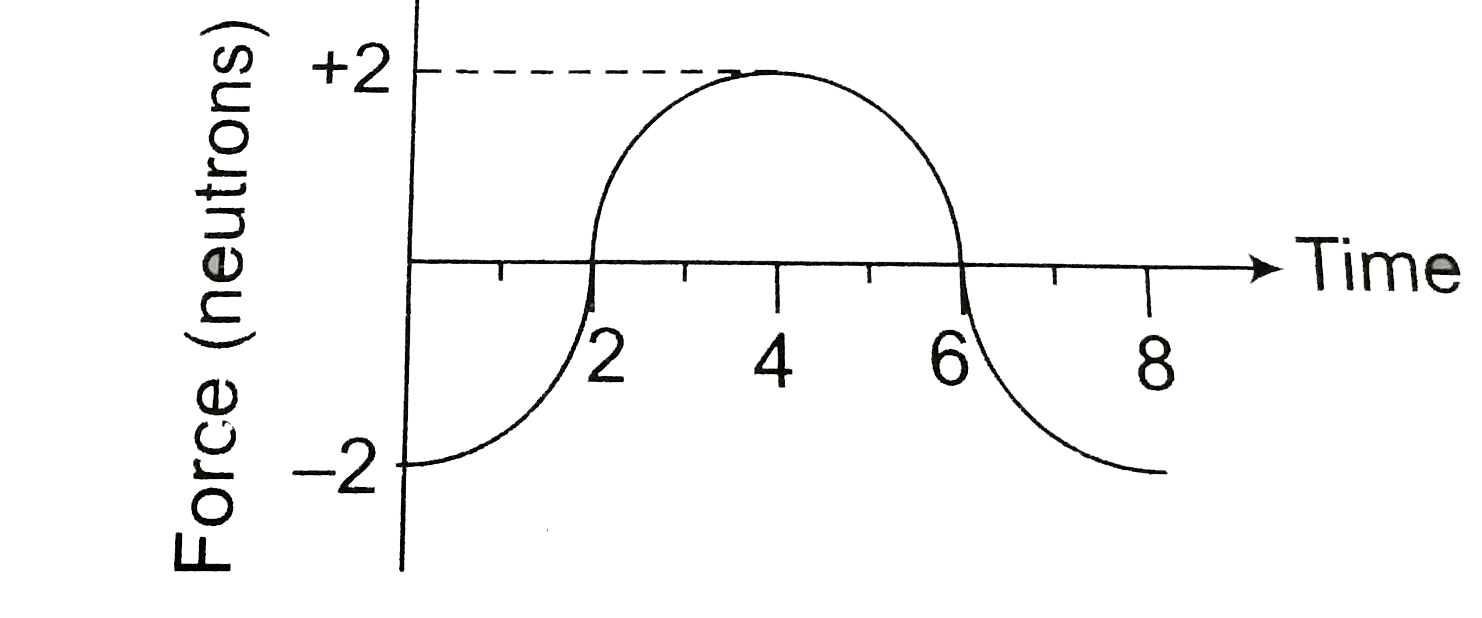
A force-time graph for the motion of a body is shown in the figure. The change in the momentum of the body between zero and 10sec is
A
zero
B
4kgm/s
C
5kgm/s
D
3kgm/s
Video Solution
Text Solution
The correct Answer is:D
As F=dpdt
∫dp=∫Fdt
Δp =area under F−t graph
Δp=12×8×1−2×8.5=3kgm/s
|
Topper's Solved these Questions
- NEWTONS LAWS OF MOTIONBook:A2ZChapter:NEWTONS LAWS OF MOTIONExercise:Equilibrium Of A Particle
Explore 19 Videos
- NEWTONS LAWS OF MOTIONBook:A2ZChapter:NEWTONS LAWS OF MOTIONExercise:Applications Of Newton'S Laws Of Motion
Explore 33 Videos
- NEWTONS LAWS OF MOTIONBook:A2ZChapter:NEWTONS LAWS OF MOTIONExercise:Chapter Test
Explore 30 Videos
- MOTION IN TWO DIMENSIONBook:A2ZChapter:MOTION IN TWO DIMENSIONExercise:Chapter Test
Explore 29 Videos
- OSCILLATION AND SIMPLE HARMONIC MOTIONBook:A2ZChapter:OSCILLATION AND SIMPLE HARMONIC MOTIONExercise:Chapter Test
Explore 29 Videos
Similar Questions
Knowledge Check
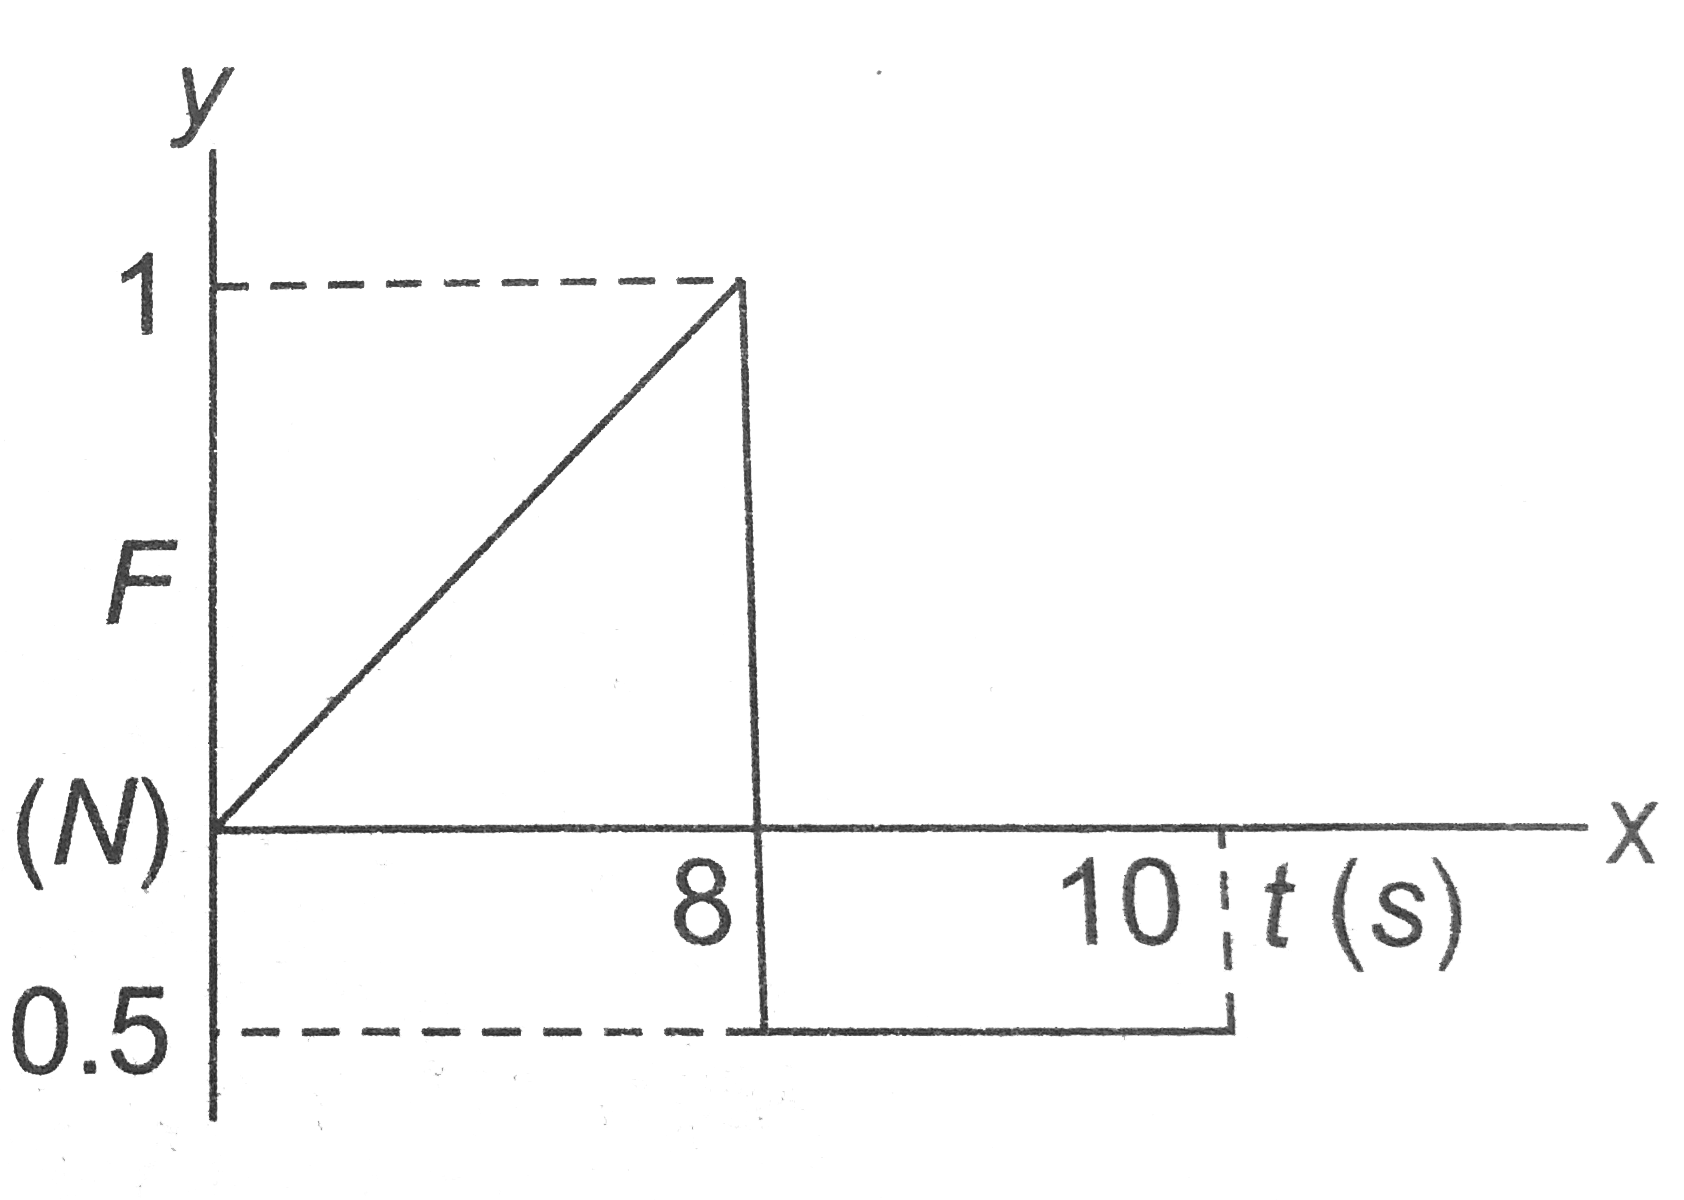
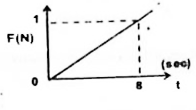
A force-time graph for the motion of a body is shown in figure. Change in linear momentum between 0 and 8 s is:
 AZeroB4 N-sC8 NsDNone of these
A force-time graph for the motion of a body is shown in fig. change in linear momentum between 0 and 8 s is:-
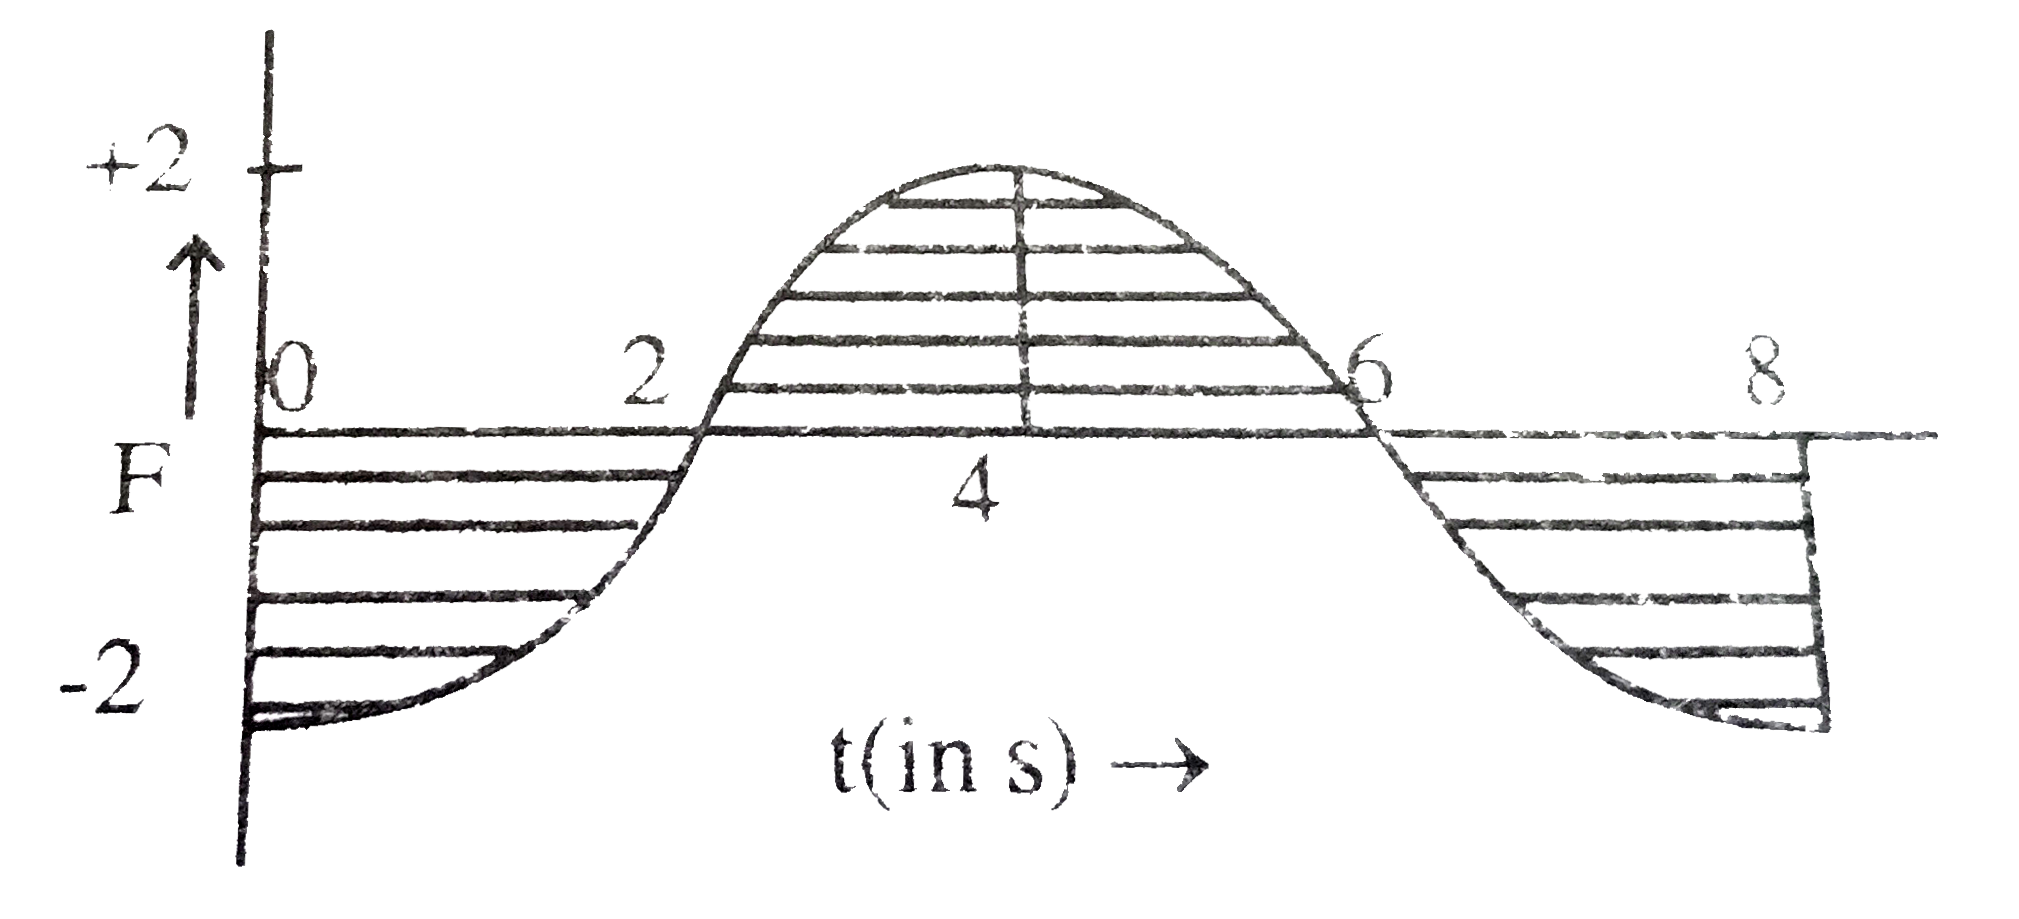 AZeroB4N-sC8NsDNone
A force time graph for the motion of a body is as shown in figure. Change in linear momentum between 0 and 6s is
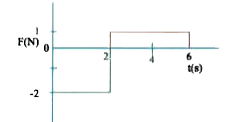 AzeroB8 NsC4 NsD2 Ns
A force time graph for the motion of a body is as shown in Change in linear momentum between 0 and 6s is
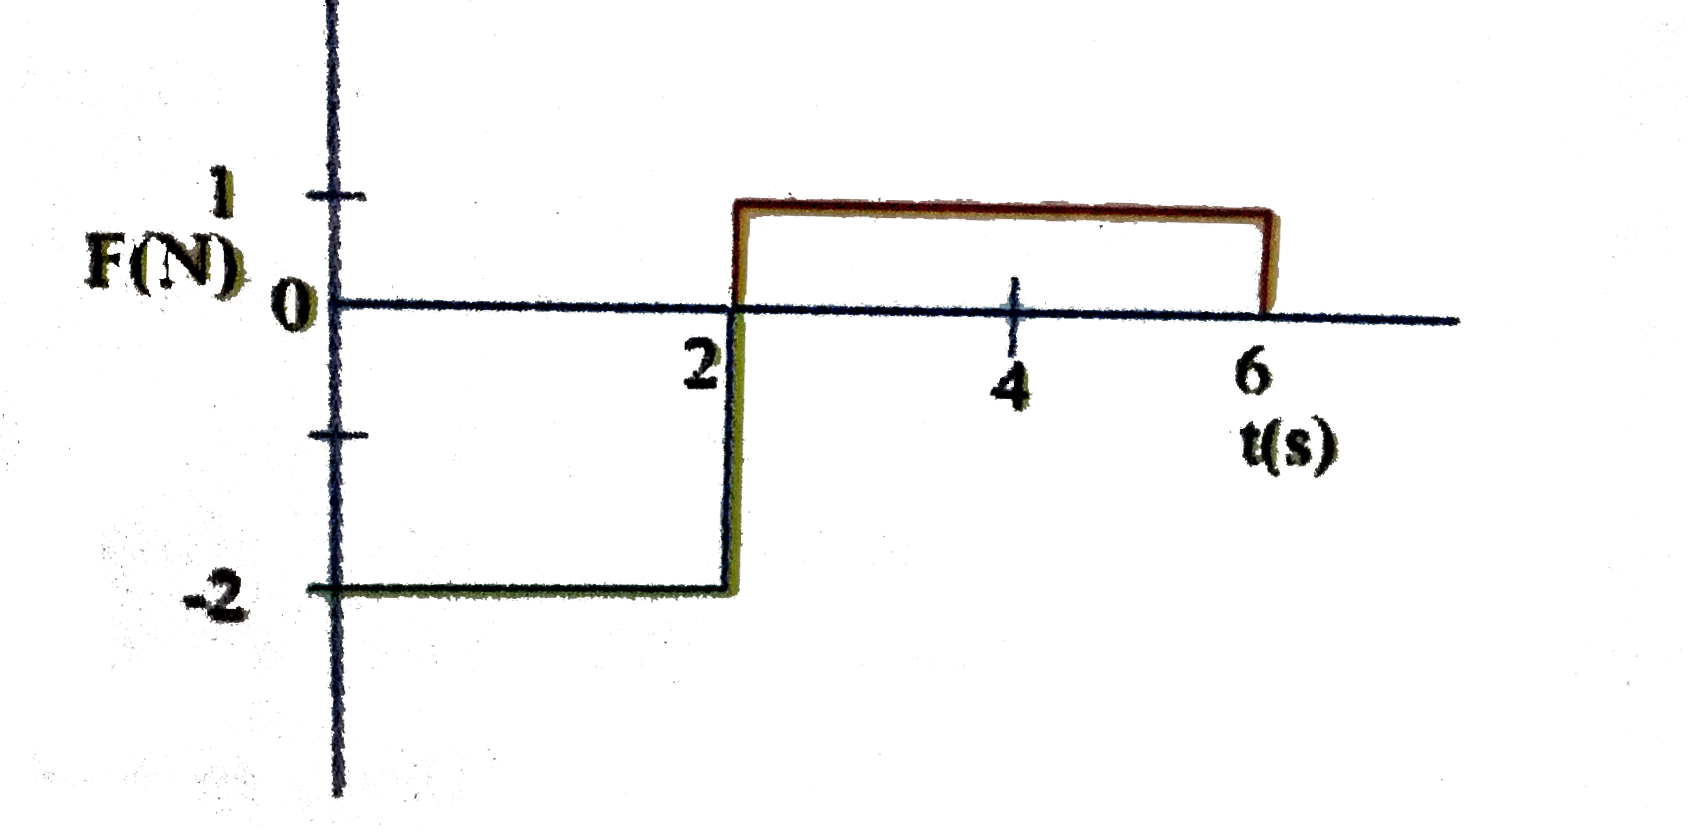 .
.
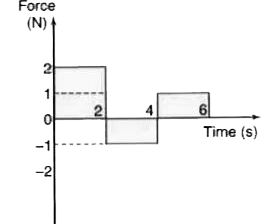
View SolutionA force-time graph for a linear motion is shown in figure. The linear momentum gained between 0 and 6 second is
View SolutionA force - time graph for a linear motion is shown in the figure where the segments are circular. The linear momentum gained between zero and 8s is
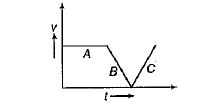
View SolutionThe velocity-time graph of a body is shown in the figure, it implies that at point B
View SolutionThe change in momentum per unit time of body represents .
View Solution


