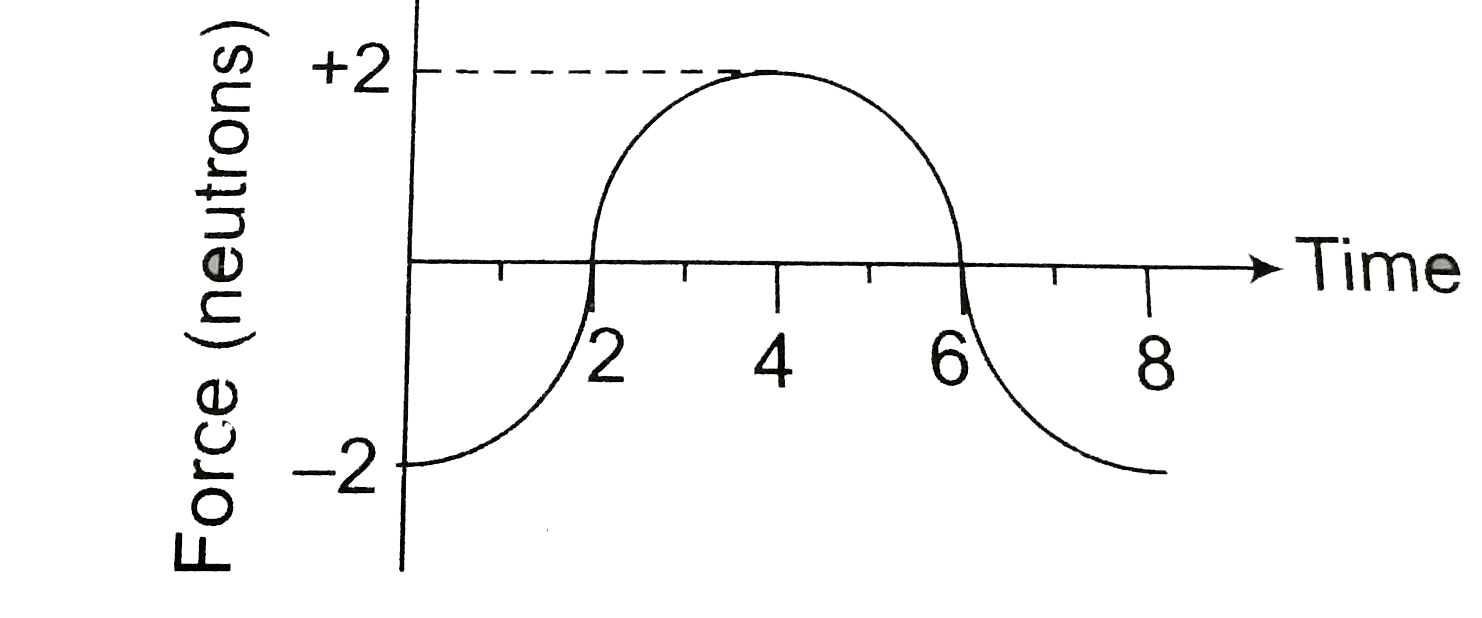
A force - time graph for a linear motion is shown in the figure where the segments are circular. The linear momentum gained between zero and 8s is
A
−2πN−s
B
Zero
C
−4πN−s
D
−6πN−s
Video Solution
Text Solution
The correct Answer is:B
The area of F−t graph gives change in linear momentum.
t=0→t=8s,area=0=Δp
|
Topper's Solved these Questions
Similar Questions
Knowledge Check
A force-time graph for a linear motion is shown in figure. The linear momentum gained between 0 and 6 second is
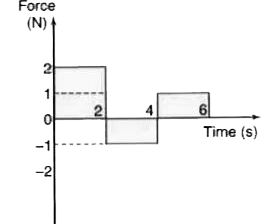 A2NsB4NsC6NsDZero
A force-time graph for the motion of a body is shown in the figure. The change in the momentum of the body between zero and 10sec is
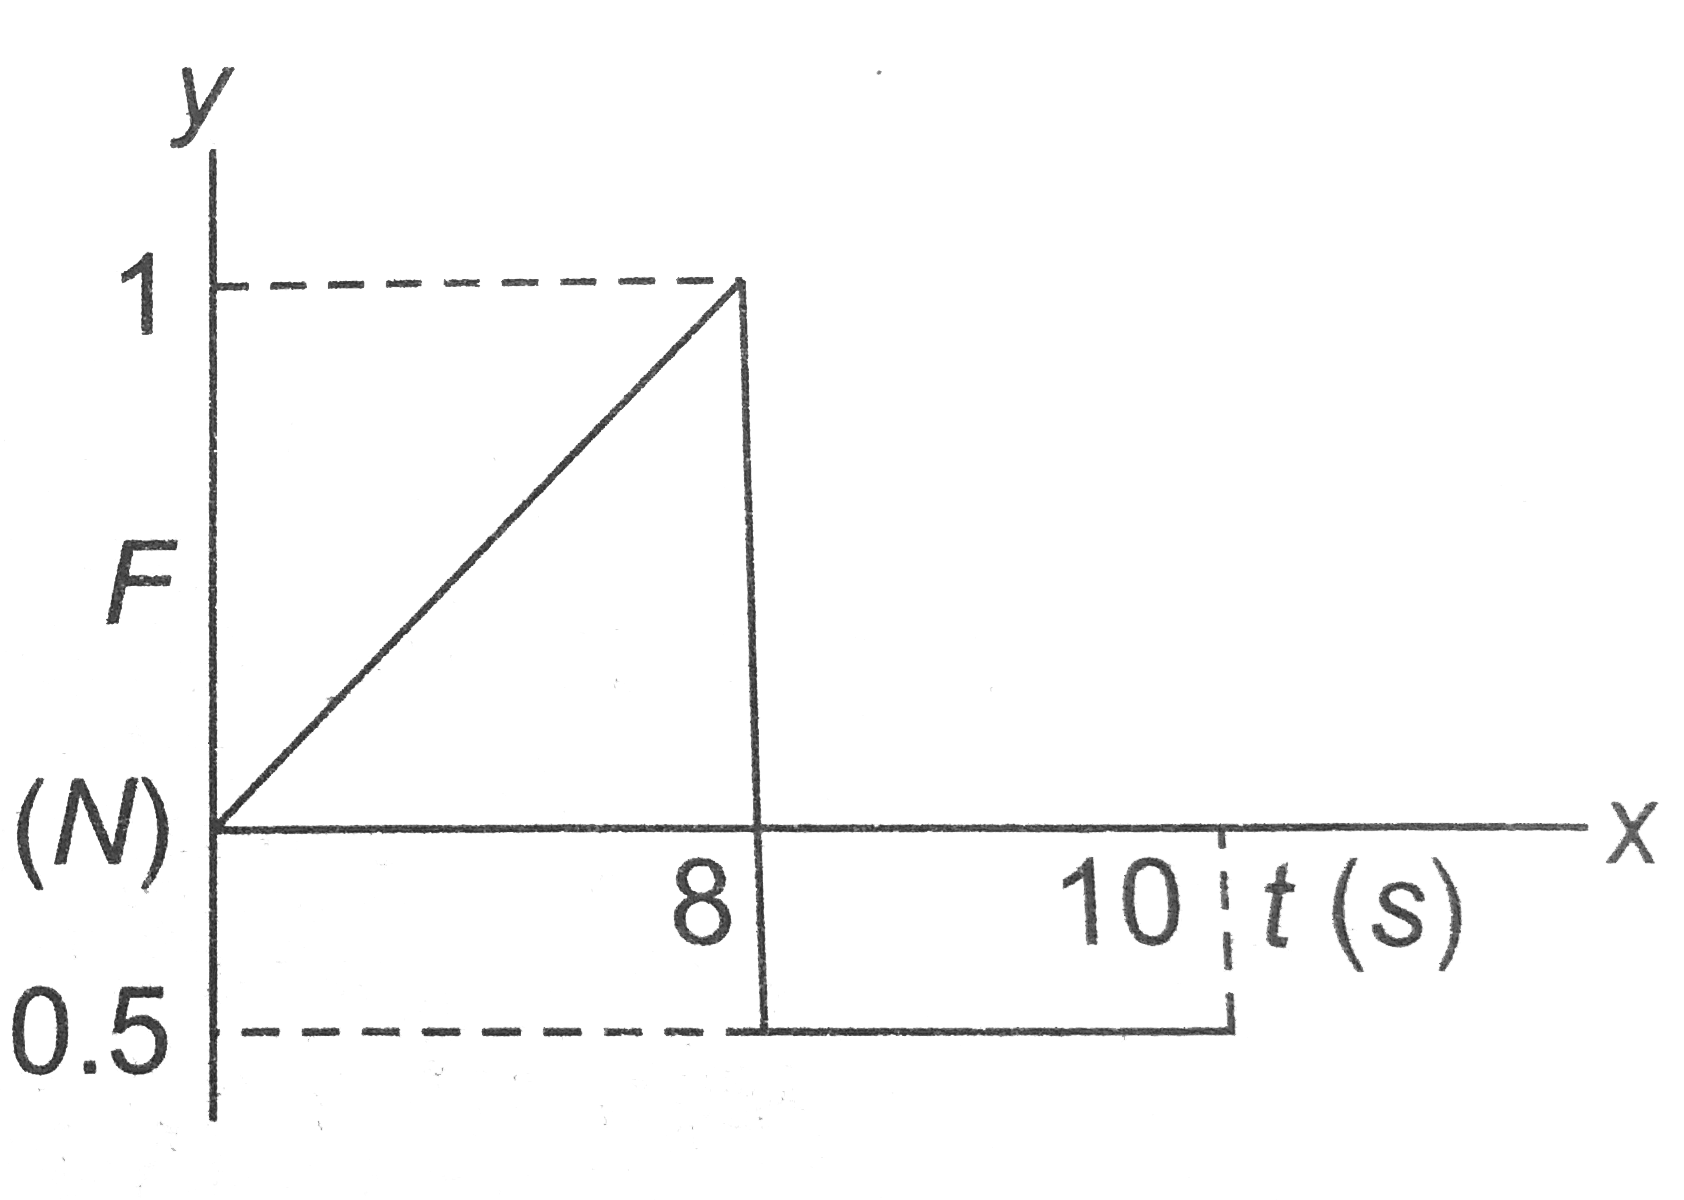 AzeroB4kgm/sC5kgm/sD3kgm/s
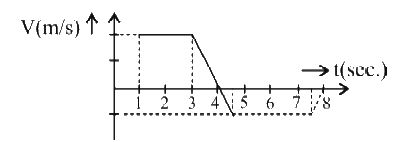
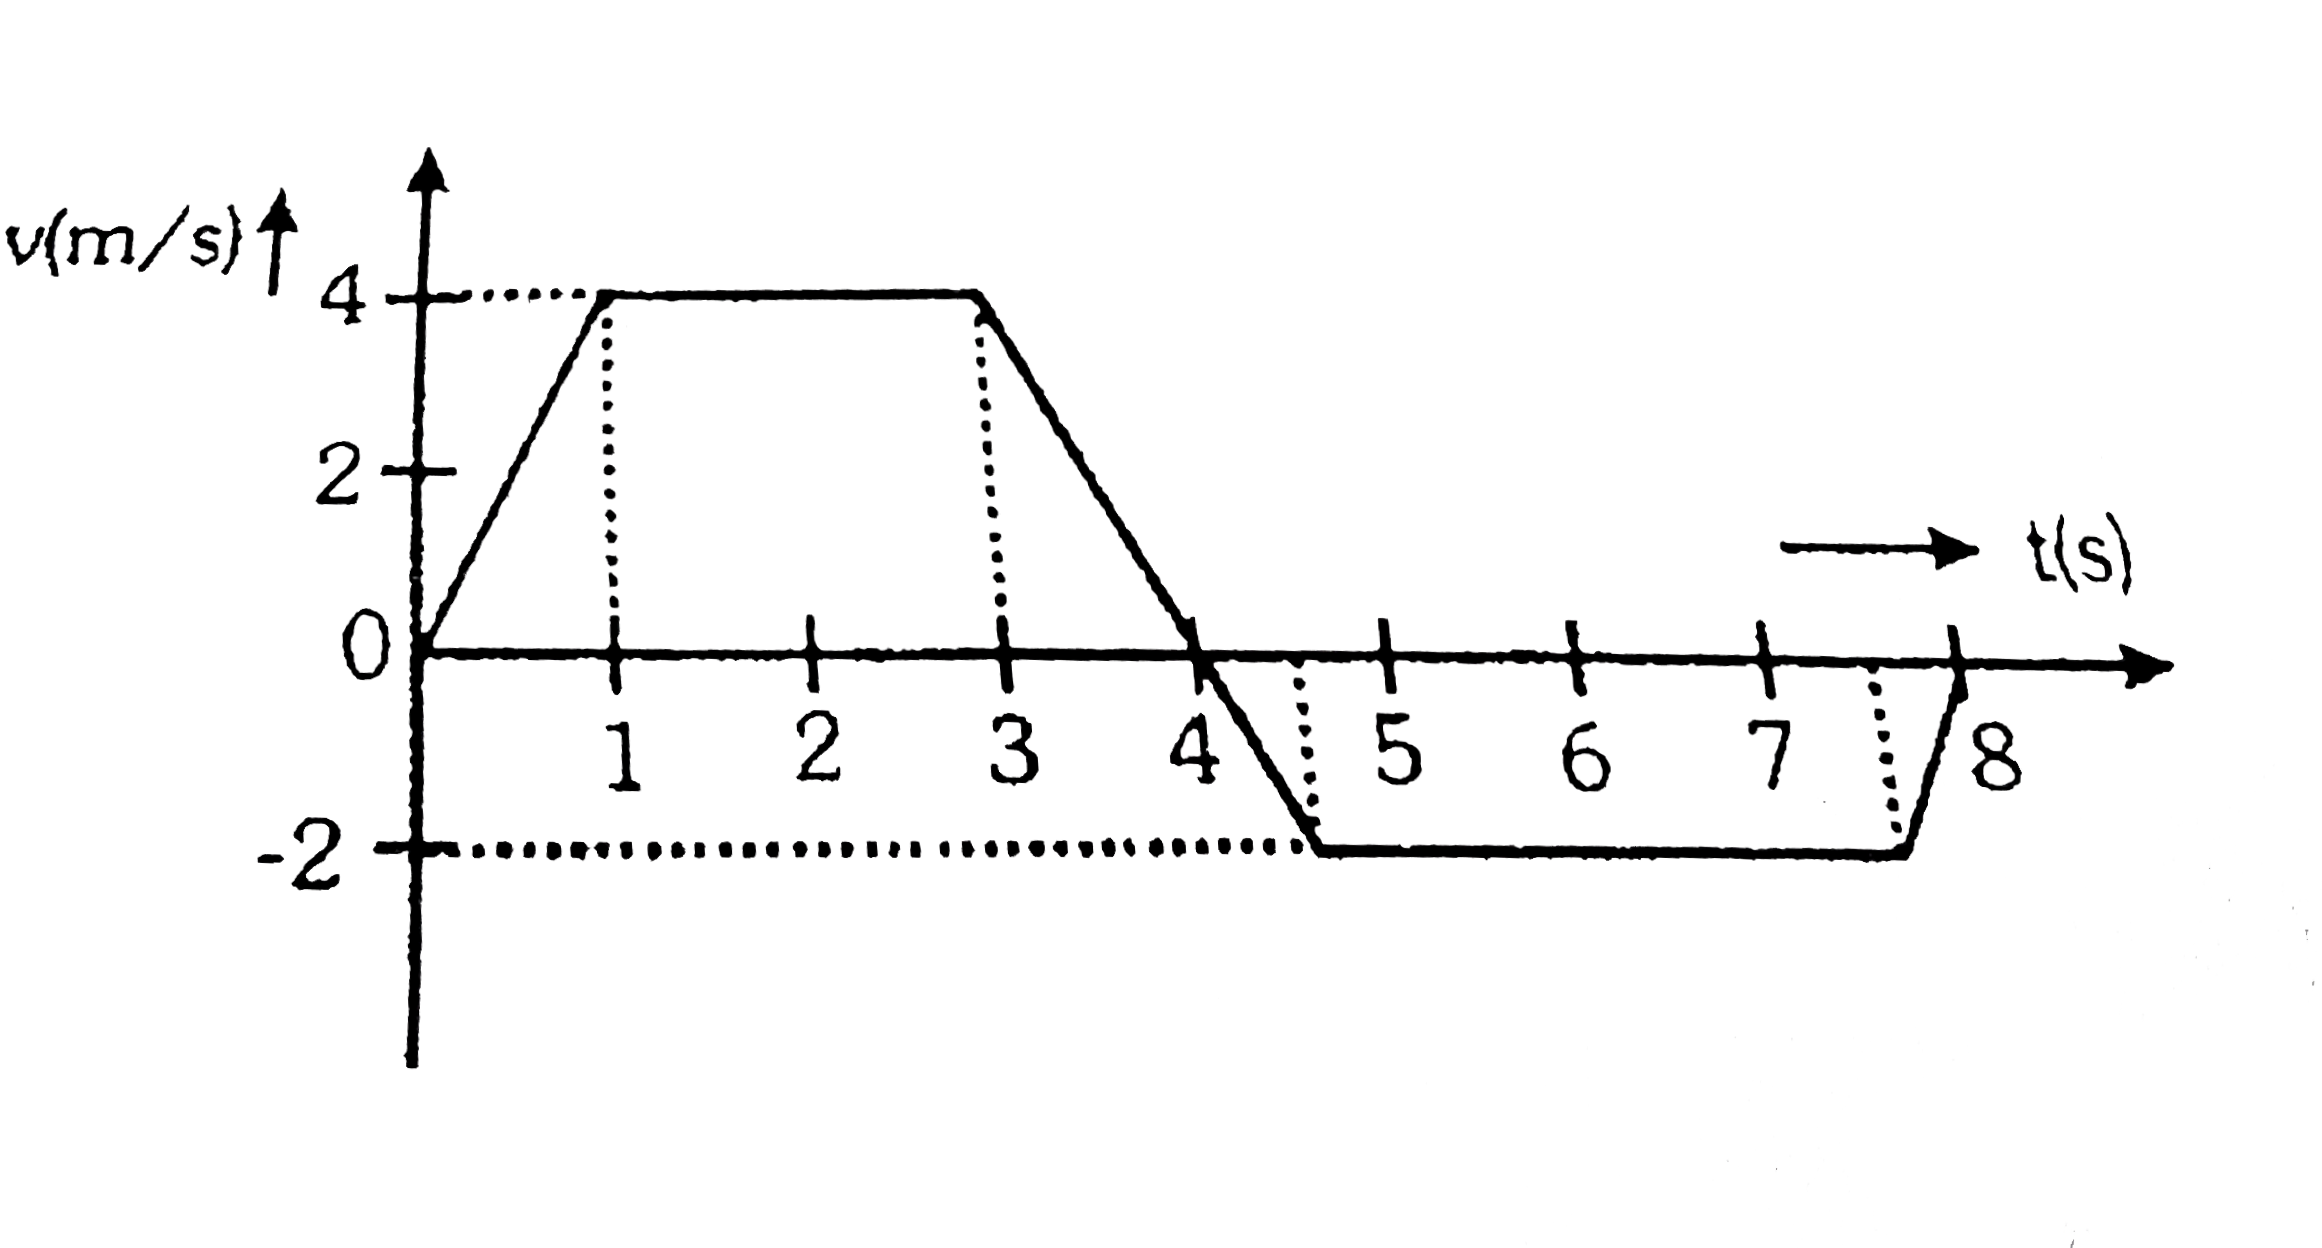
The velocity time graph of a linear motion is shown in the figure. The distance from the starting point after 8 seconds will be
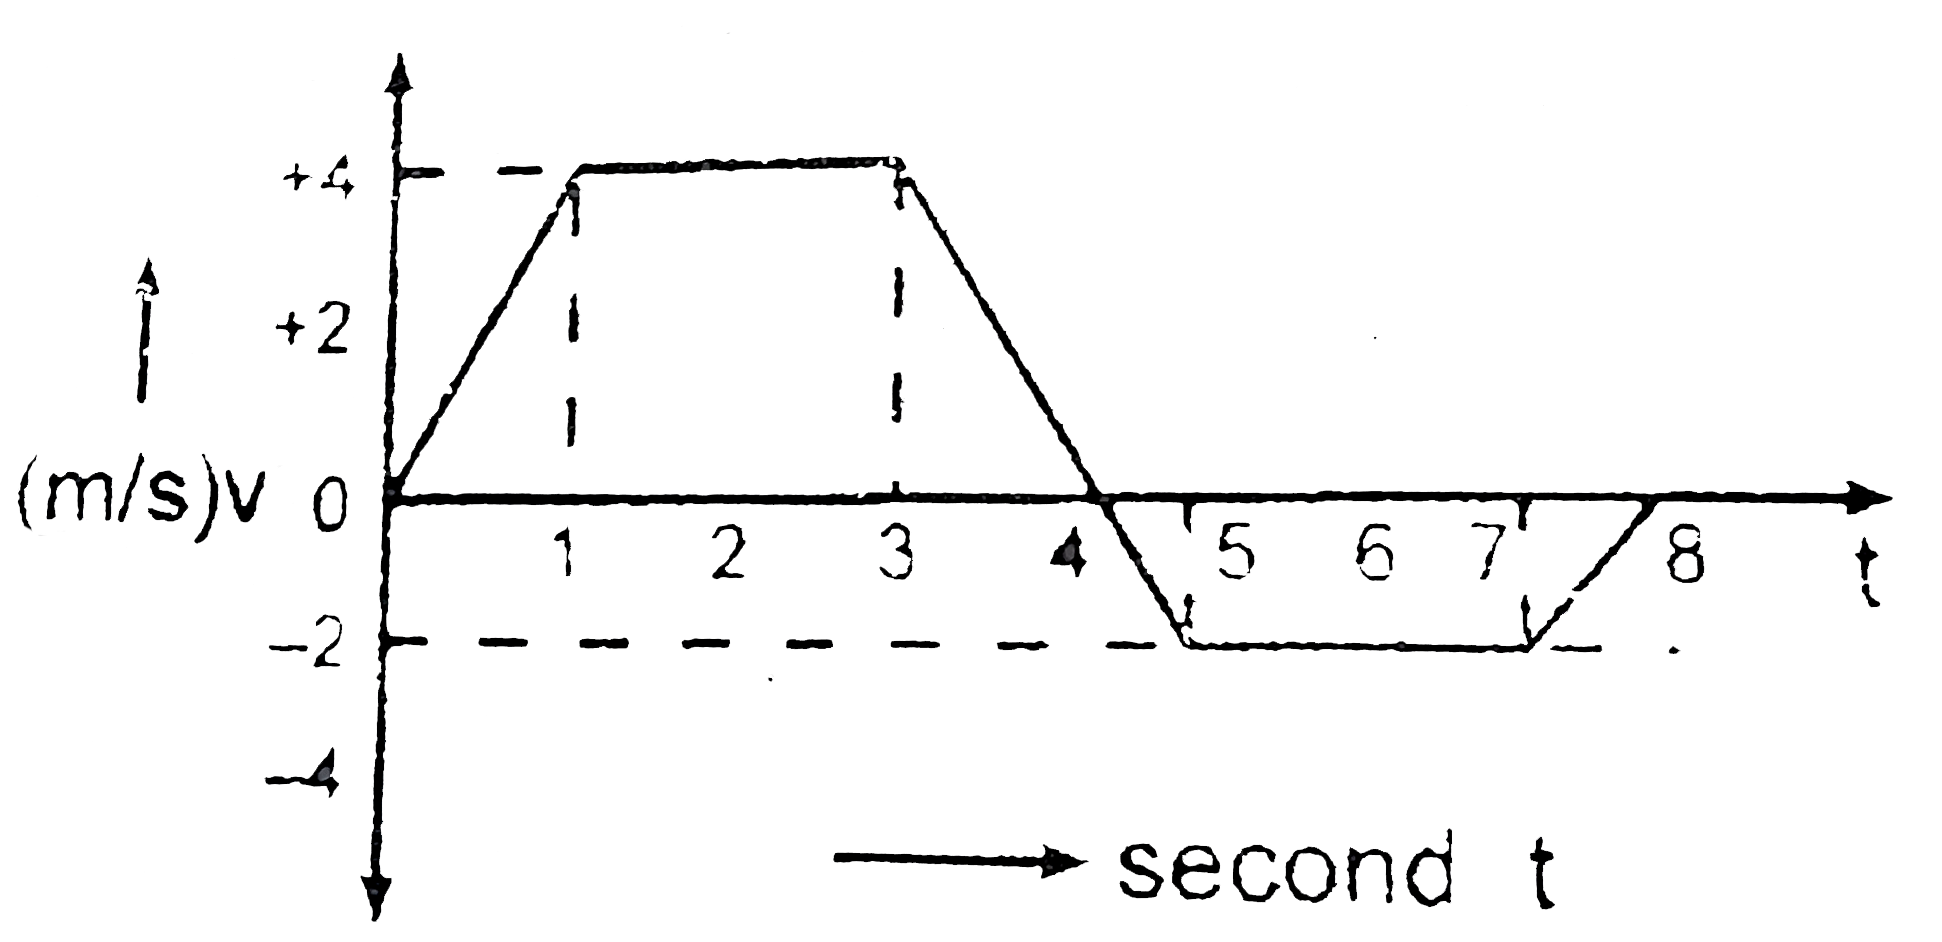 .A18 mB6 mC8 mDnone of these
A force-time graph for the motion of a body is shown in figure. Change in linear momentum between 0 and 8 s is:
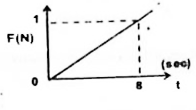
View SolutionA force time graph for the motion of a body is as shown in figure. Change in linear momentum between 0 and 6s is
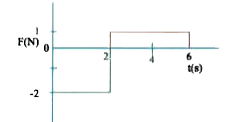
View SolutionThe velocity-time graph of a linear motion os shown figure. The distance from the starting point after 8sec is.
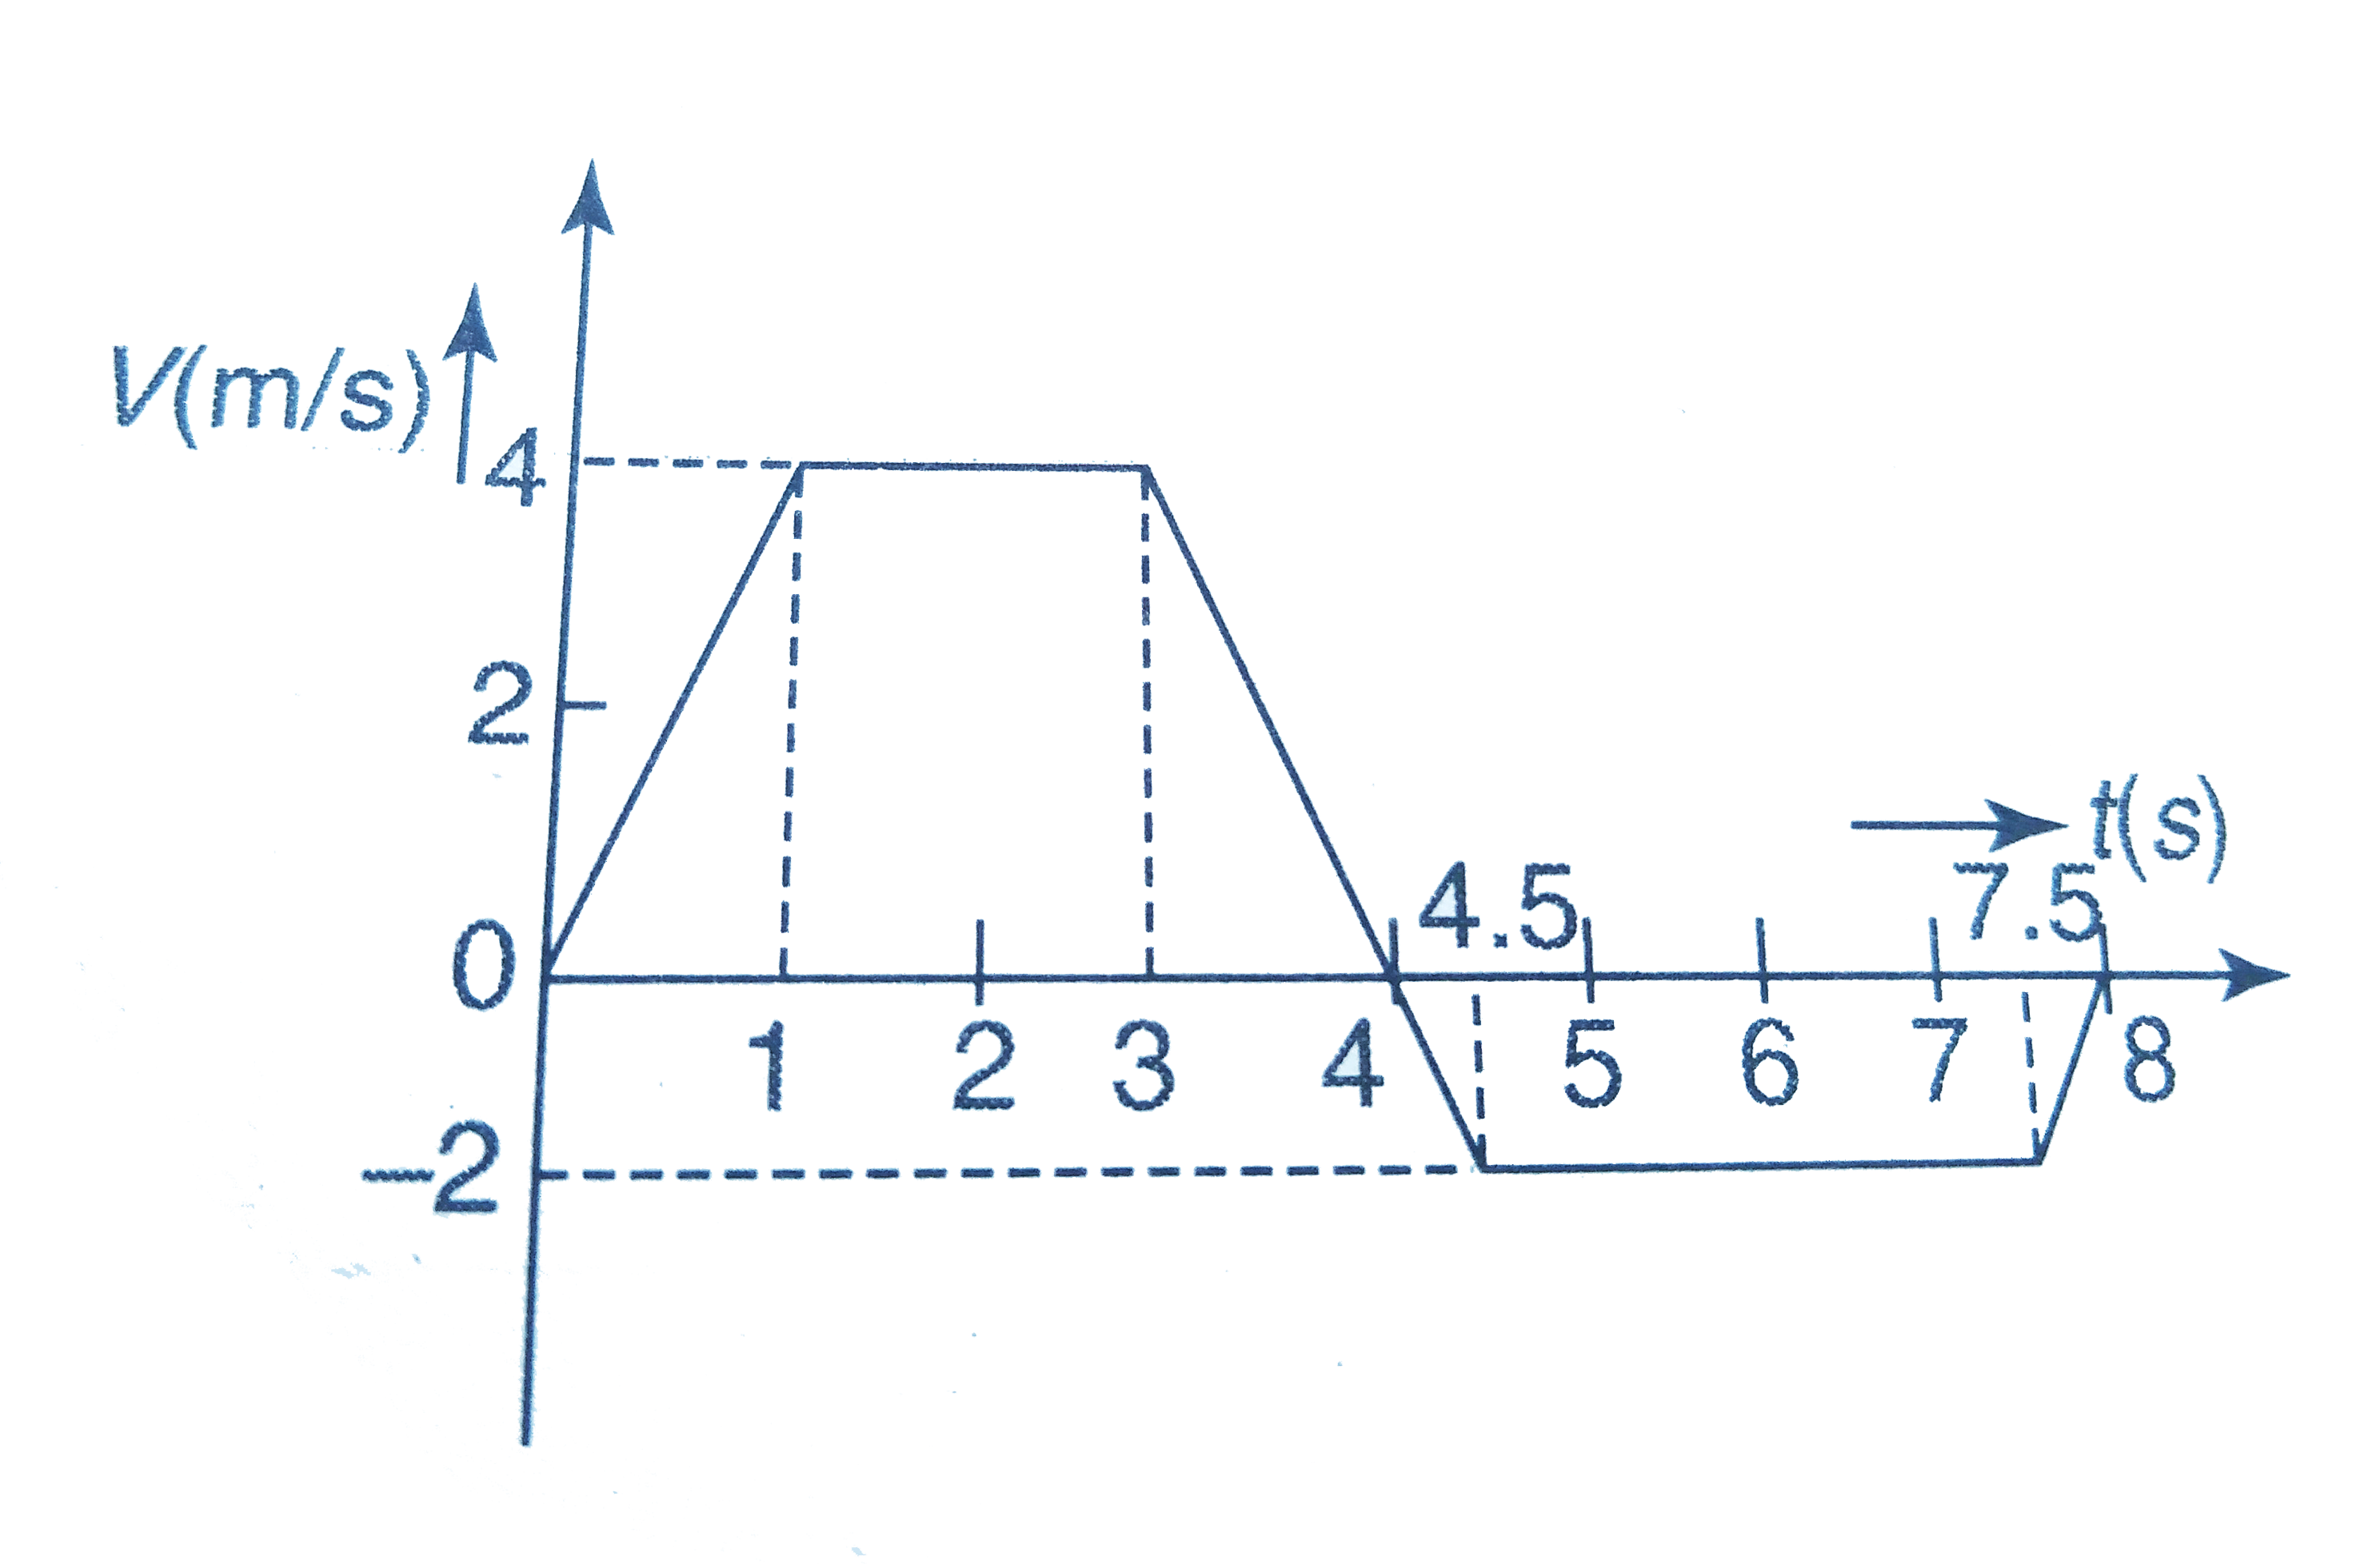
View SolutionThe v-t graph of a linear motion is shown in adjoining figure. The distance from origin after 8 seconds is -
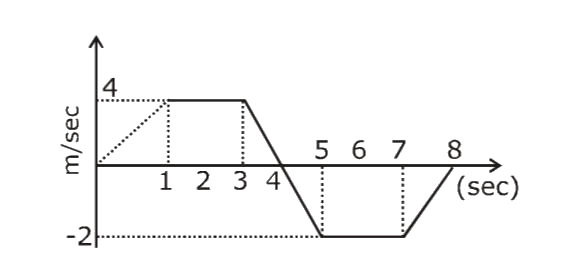
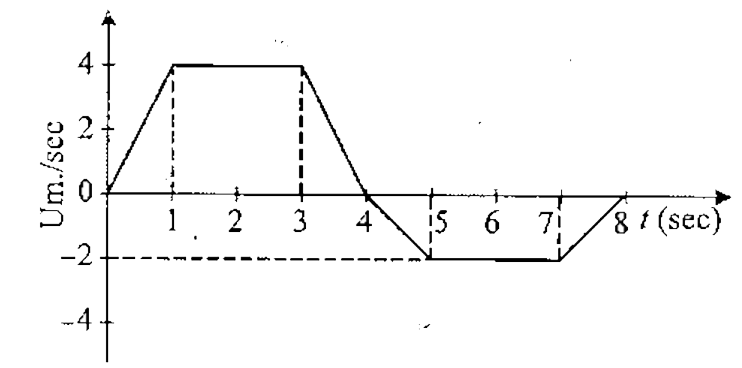
View SolutionThe velocity-time graph of a linear motion is shown below. The distance from the origin after 8 seconds is :
View Solution

