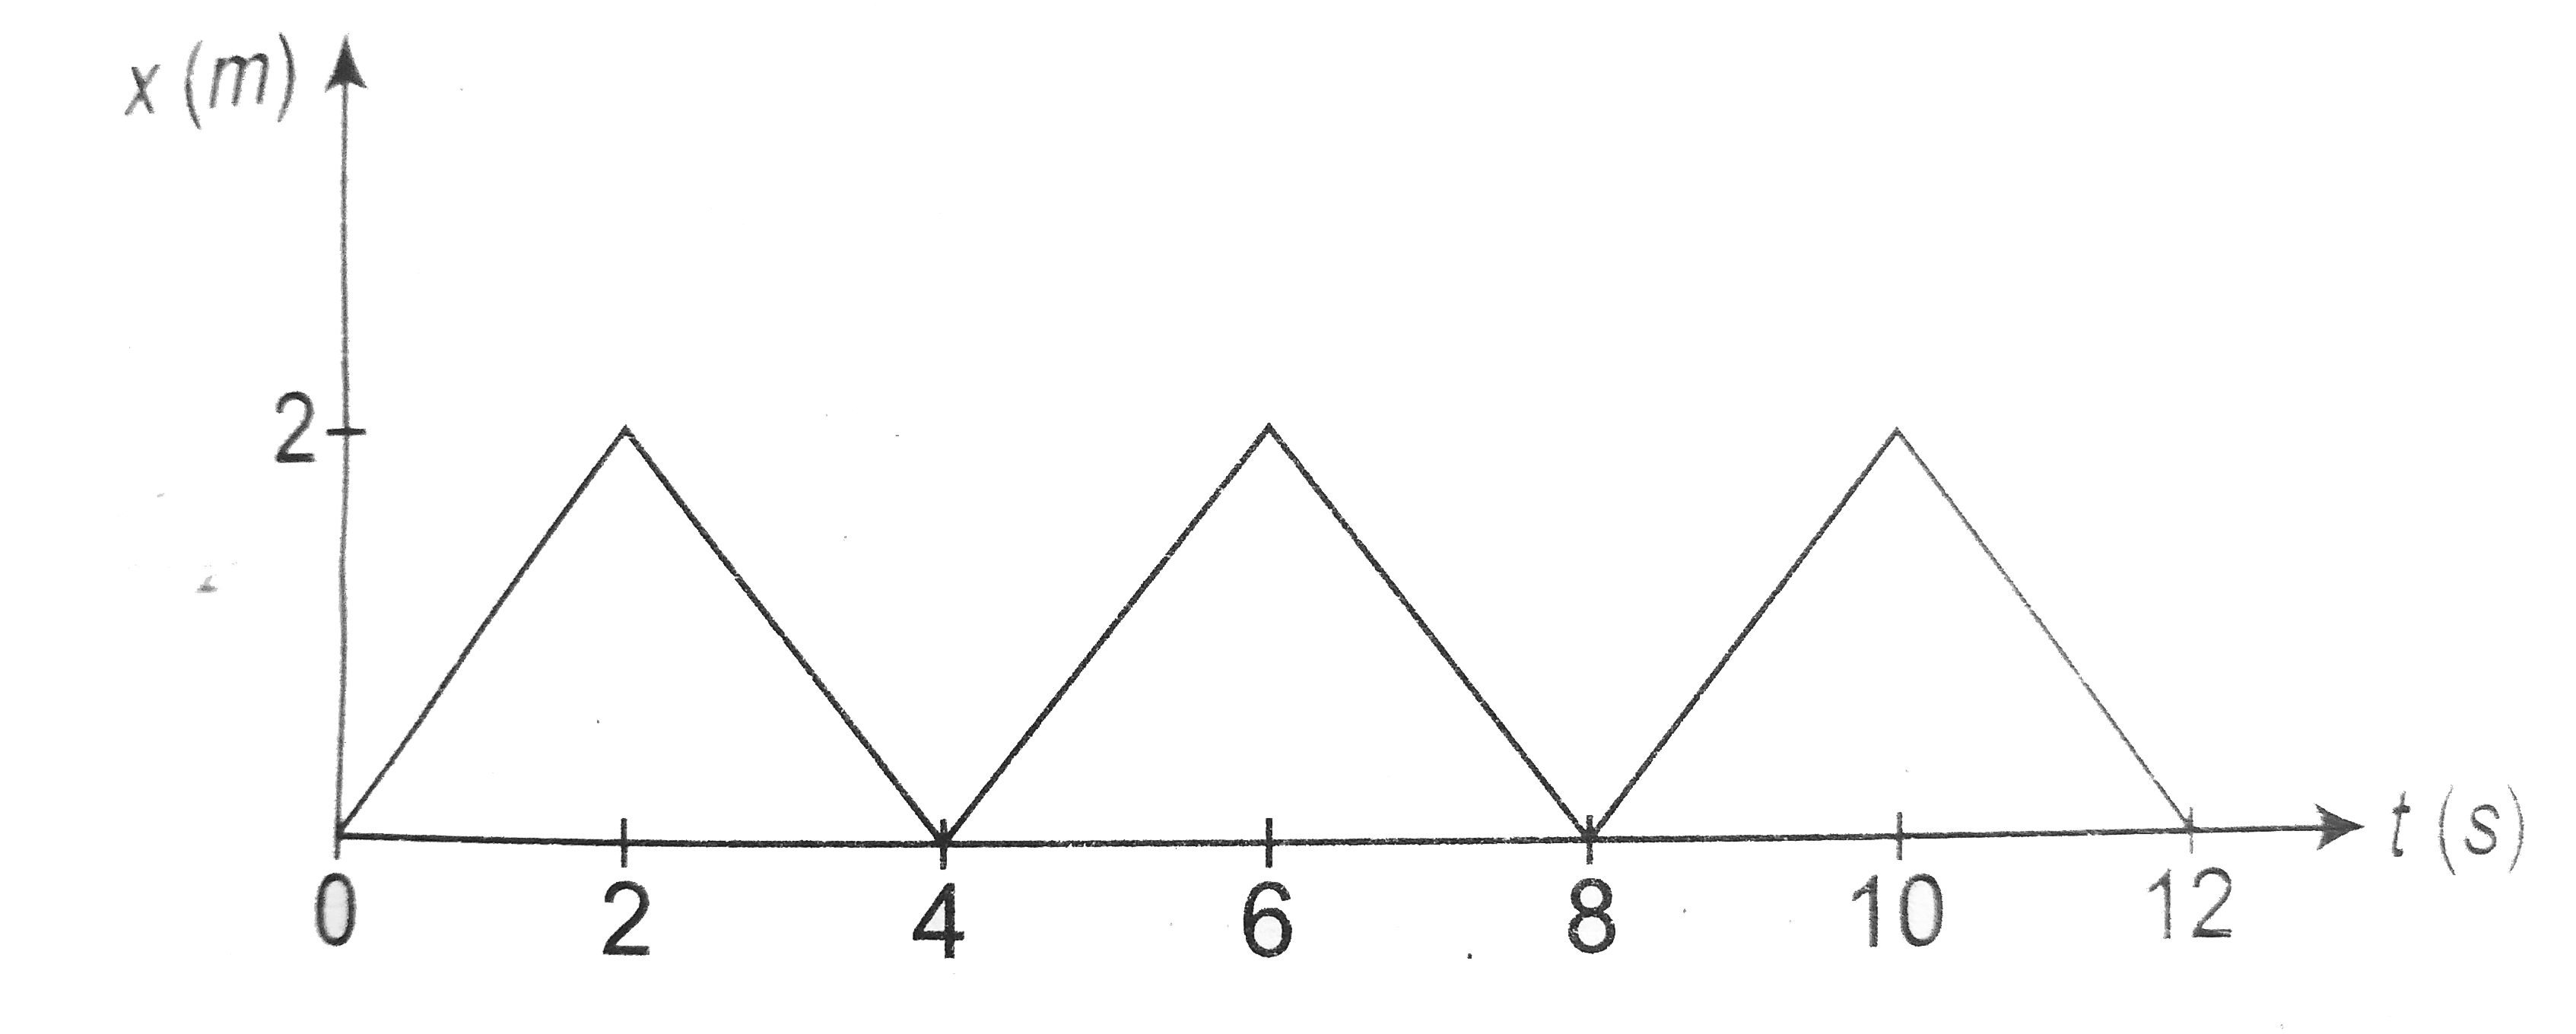
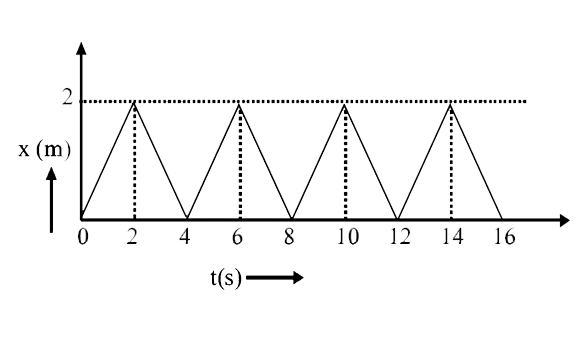
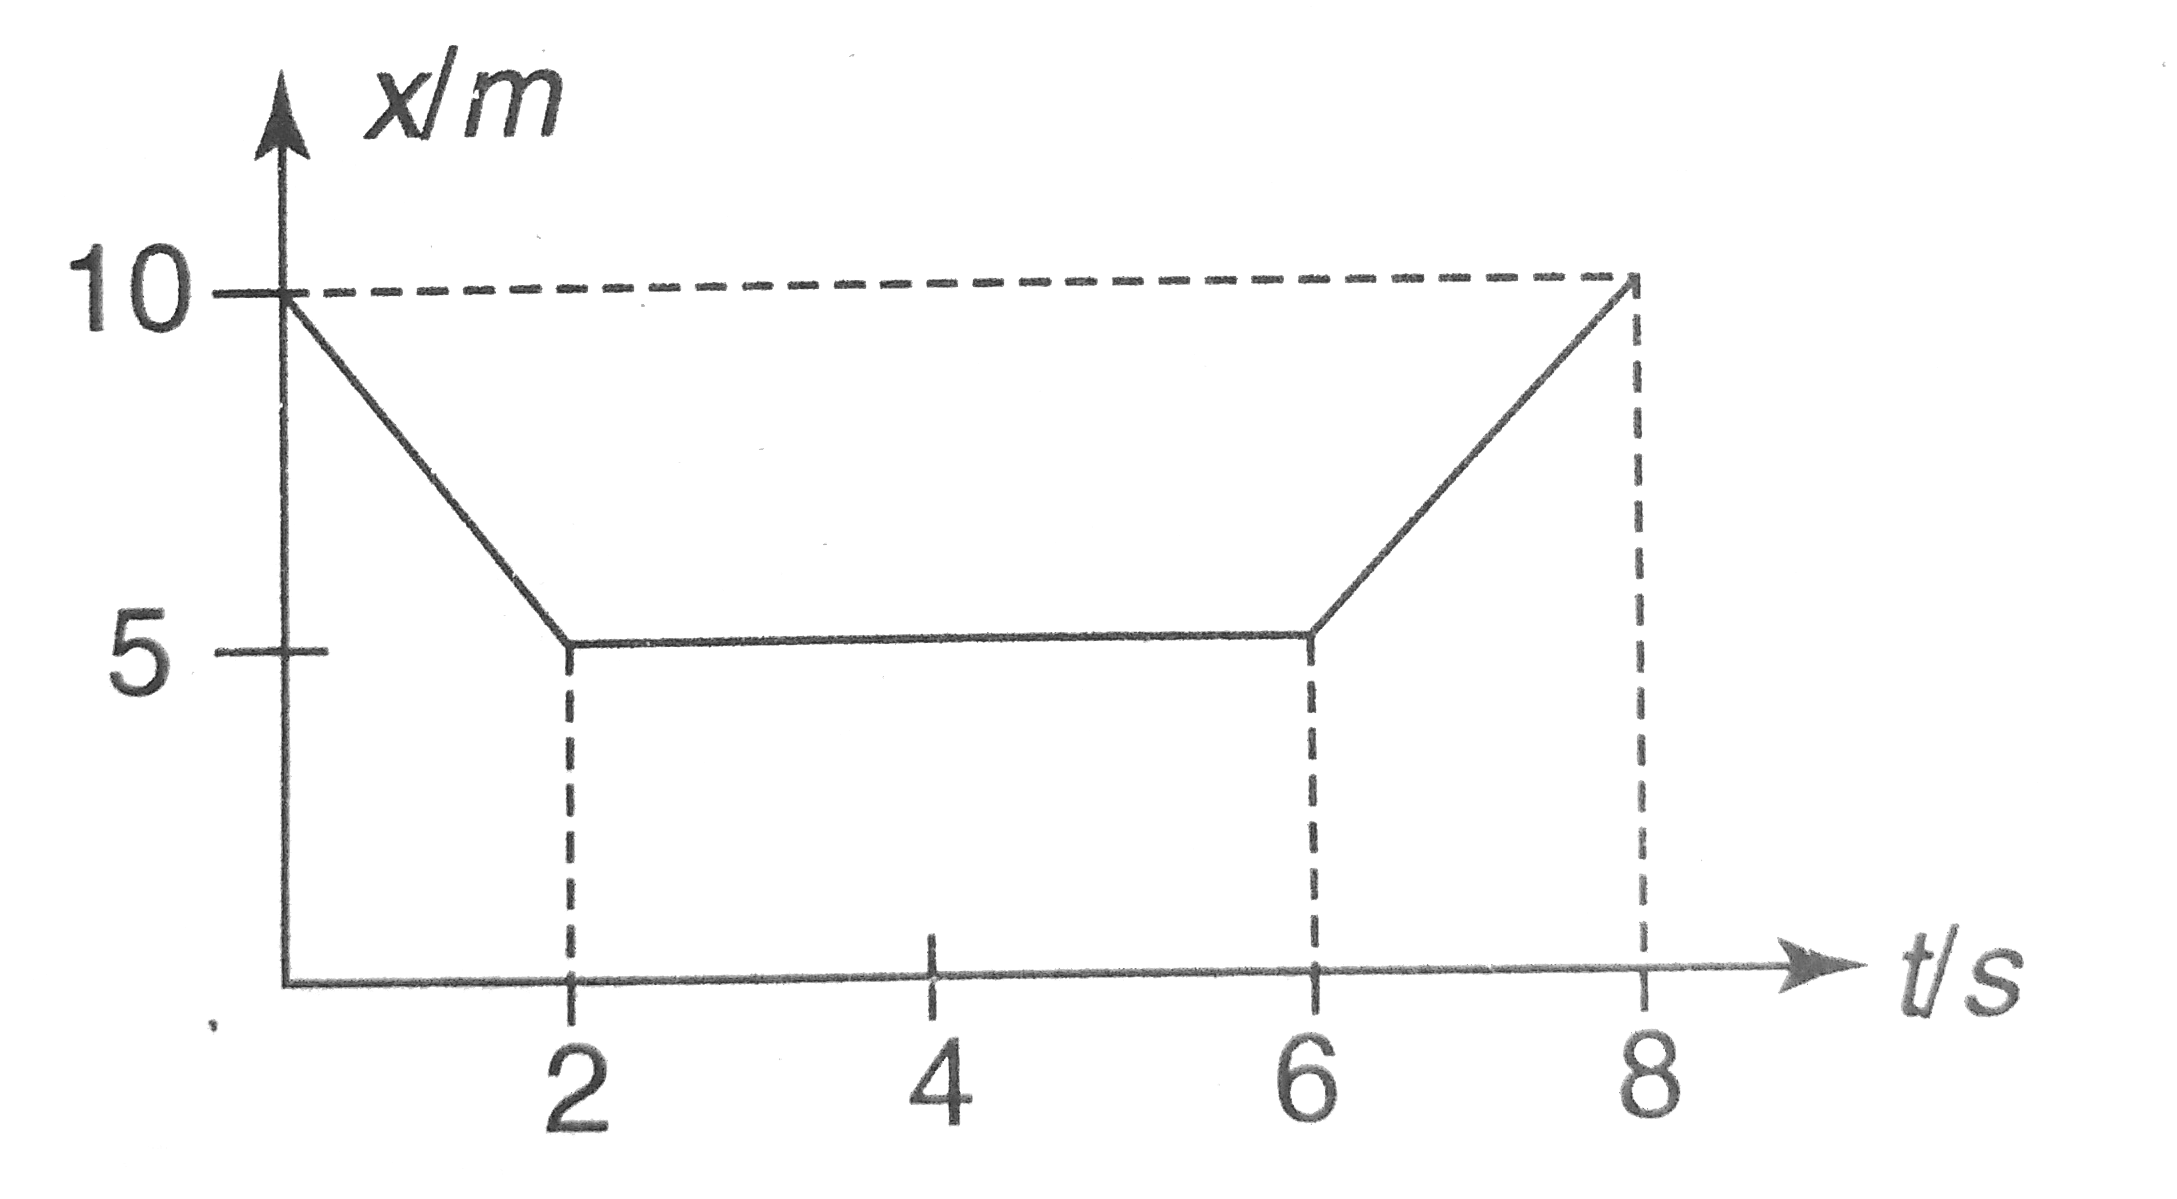
Figure shows the position-time (x-t) graph of one dimensional motion of a mass 500g. What is the time interval between two consecutive impulses received by the body?
2s
4s
6s
8s
The correct Answer is:A
Figure shows that slope of x−t graph change from positive to negative at t=2s , and it changes from negative to positive at t=4s and so on. Thus direction of velocity is reversed after every two seconds. Hence, the body must be receiving conseccutive impulses after every two second.
Topper's Solved these Questions
- NEWTONS LAWS OF MOTIONBook:A2ZChapter:NEWTONS LAWS OF MOTIONExercise:Equilibrium Of A Particle
Explore 19 Videos
- NEWTONS LAWS OF MOTIONBook:A2ZChapter:NEWTONS LAWS OF MOTIONExercise:Applications Of Newton'S Laws Of Motion
Explore 33 Videos
- NEWTONS LAWS OF MOTIONBook:A2ZChapter:NEWTONS LAWS OF MOTIONExercise:Chapter Test
Explore 30 Videos
- MOTION IN TWO DIMENSIONBook:A2ZChapter:MOTION IN TWO DIMENSIONExercise:Chapter Test
Explore 29 Videos
- OSCILLATION AND SIMPLE HARMONIC MOTIONBook:A2ZChapter:OSCILLATION AND SIMPLE HARMONIC MOTIONExercise:Chapter Test
Explore 29 Videos
Similar Questions
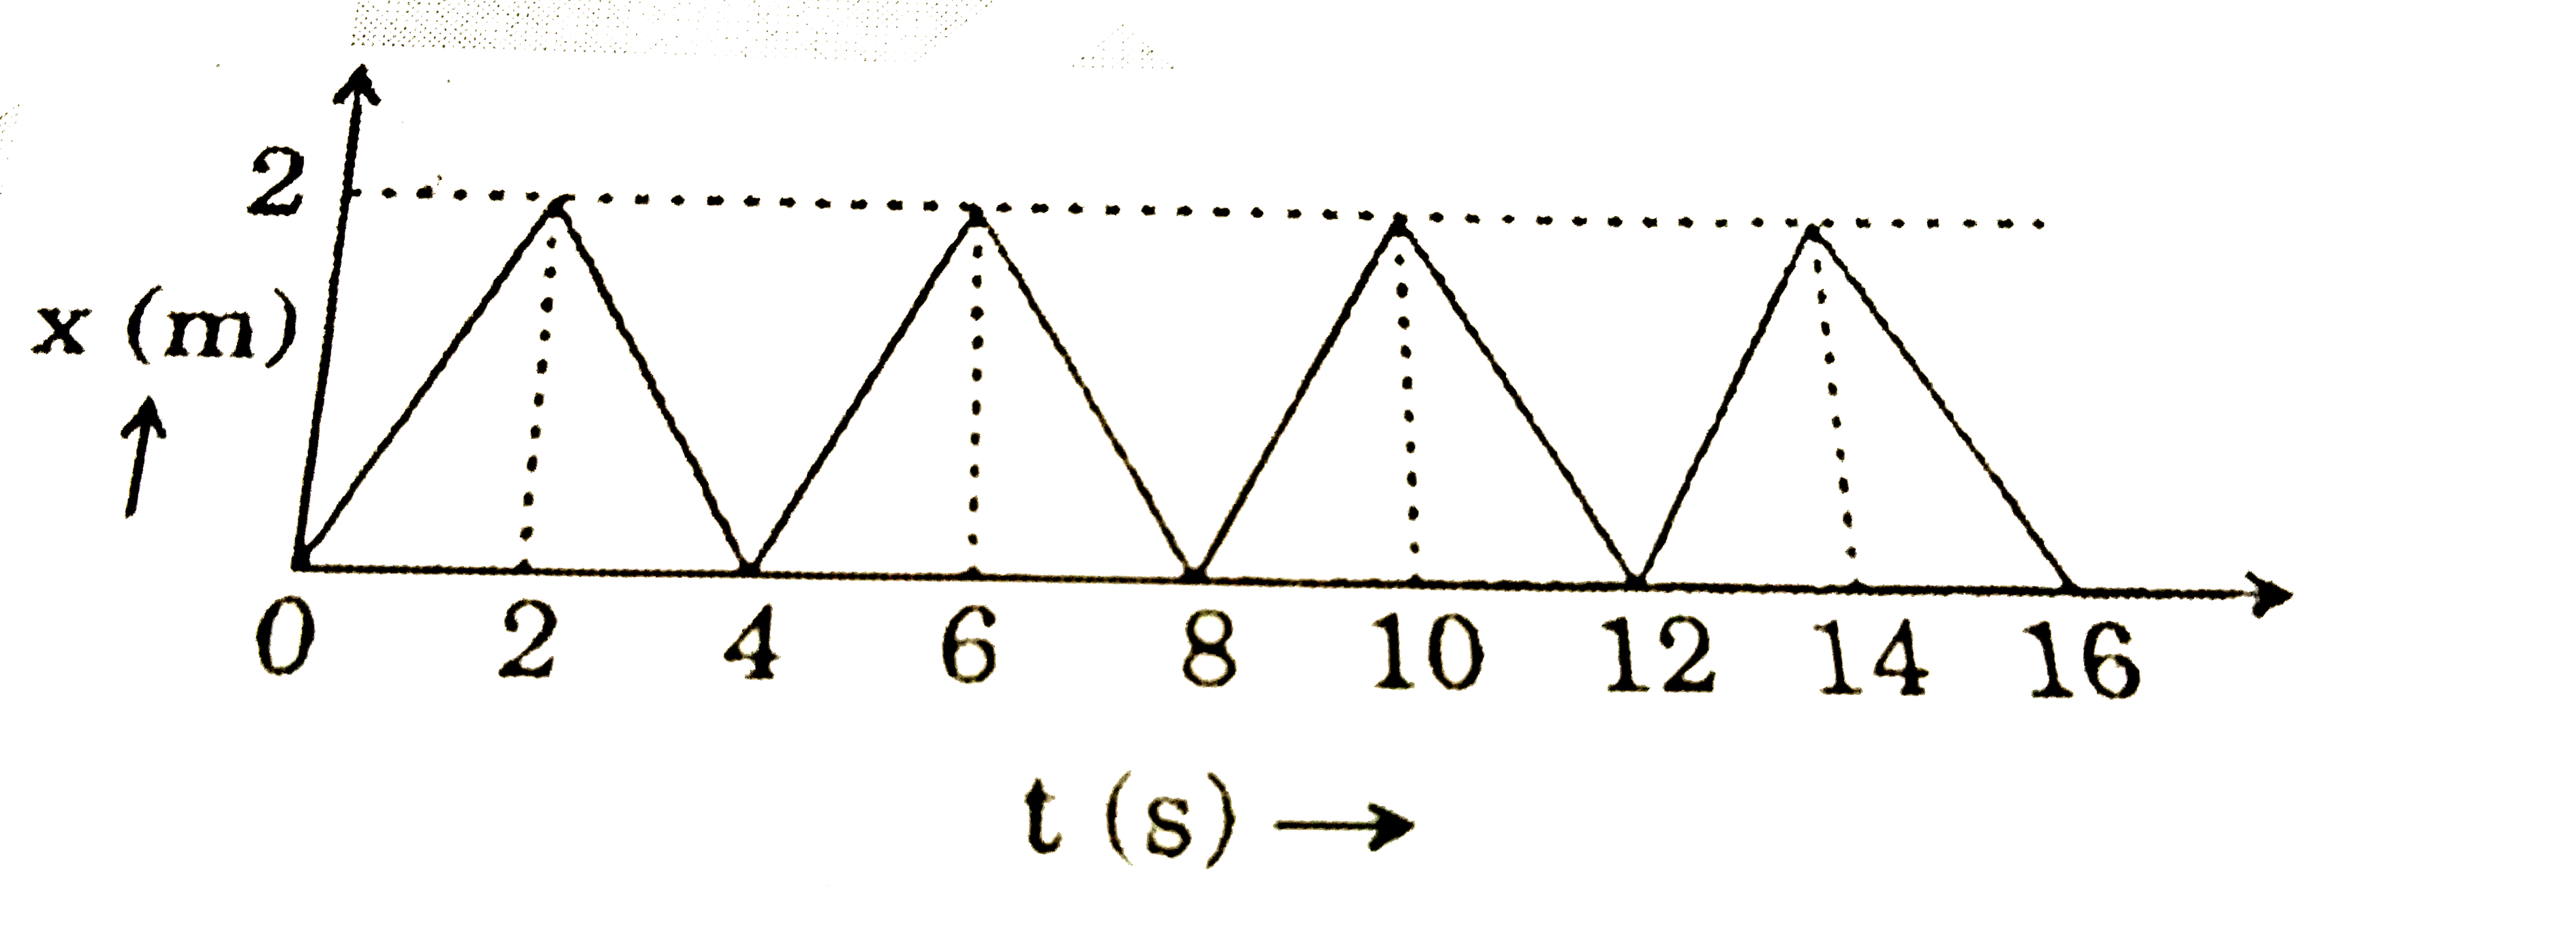
The figure shows the position - time (x - t) graph of one-dimensional motion of a body of mass 0.4 kg. The magnetic of each impulse is
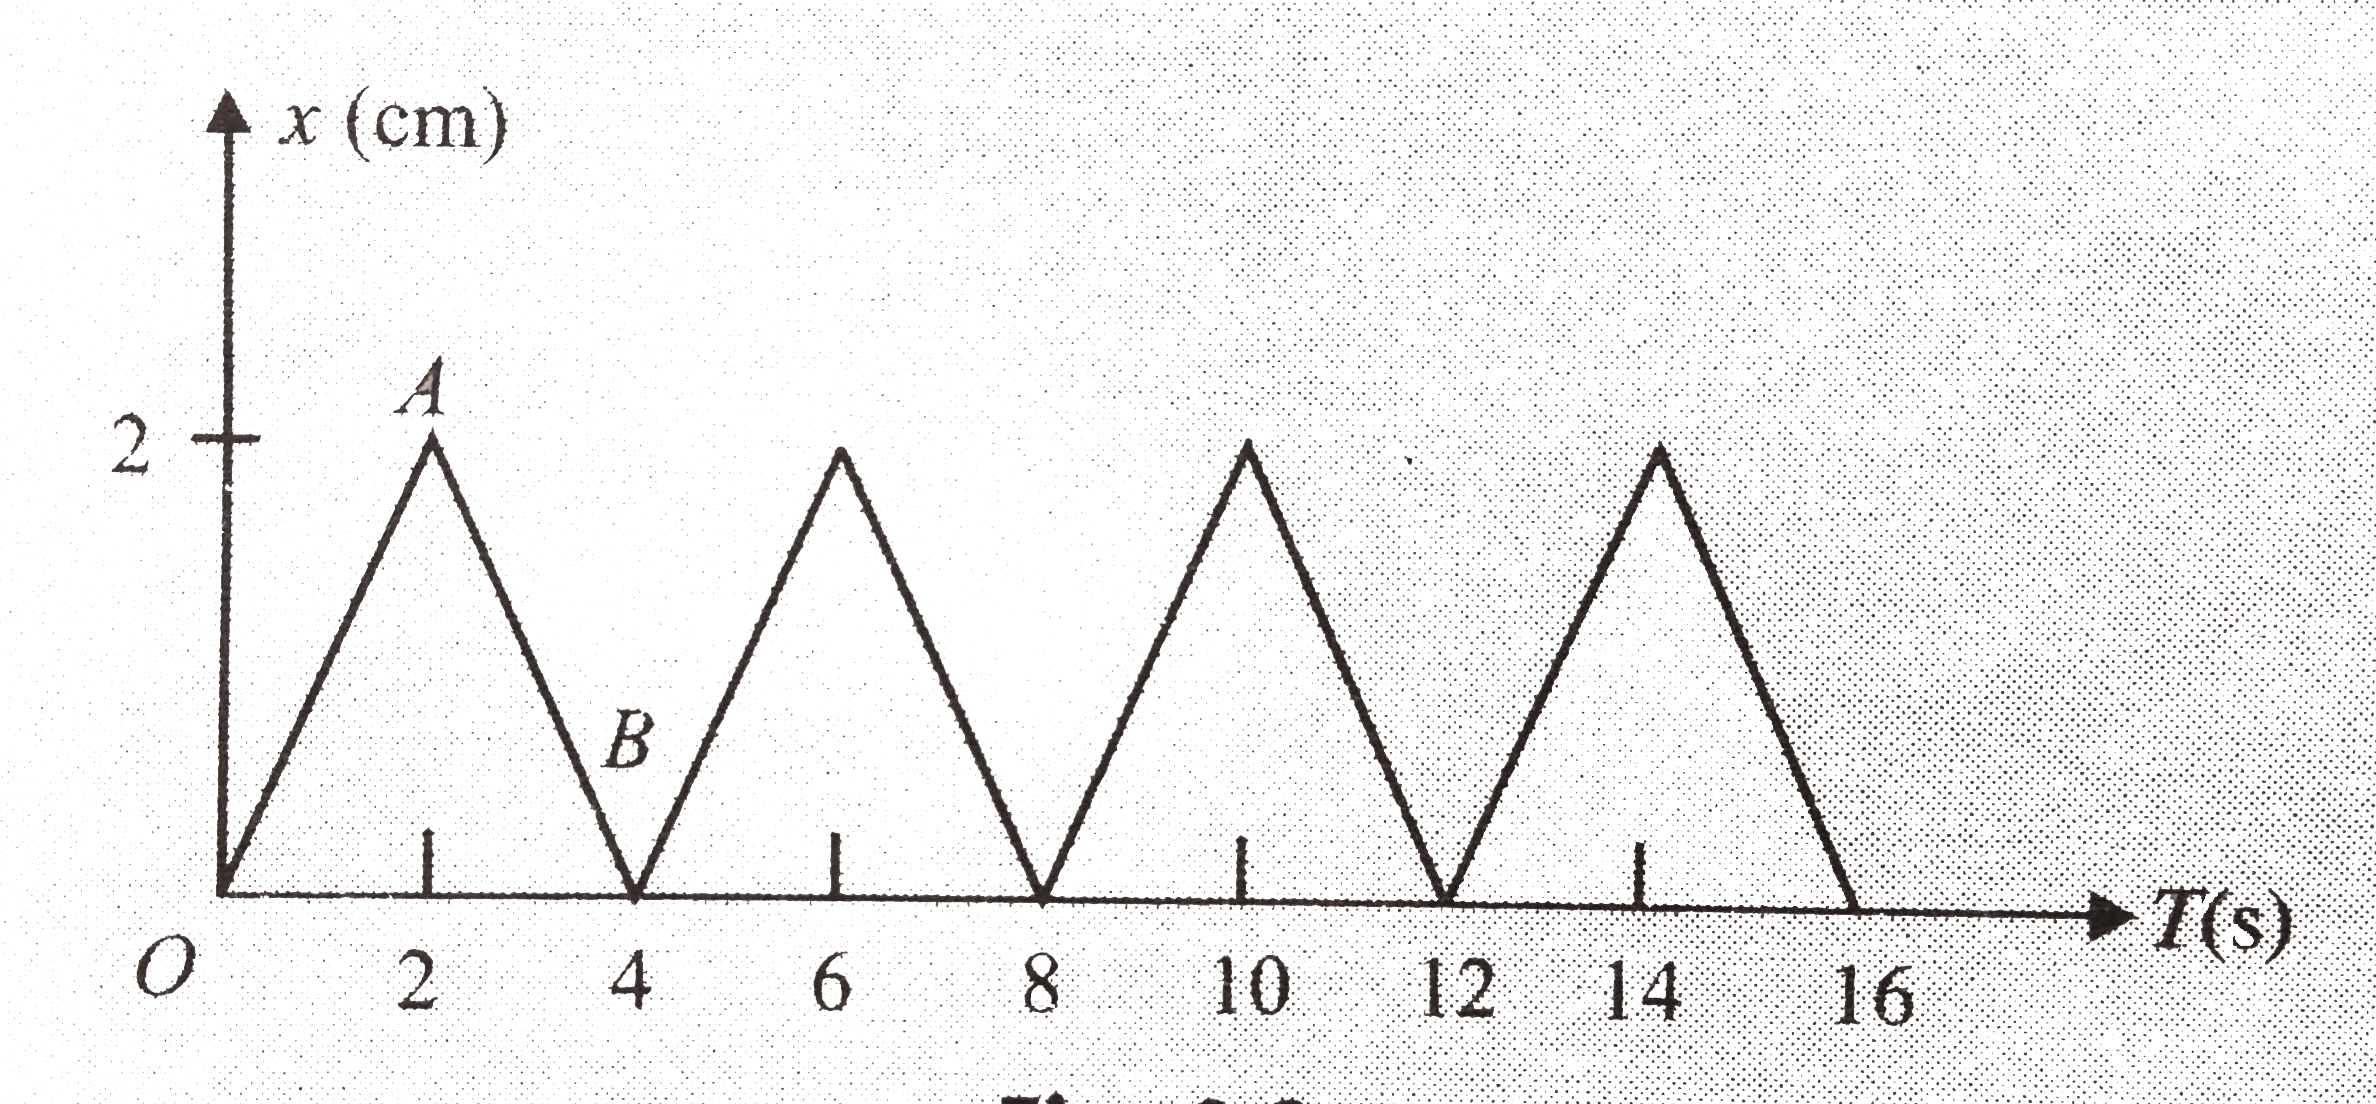
View SolutionFigure shows the position-time graph of a particle of mass 0.04kg. Suggest a suitable physical context for this motion. What is the time between two consecutive impulses received by the particle? What is the magnitude of each impluse?
View Solution
Knowledge Check
Figure shows position-time graph of two cars A and B.
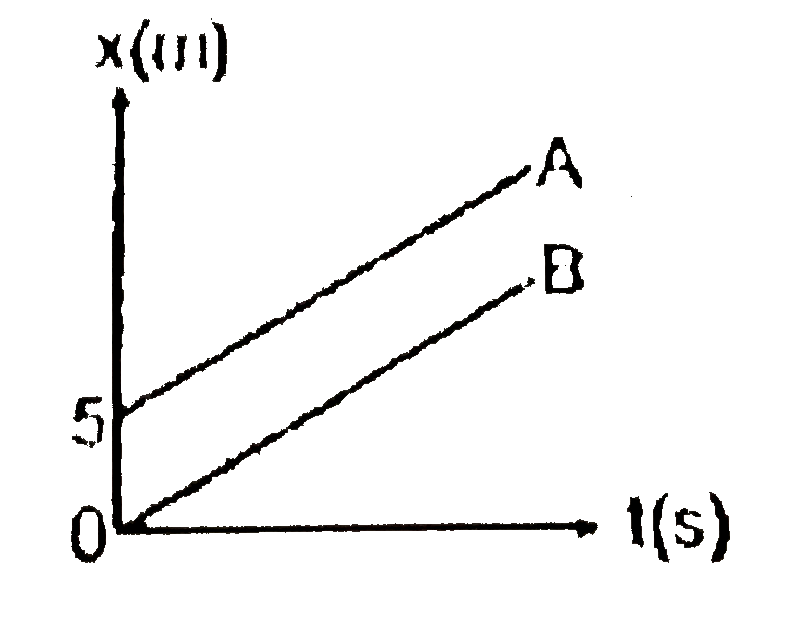 ACar A is faster than car B.BCar B is faster than car A.CBoth cars are moving with same velocity.DBoth cars have positive acceleration.
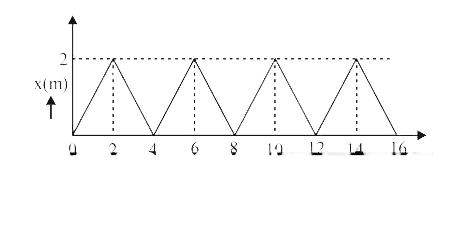
The figure shows the position-time (x-t) graph of one-dimensional motion of a body of mass 0.4kg. The magnitude of each impulse is
 A0.4NsB0.8NsC1.6NsD0.2Ns
The figure shows the position – time (x – t) graph of one – dimensional motion of a body of mass 0.4 kg. The magnitude of each impulse is:
 A0.4 NsB0.8 NsC1.6 NsD0.2 Ns
Shows the position time graph of a particle of mass 0.04 kg Suggest a suitable physical context for this motion What is the time between two conscutive impulse recevived by the particle ? What is the magnitude of each impulse ?
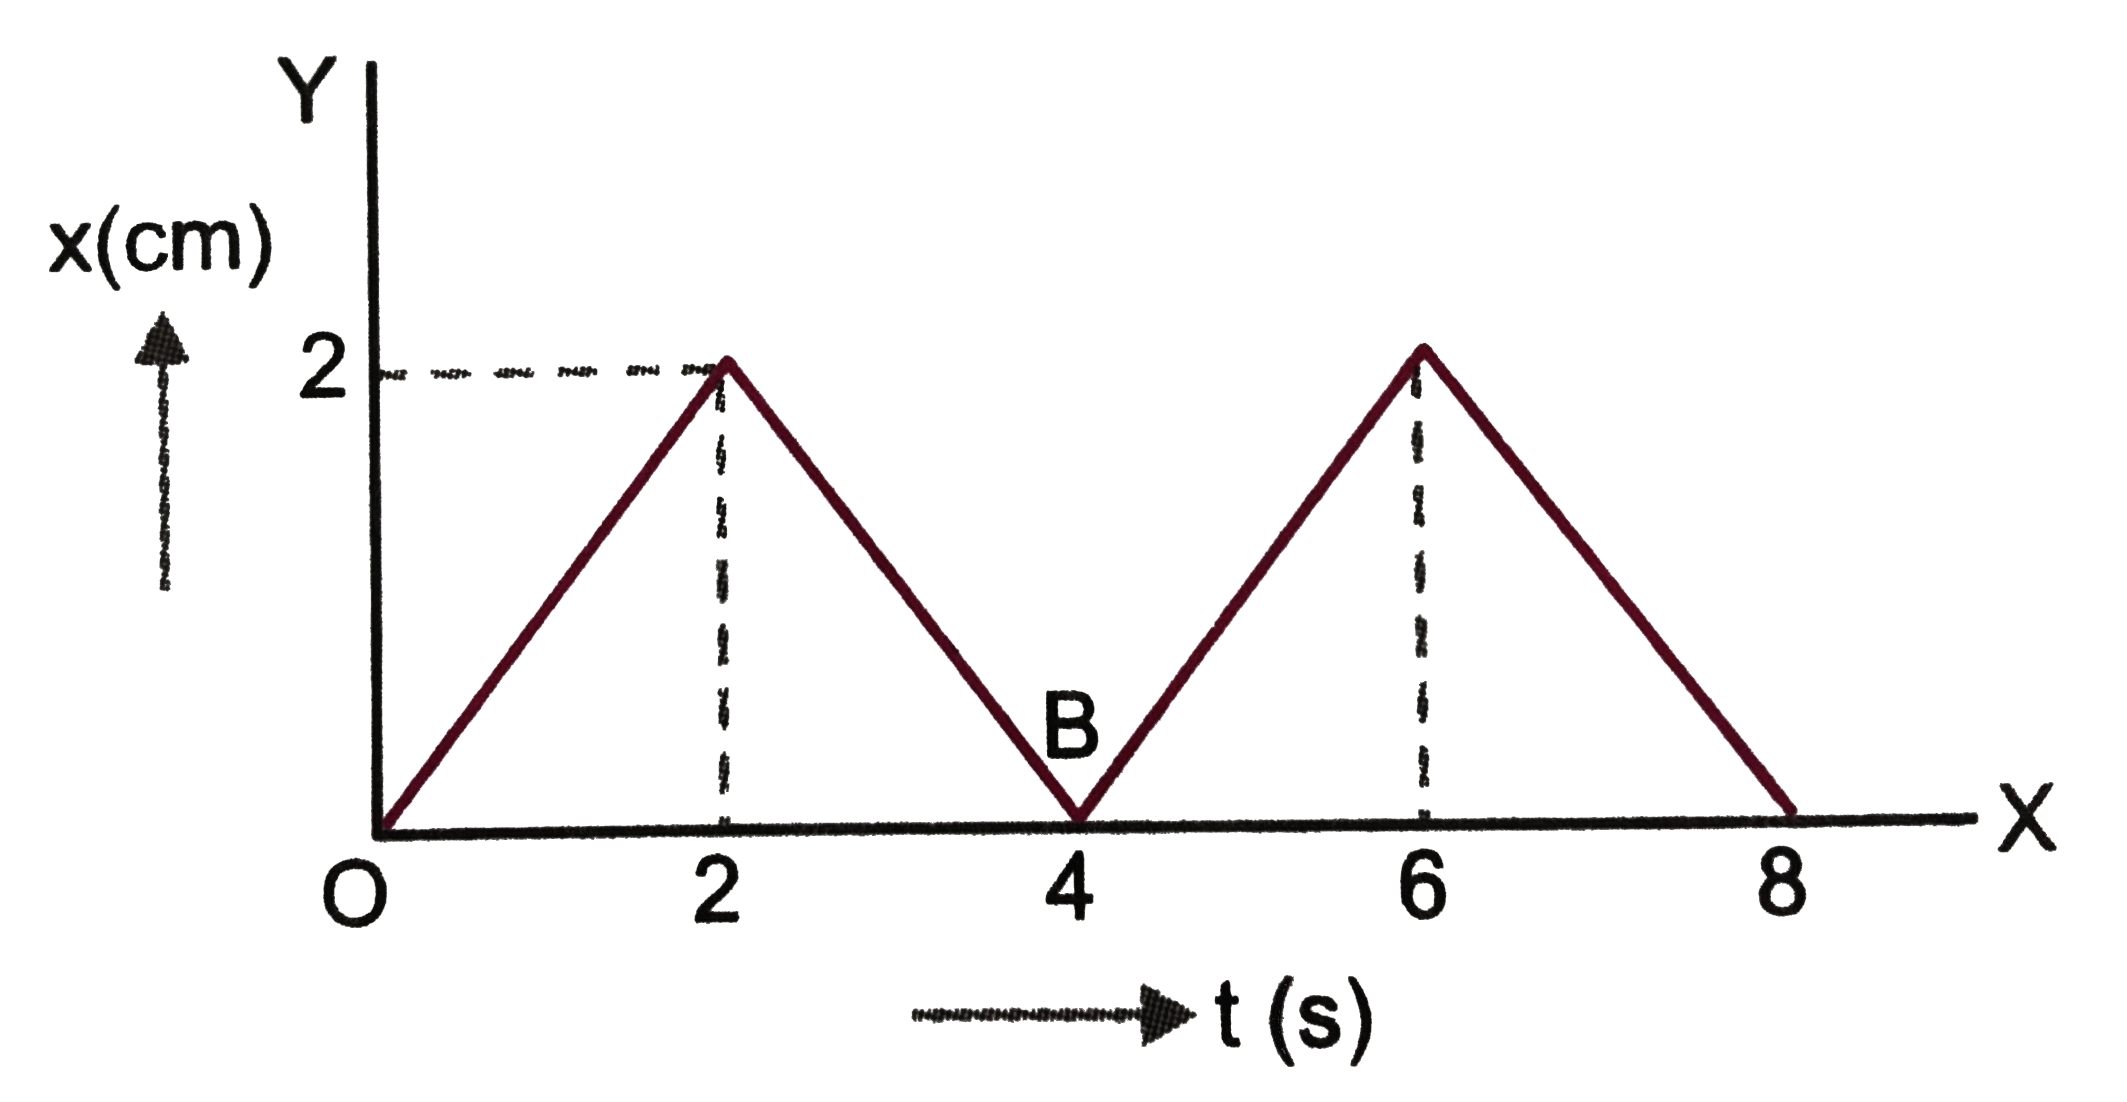
View SolutionThe position-time graph of a body of mass 0.04kg is shown in the figure. The time between two consecutive impulses received by the body and the magnitude of each impulse is
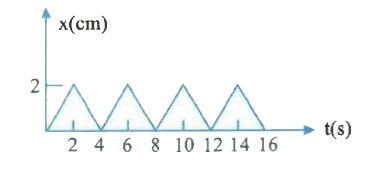
View SolutionFigure shows the position time graph for a particle in one dimensional motion. What is the displacement of the particle in first 4 seconds ?
View Solution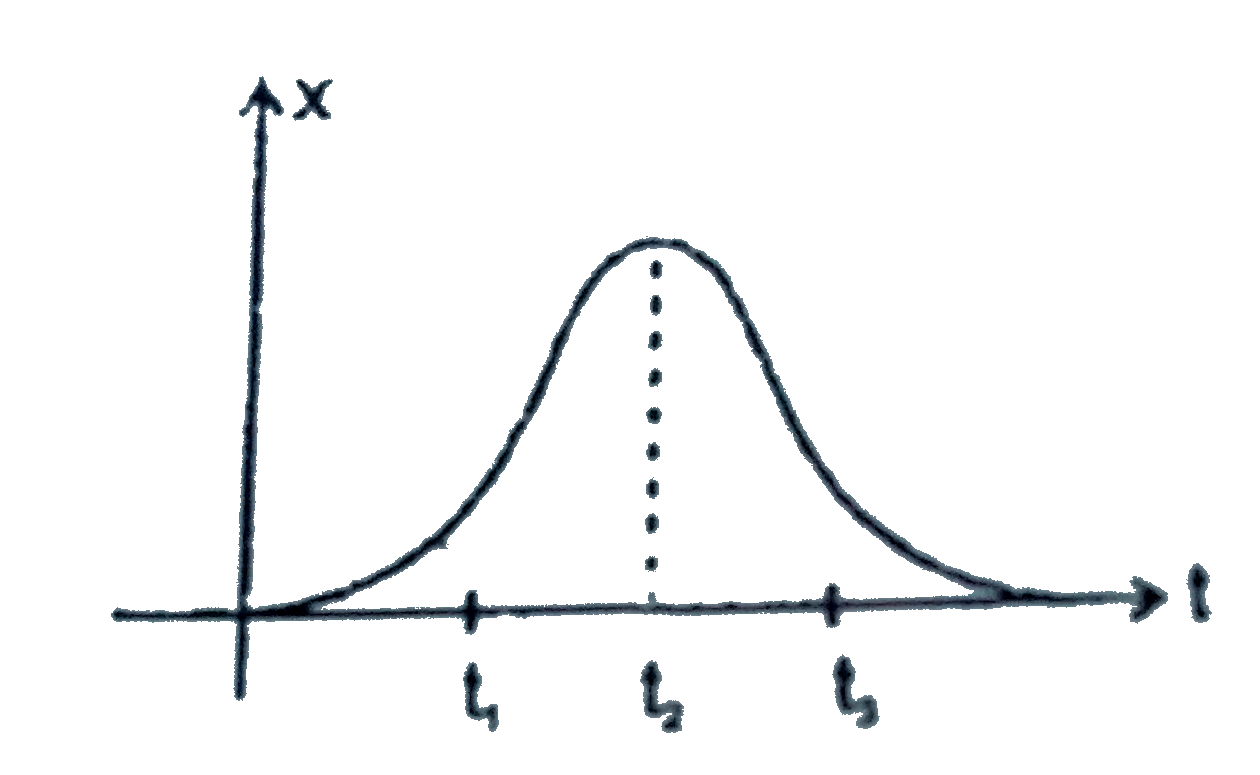
Given figure shows position-time curve during one dimentional motion of body. Select correct statements.
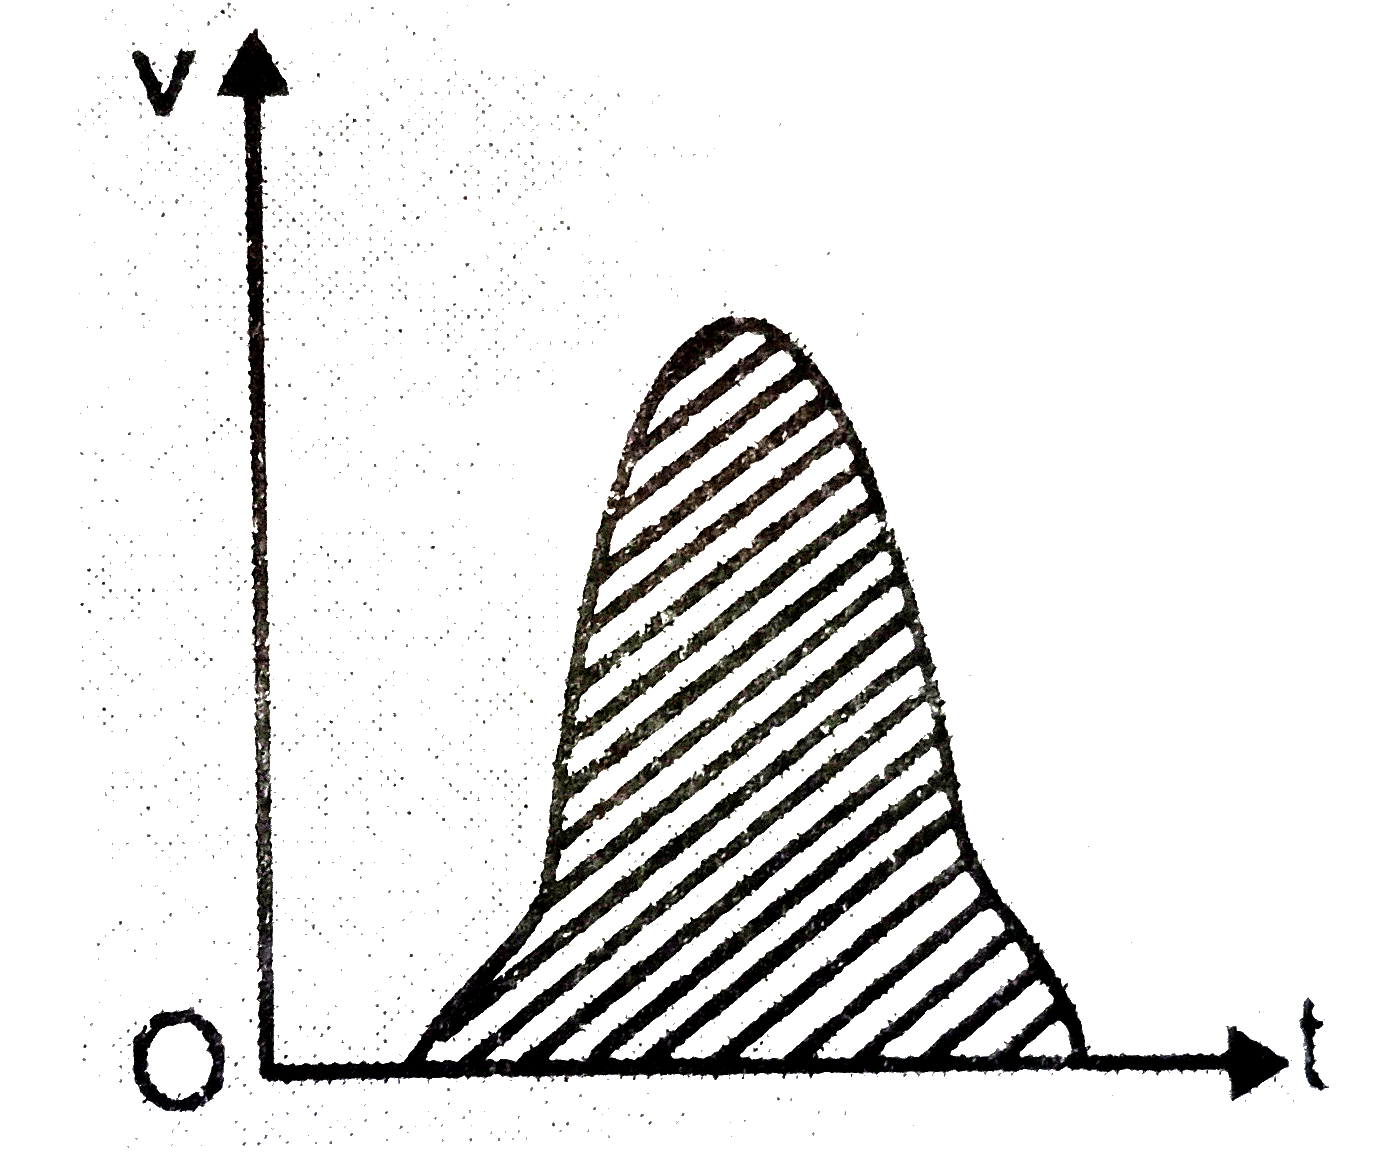
View SolutionFigure below shows the velocity-time graph of a one dimensional motion. Which of the following characteristic of the particle is represented by the shaded area?
View Solution

