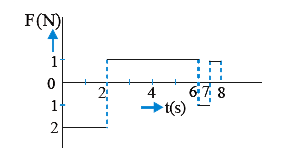
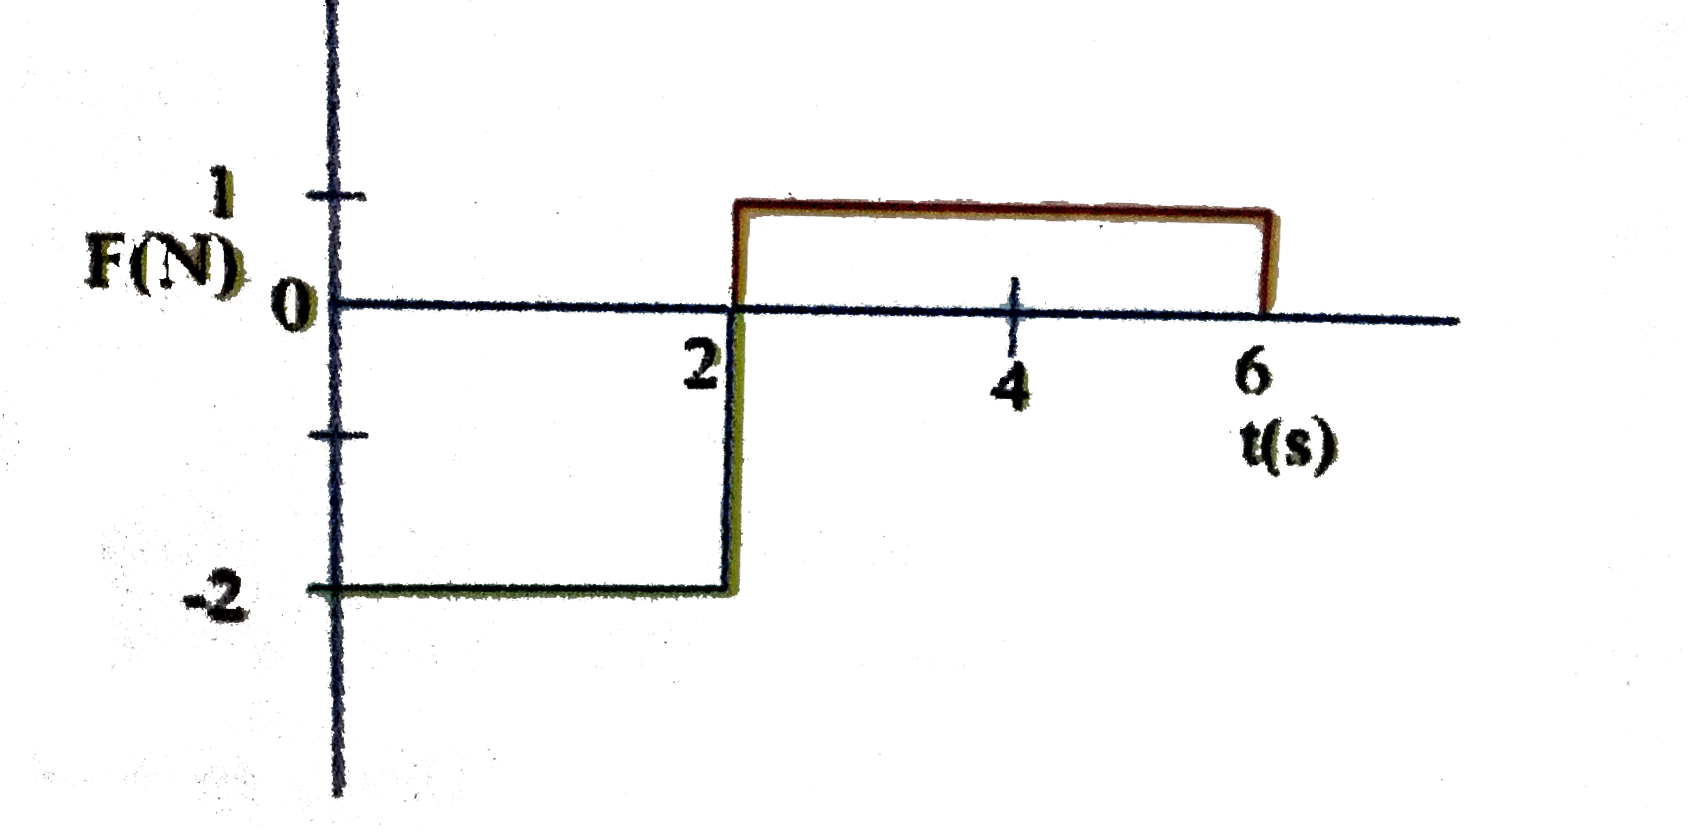
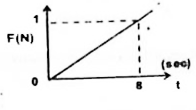
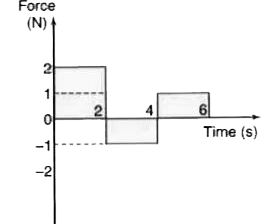
A force time graph for the motion of a body is as shown in Change in linear momentum between 0 and 6s is
 .
.
A
zero
B
8Ns
C
4Ns
D
2Ns
Video Solution
Text Solution
The correct Answer is:A
Area under F-t curve gives impulse
J=ΔP=m(v−u) .
|
Topper's Solved these Questions
- NEWTONS LAWS OF MOTIONBOOK - NARAYNACHAPTER - NEWTONS LAWS OF MOTIONEXERCISE - LEVEL -II (C.W)
71 Videos
- NEWTONS LAWS OF MOTIONBOOK - NARAYNACHAPTER - NEWTONS LAWS OF MOTIONEXERCISE - LEVEL -III
31 Videos
- NEWTONS LAWS OF MOTIONBOOK - NARAYNACHAPTER - NEWTONS LAWS OF MOTIONEXERCISE - C.U.Q
73 Videos
- MOTION IN A STRAIGHT LINEBOOK - NARAYNACHAPTER - MOTION IN A STRAIGHT LINEEXERCISE - Level 2 H.W
29 Videos
- OSCILLATIONSBOOK - NARAYNACHAPTER - OSCILLATIONSEXERCISE - EXERCISE - IV
41 Videos
Similar Questions
Knowledge Check
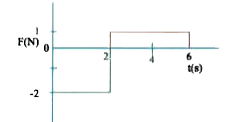
A force time graph for the motion of a body is as shown in figure. Change in linear momentum between 0 and 6s is
 AzeroB8 NsC4 NsD2 Ns
A force-time graph for the motion of a body is shown in fig. change in linear momentum between 0 and 8 s is:-
 AZeroB4N-sC8NsDNone
A force-time graph for the motion of a body is shown in figure. Change in linear momentum between 0 and 8 s is:
 AZeroB4 N-sC8 NsDNone of these
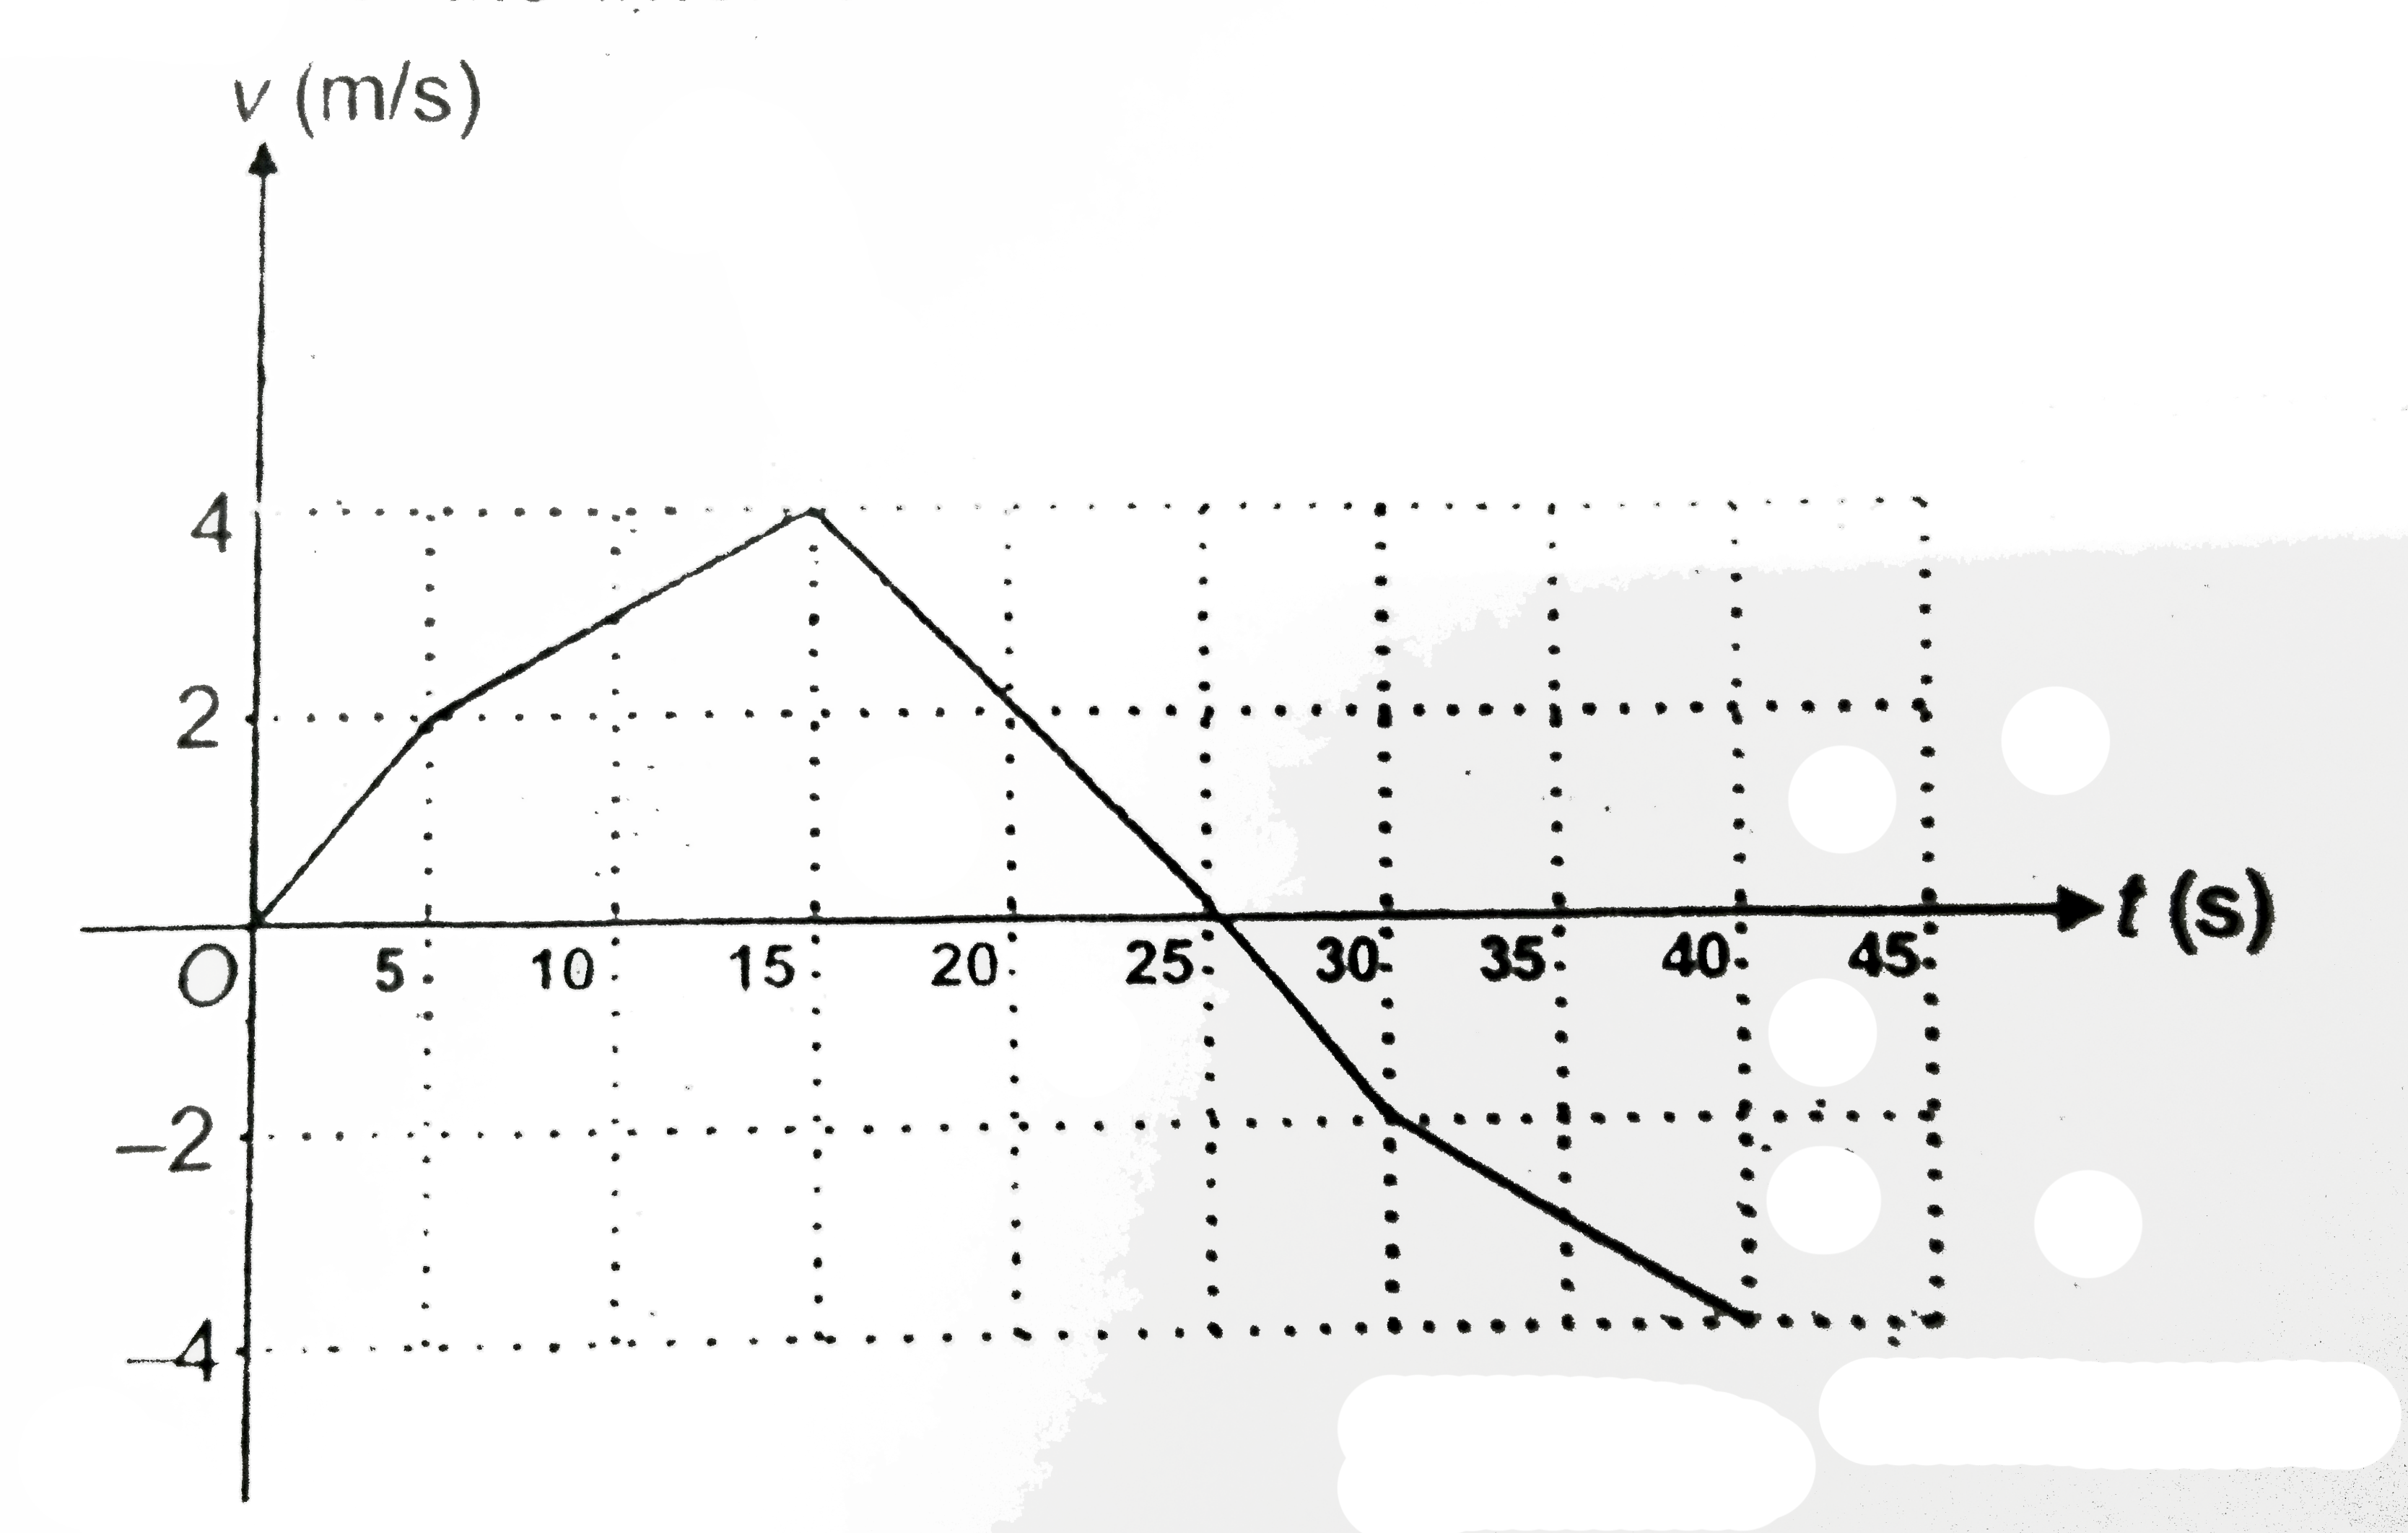
If velocity-time graph of a body is as shown in figure, what is the nature of motion ?
View SolutionA constant force of 12 N acts on a body for 4s. Find the change in the linear momentum of the body.
View SolutionA force-time graph for a linear motion is shown in figure. The linear momentum gained between 0 and 6 second is
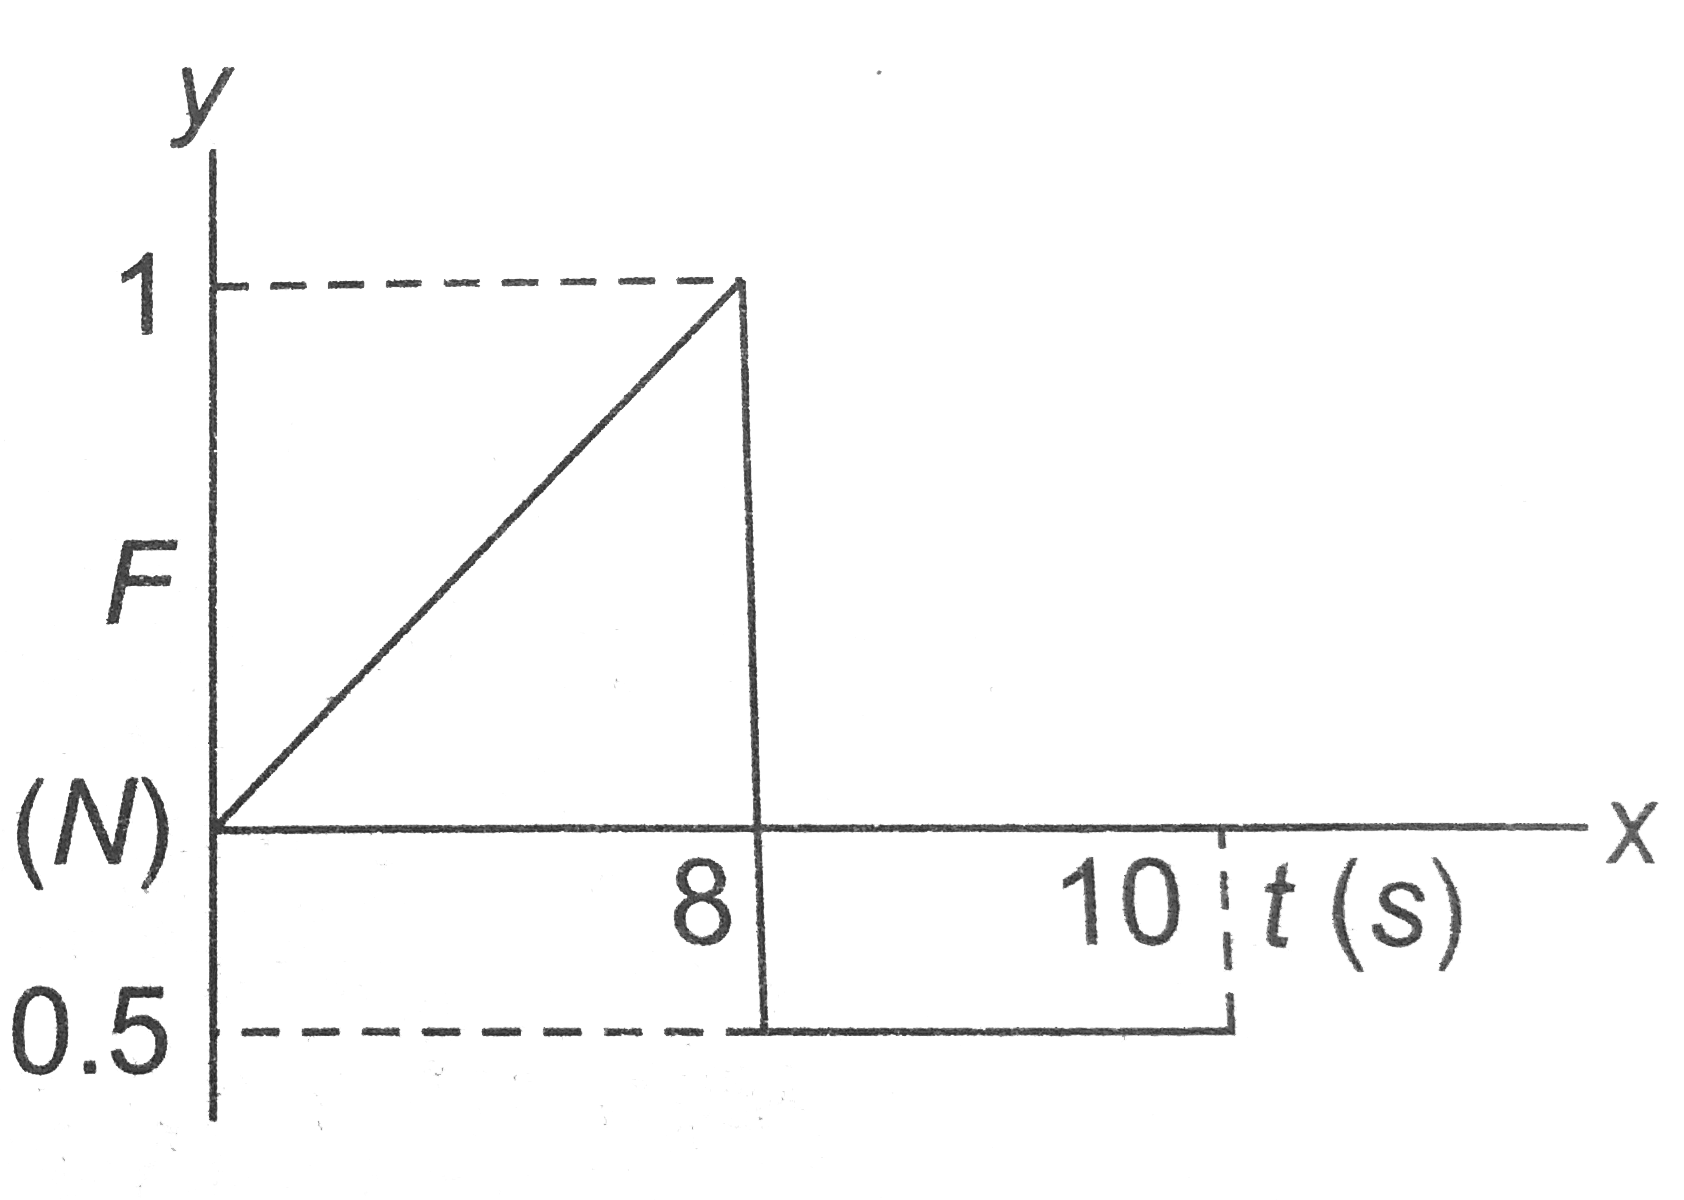
View SolutionA force-time graph for the motion of a body is shown in the figure. The change in the momentum of the body between zero and 10sec is
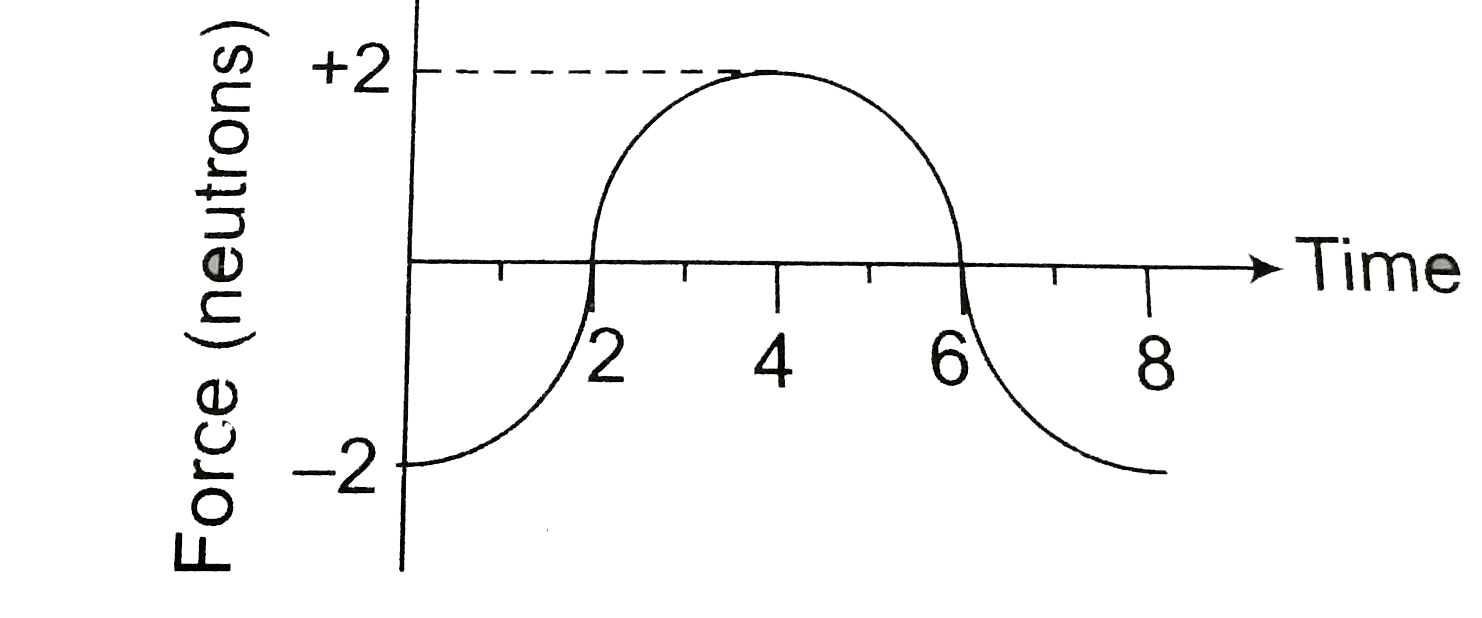
View SolutionA force - time graph for a linear motion is shown in the figure where the segments are circular. The linear momentum gained between zero and 8s is
View Solution

