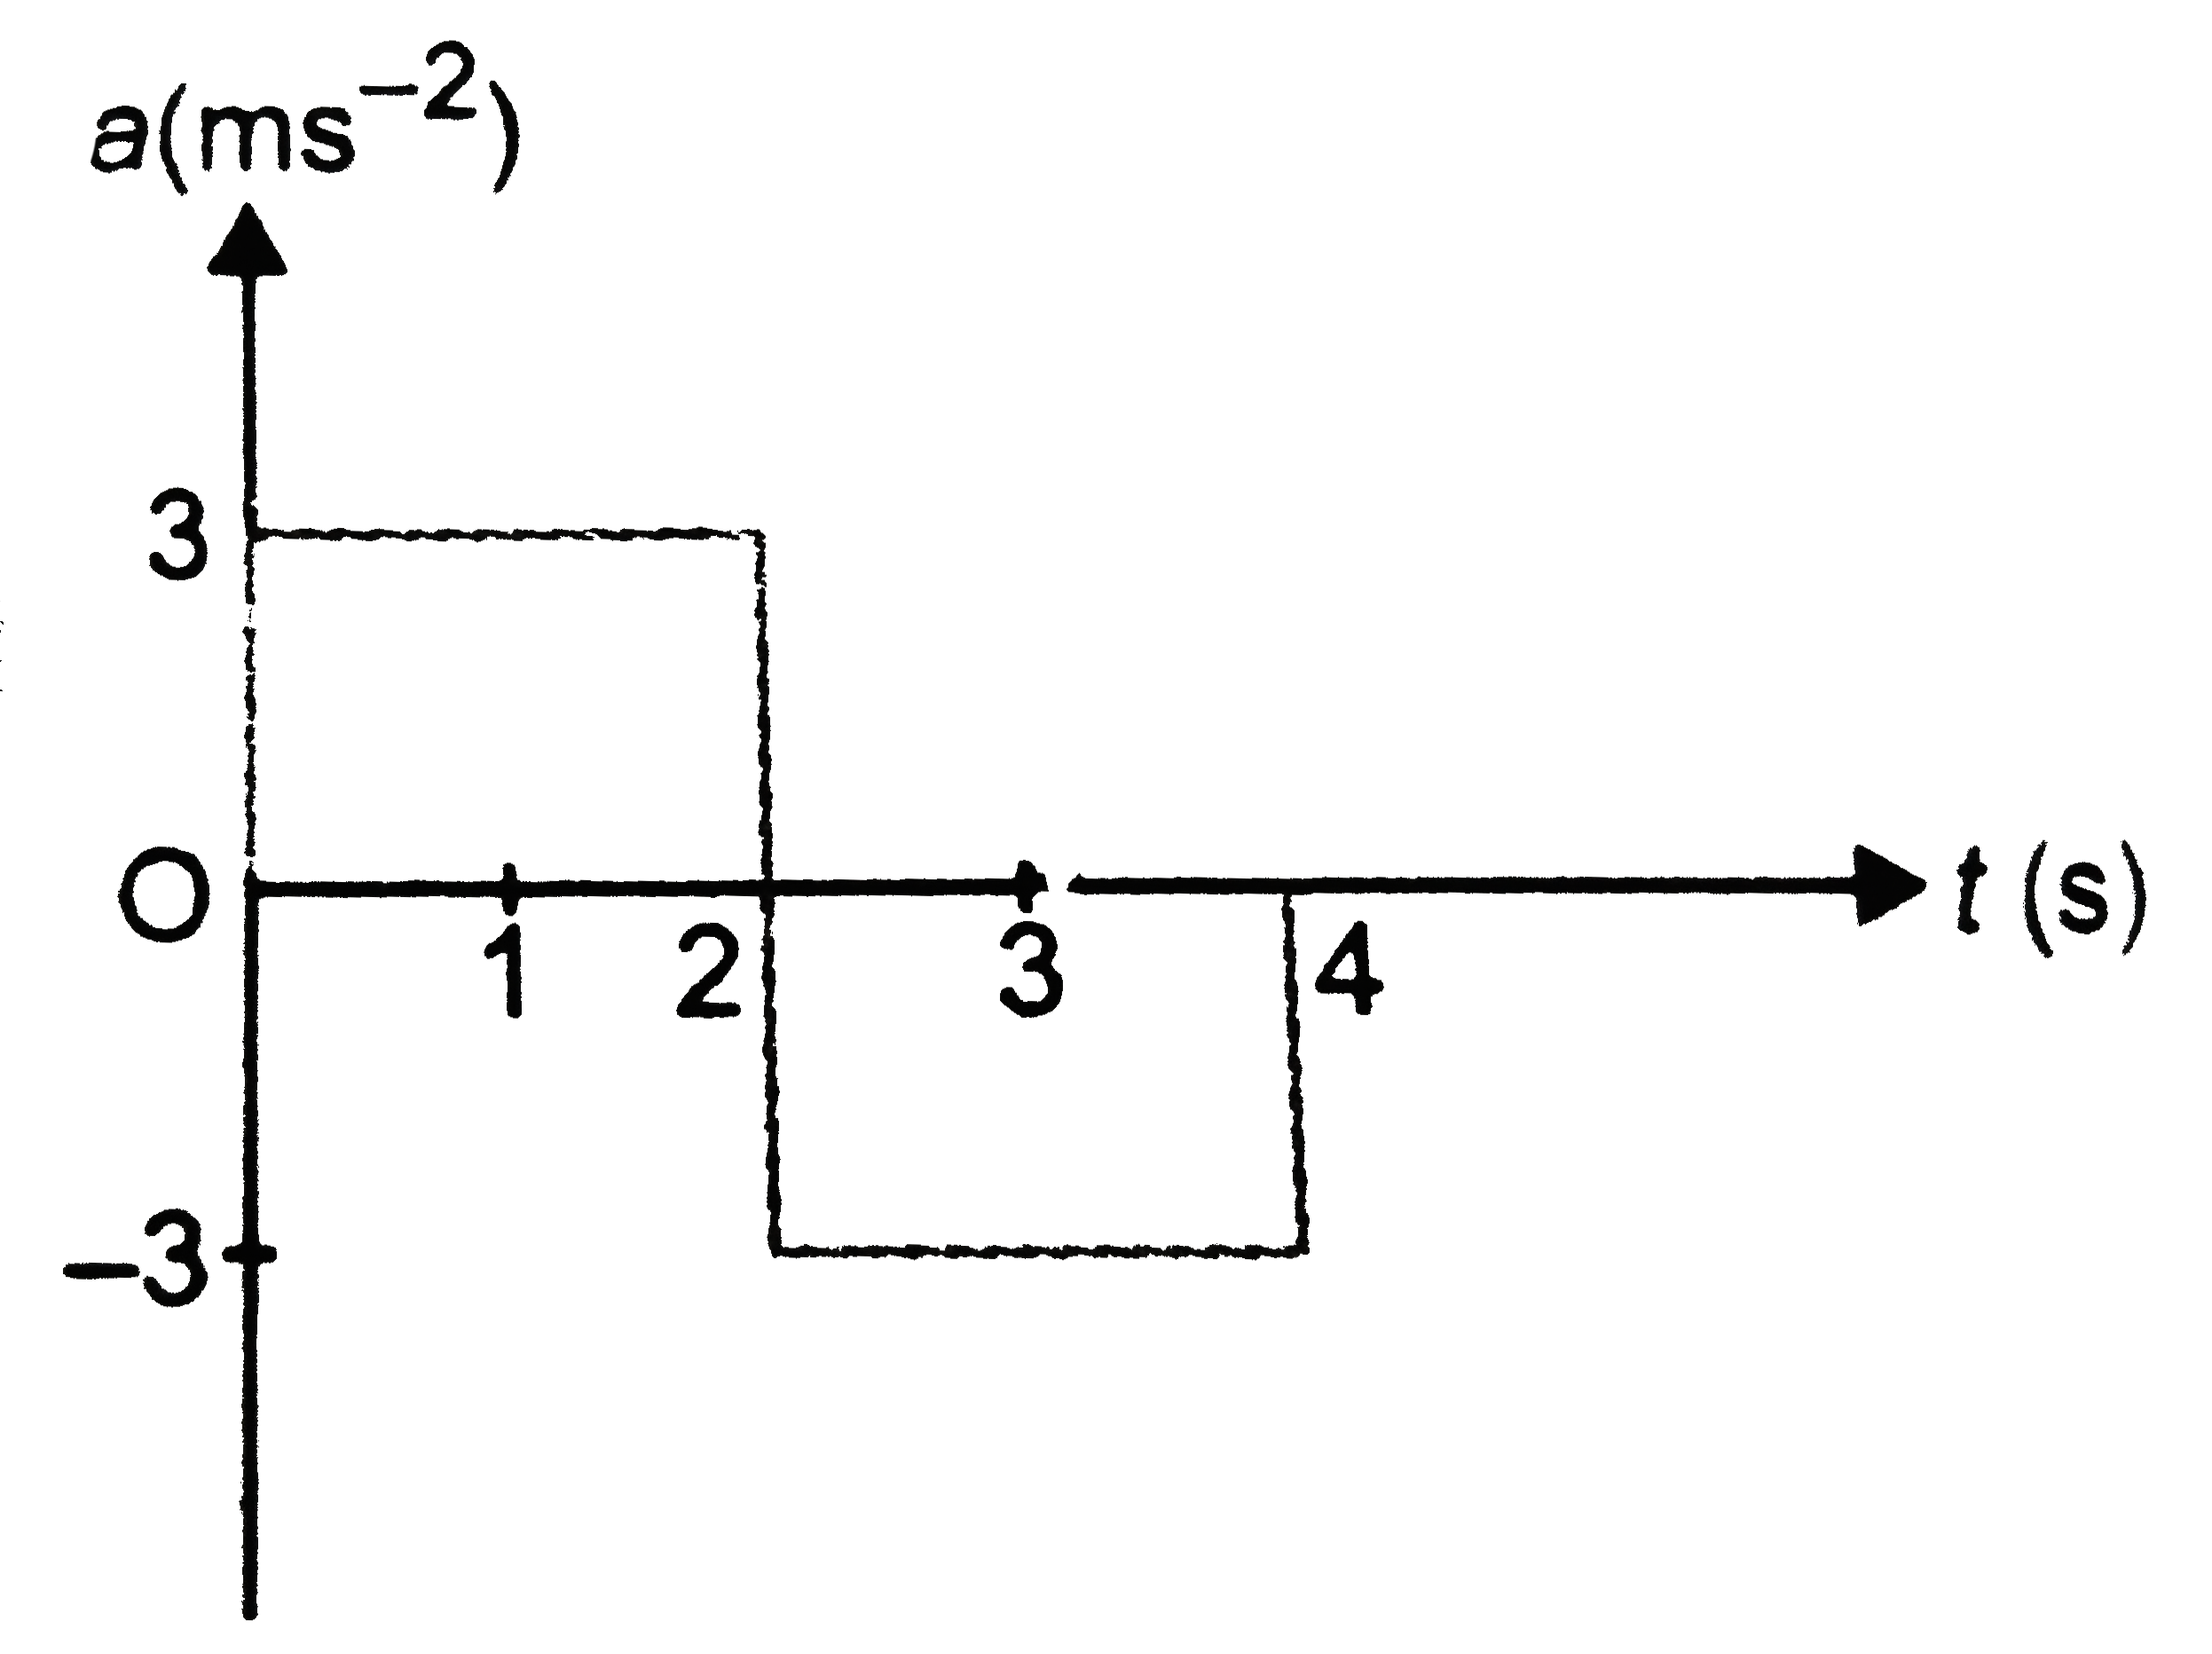
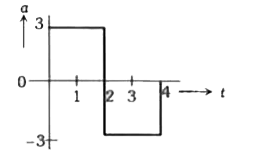
A particle starts from rest at t=0 and undergoes and acceleration (a) in ms−2 with time (t) in seconds which is shown in Fig. 2 (DF) .16 . Which one of the following plot represents velocity (v) (in ms−1) verses time (in seconds ) ?


The correct Answer is:A
t = 0 to 2 sec
u = 0,a=3m/s2
⇒v=u+at=3×2=6m/s
Now, t = 2 to 4 second
v=6−3×2=0m/s
a=3,0<t<2
=−3,2<t<4

Similar Questions
t = 0 पर एक कण विराम से गति प्रारम्भ करता है तथा इसे समय (सेकण्ड में) के साथ त्वरण a(m//s^2 " में ") के प्रभाव में दर्शाया गया है

निम्न में से कौनसा ग्राफ वेग (ms−1 में) का समय t (सेकण्ड में) के साथ निरूपण व्यक्त करता है
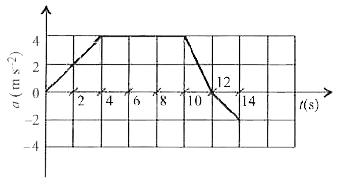
View SolutionA graph of acceleration versus time of a particle starting from rest at t =0 is shown. The speed of the particle at t=14 second is

View SolutionA particle starts from rest .its acceleration a versus time t is as shown in the figure . Find the maximum speed of the particle during its motion
(a is in ms−2and t is in seconds)
View Solutionएक कण सरल रेखा में समय t पर ams−2 के त्वरण से गतिमान है। जहाँ a=−1t2 है| t = 1s पर कण का वेग 3ms−1 है तो t = 4s पर कण का वेग ज्ञात करो।
View SolutionAt time t = 0, a car moving along a straight line has a velocity of 16 ms^-1. It slows down with an acceleration of -0.5t ms^-2, where t is in second. Mark the correct statement (s).
View SolutionA particle starts from rest with a time varying acceleration a=(2t−4). Here t is in second and a in m/s2
The velocity time graph of the particle is
View SolutionAcceleration - time graph of a particle moving in a straight line is shown in figure. Velocity of particle at time t = 0 is 2 ms^(-1) . Find velocity at the end of fourth second.
View SolutionA particle starts from rest at t=0 and undergoes and acceleration (a) in ms−2 with time (t) in seconds which is shown in Fig. 2 (DF) .16 . Which one of the following plot represents velocity (v) (in ms−1) verses time (in seconds ) ?

View Solution
