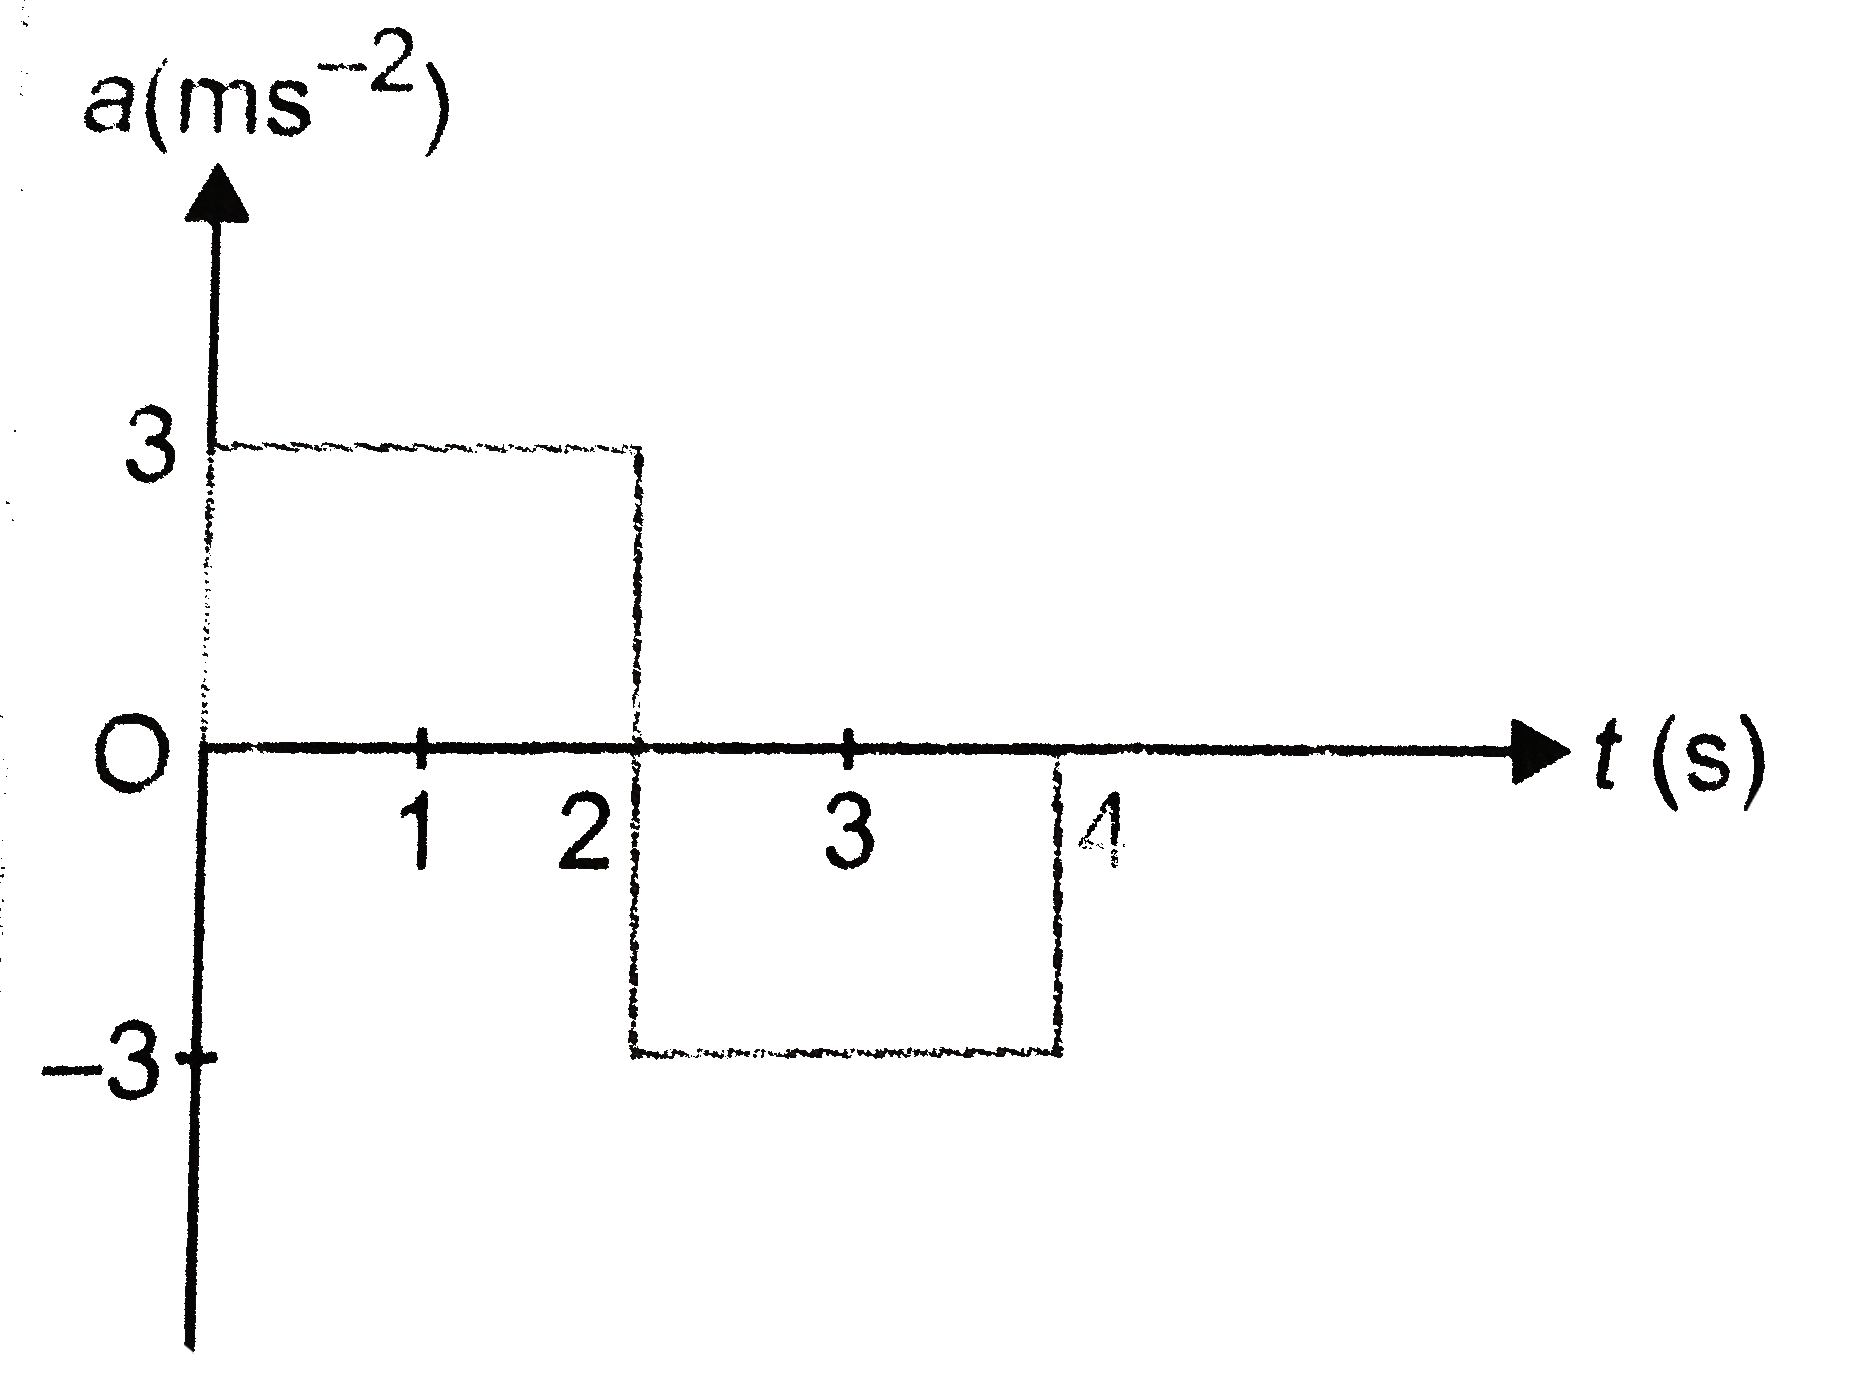
A particle starts from rst at t=0 and undergoes and acceleration (a) in ms^(-2) with tiem (t) in seconds which is shown in Fig. 2 (DF) .16 . Which one of the following plot repesents velocity (v) (in ms_1) versis time (in seconds ) ?

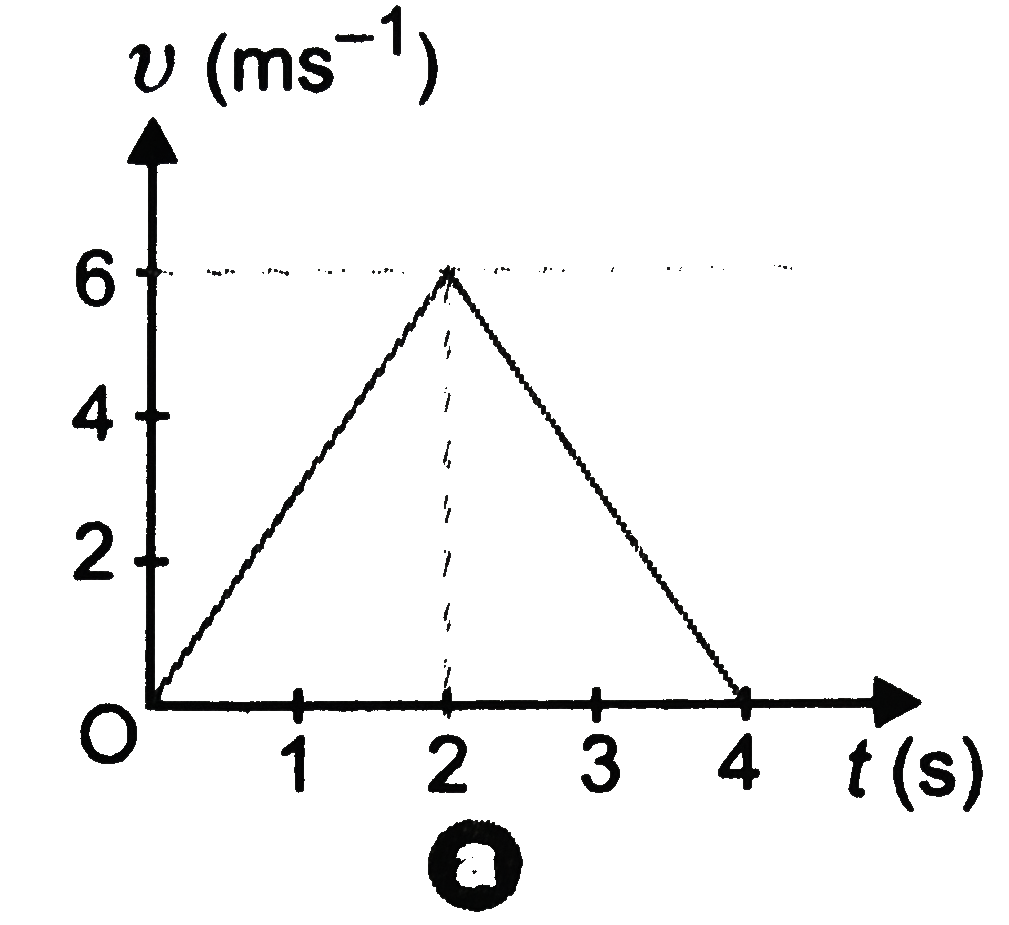
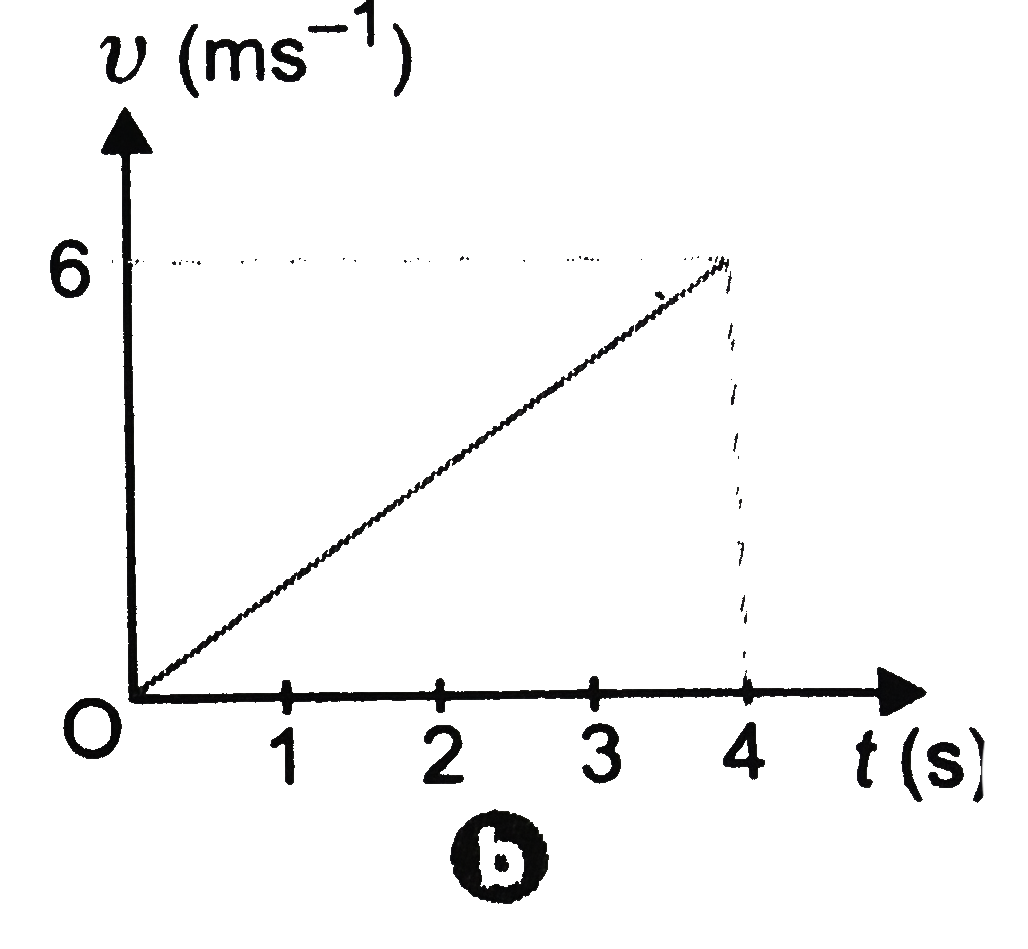
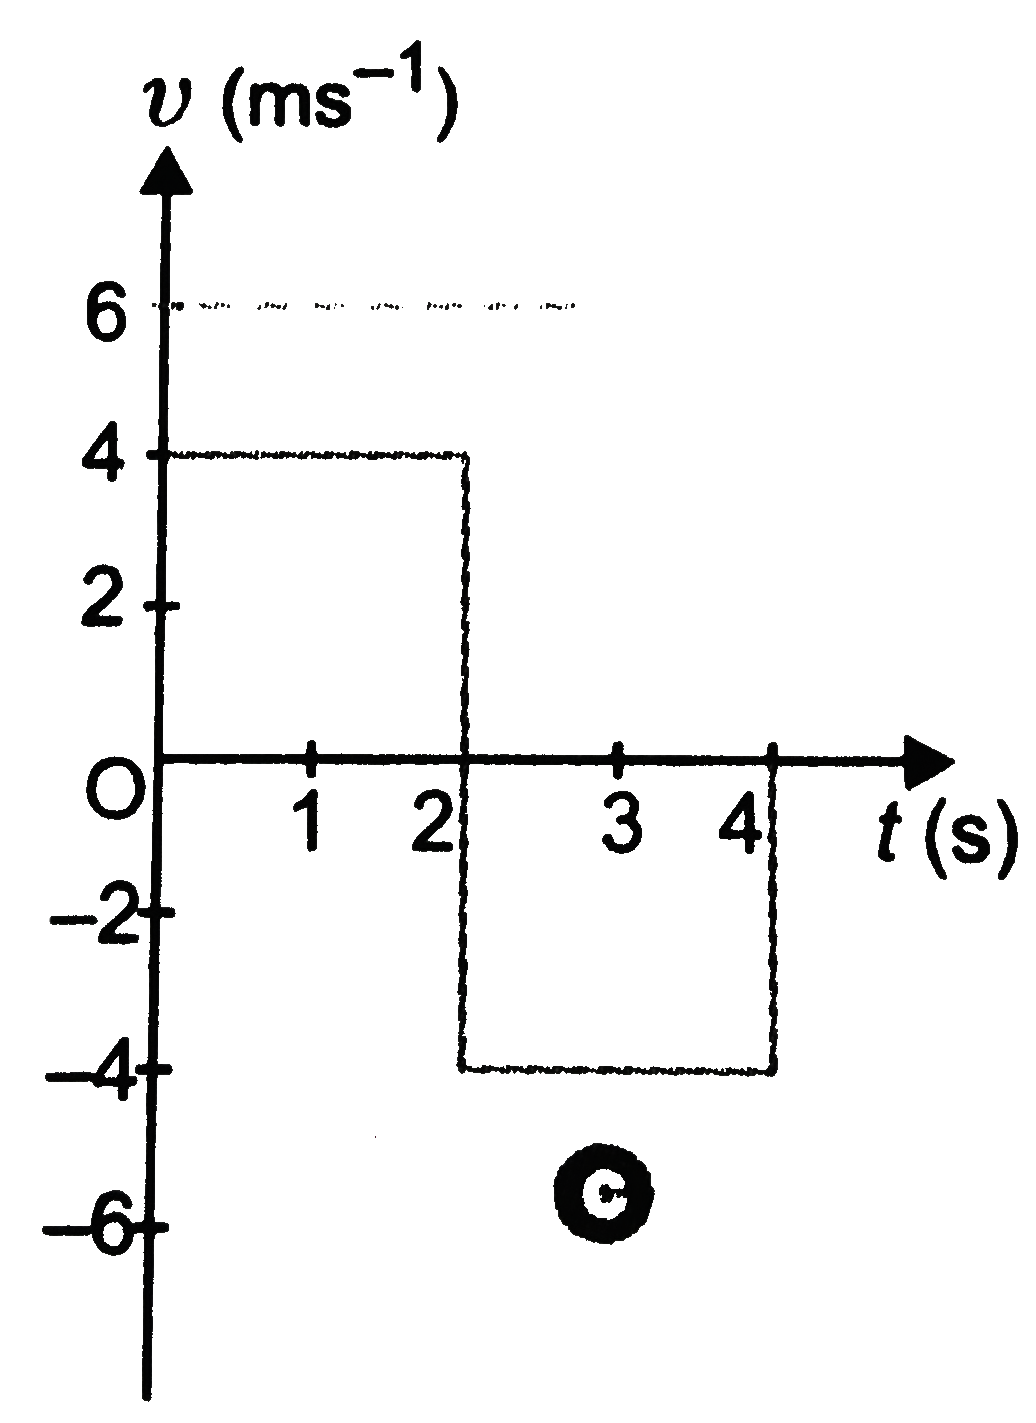
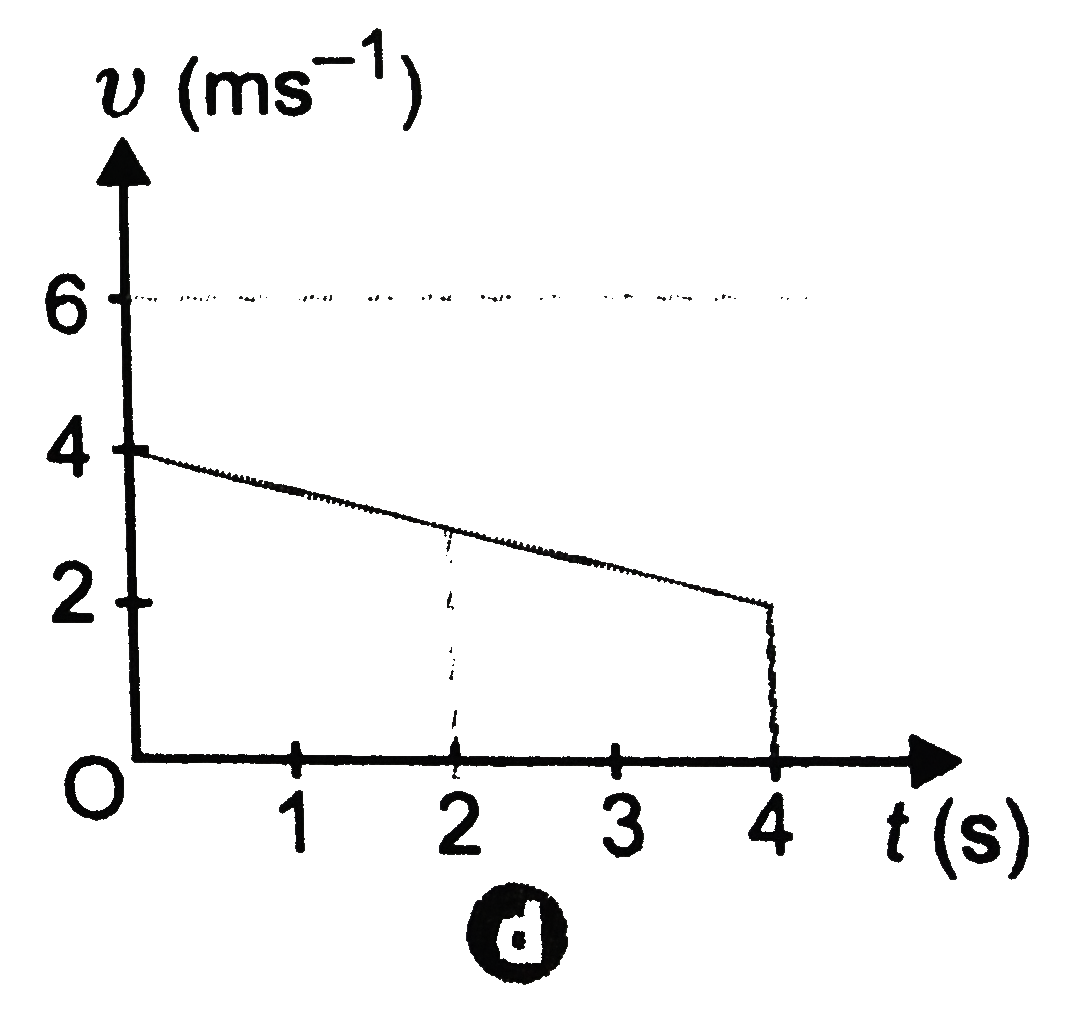
The correct Answer is:A
Refer to Fig. 2 (CF) . 48,
 .
.
taking the motion of particle from 0 to 2s, we have u=0,a=3ms−2,t=2s,v=?
v=u+at=0+3×2=6ms−1
Taking motion of particle from 2s to 4s, we have
v=6+(−3)×(2)=0ms−1.
Topper's Solved these Questions
- KINEMATICSBook:PRADEEPChapter:KINEMATICSExercise:4 NCERT multiple Choice
Explore 10 Videos
- KINEMATICSBook:PRADEEPChapter:KINEMATICSExercise:4 NCERT Integer type
Explore 4 Videos
- KINEMATICSBook:PRADEEPChapter:KINEMATICSExercise:2 NCERT multiple
Explore 15 Videos
- GRAVIATIONBook:PRADEEPChapter:GRAVIATIONExercise:Assertion-Reason Type Questions
Explore 19 Videos
- LAWS OF MOTIONBook:PRADEEPChapter:LAWS OF MOTIONExercise:Assertion- Reason Type Questions
Explore 17 Videos
Similar Questions
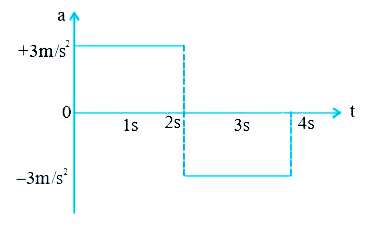
A particle starts from rest at t=0 and undergoes an acceleration as shown in figure.
Draw the velocity-time graph of the motion of the particle during the interval from zero to 4 second.
View SolutionA particle starts from rest at t=0 and moves along a straight line with a variable acceleration given by a (t)=(3t+1)ms−2 ,where t],[ is in seconds.The velocity of the particle at t=4s is
View Solution
Knowledge Check
The distance travelled by a particle starting from rest and moving with an acceleration 43ms−2, in the third second is.
A6 mB4 mC103mD193mA particle starts from rest with a time varying acceleration a=(2t−4). Here t is in second and a in m/s2
The velocity time graph of the particle isAparabola passing through originBstraight line not passing through originCparabola not passing through originDstraight line passing through originA particle starts from rest with a time varying acceleration a=(2t−4). Here t is in second and a in m/s2
Particle comes to rest after a time t=………… secondA1B4C3D2
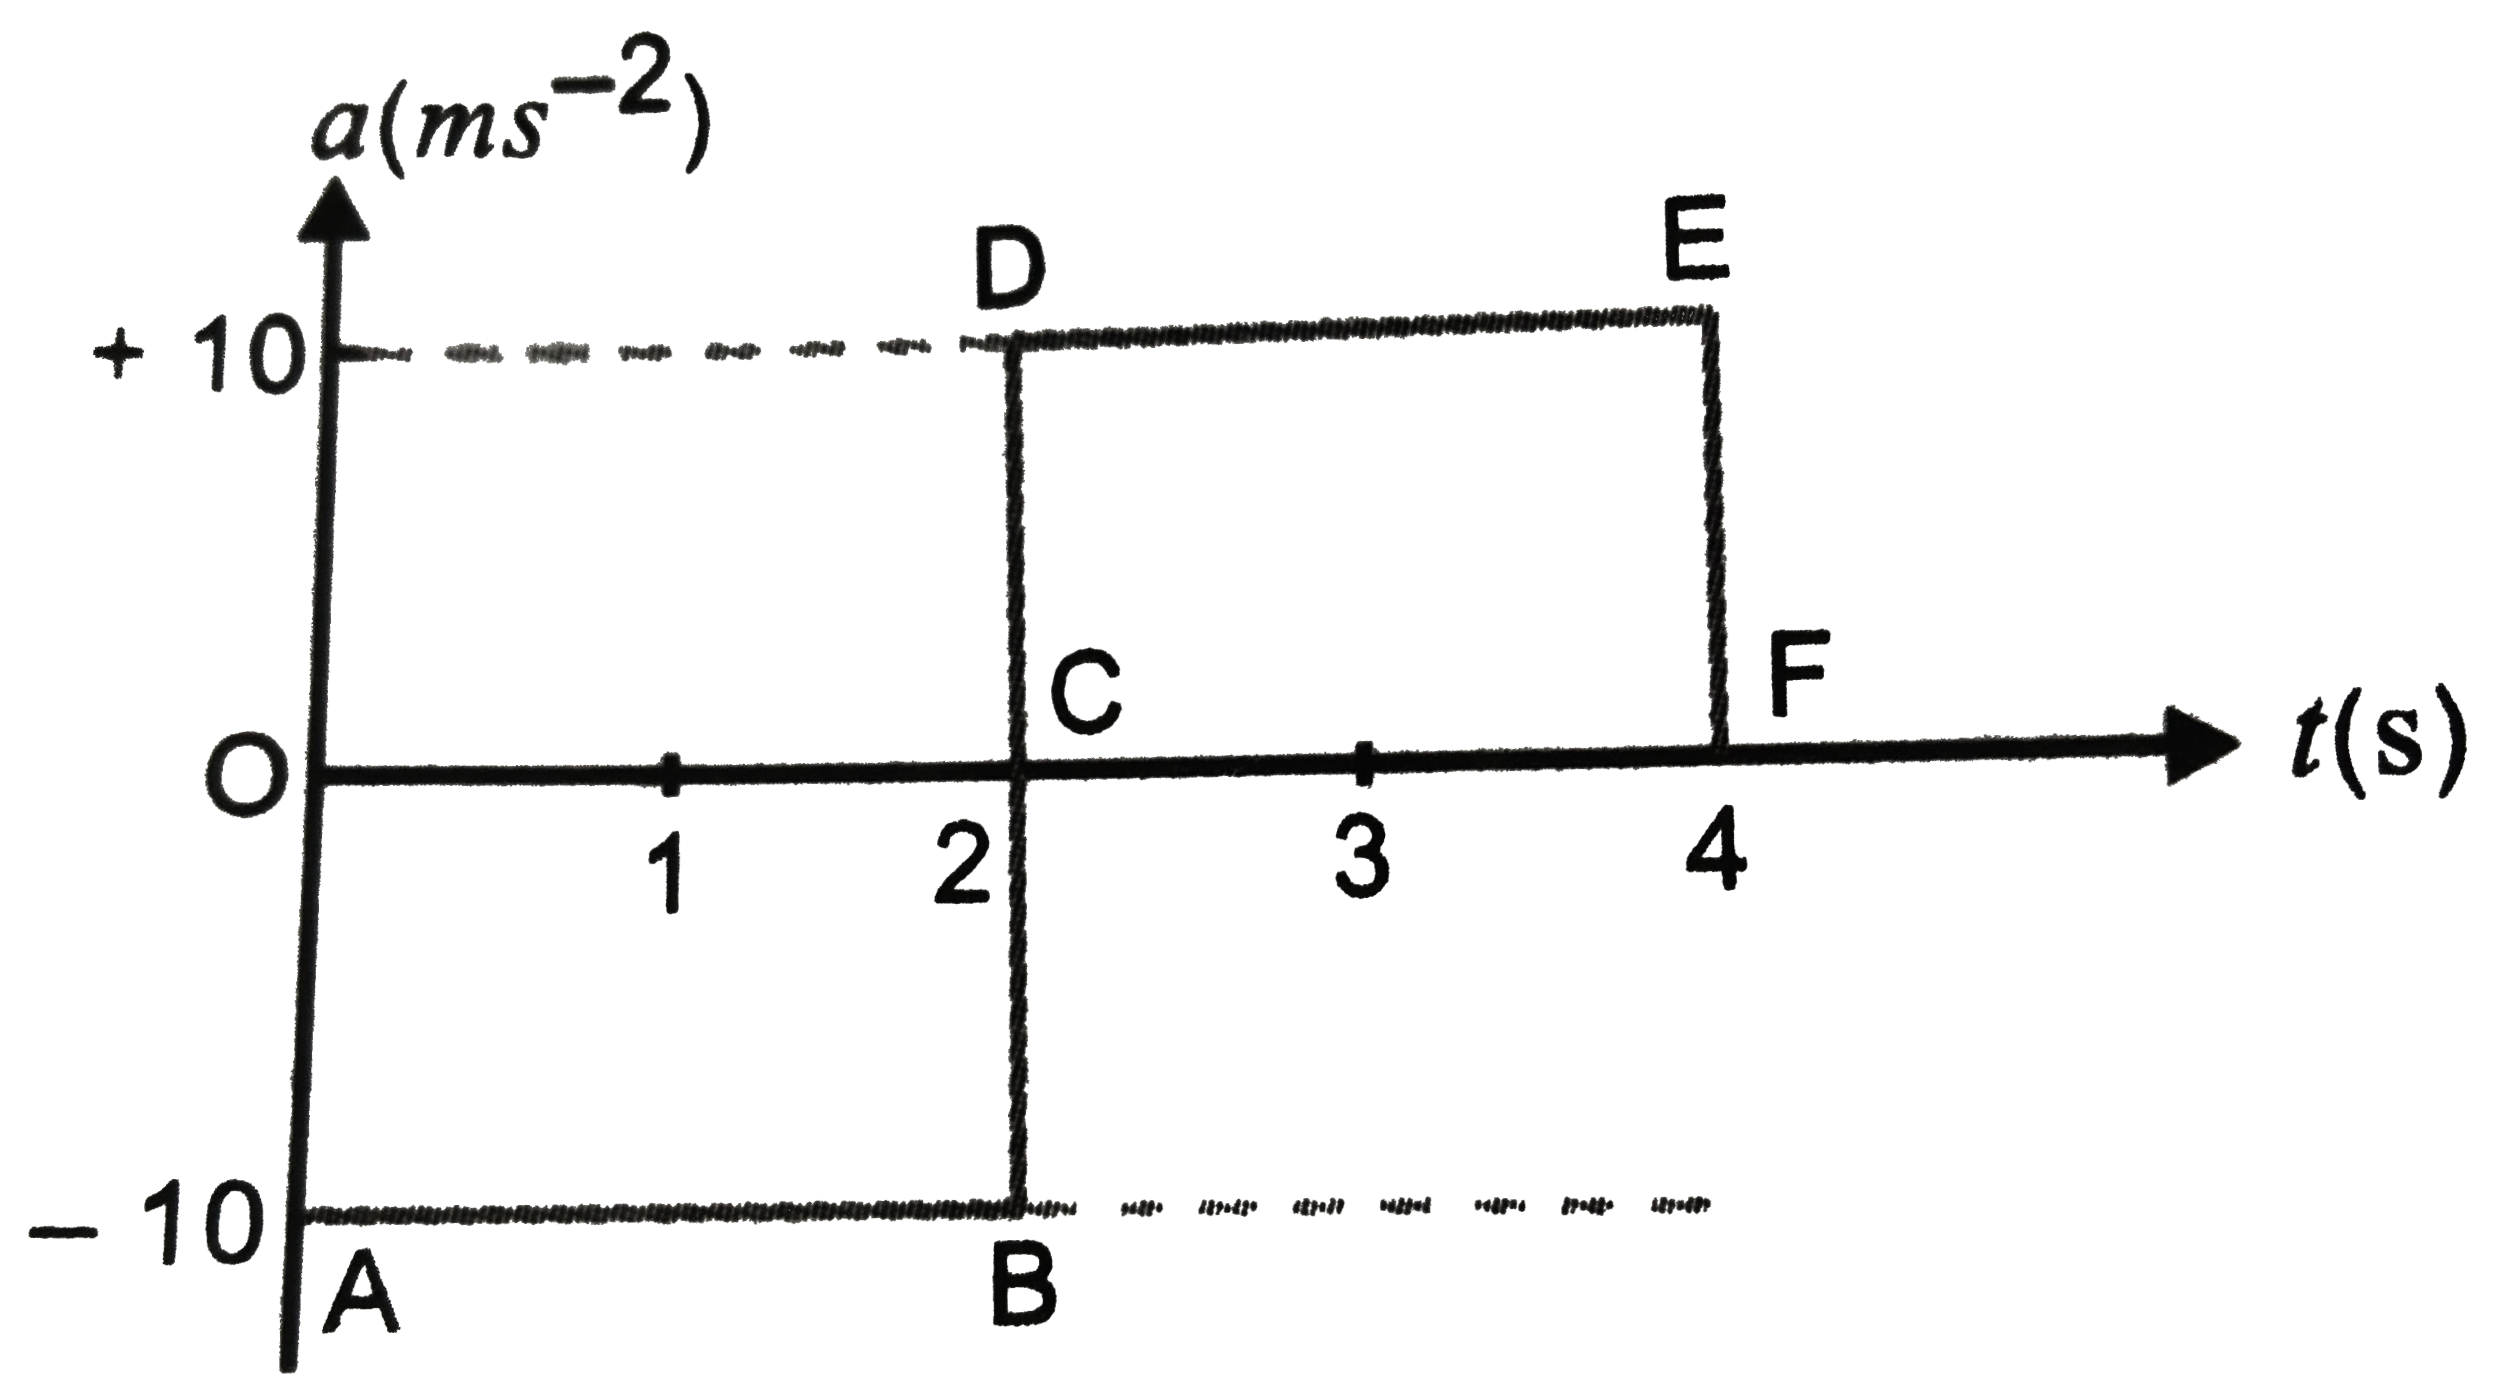
A particle starts from rest at time t=0 and moves on a straight line with acceleration a (ms^-2) as plotted in Fig. 2 (b) .17. Find the time at which the speed og the particle is maximum. Also calculate the displacement of theparticle from starting point after 4s.
 .
.
View SolutionA particle starts from rest, moving in a straight line with a time varying acceleration (inm/s2):a=30−152√t, where time is in seconds . The displacement of the particle in 4 seconds is .
View SolutionA particle starts from rest, accelerates uniformly for 3 seconds and then decelerates uniformly for 3 seconds and comes to rest. Which one of the following displacement (x)-time (t) graphs represents the motion of the particle?
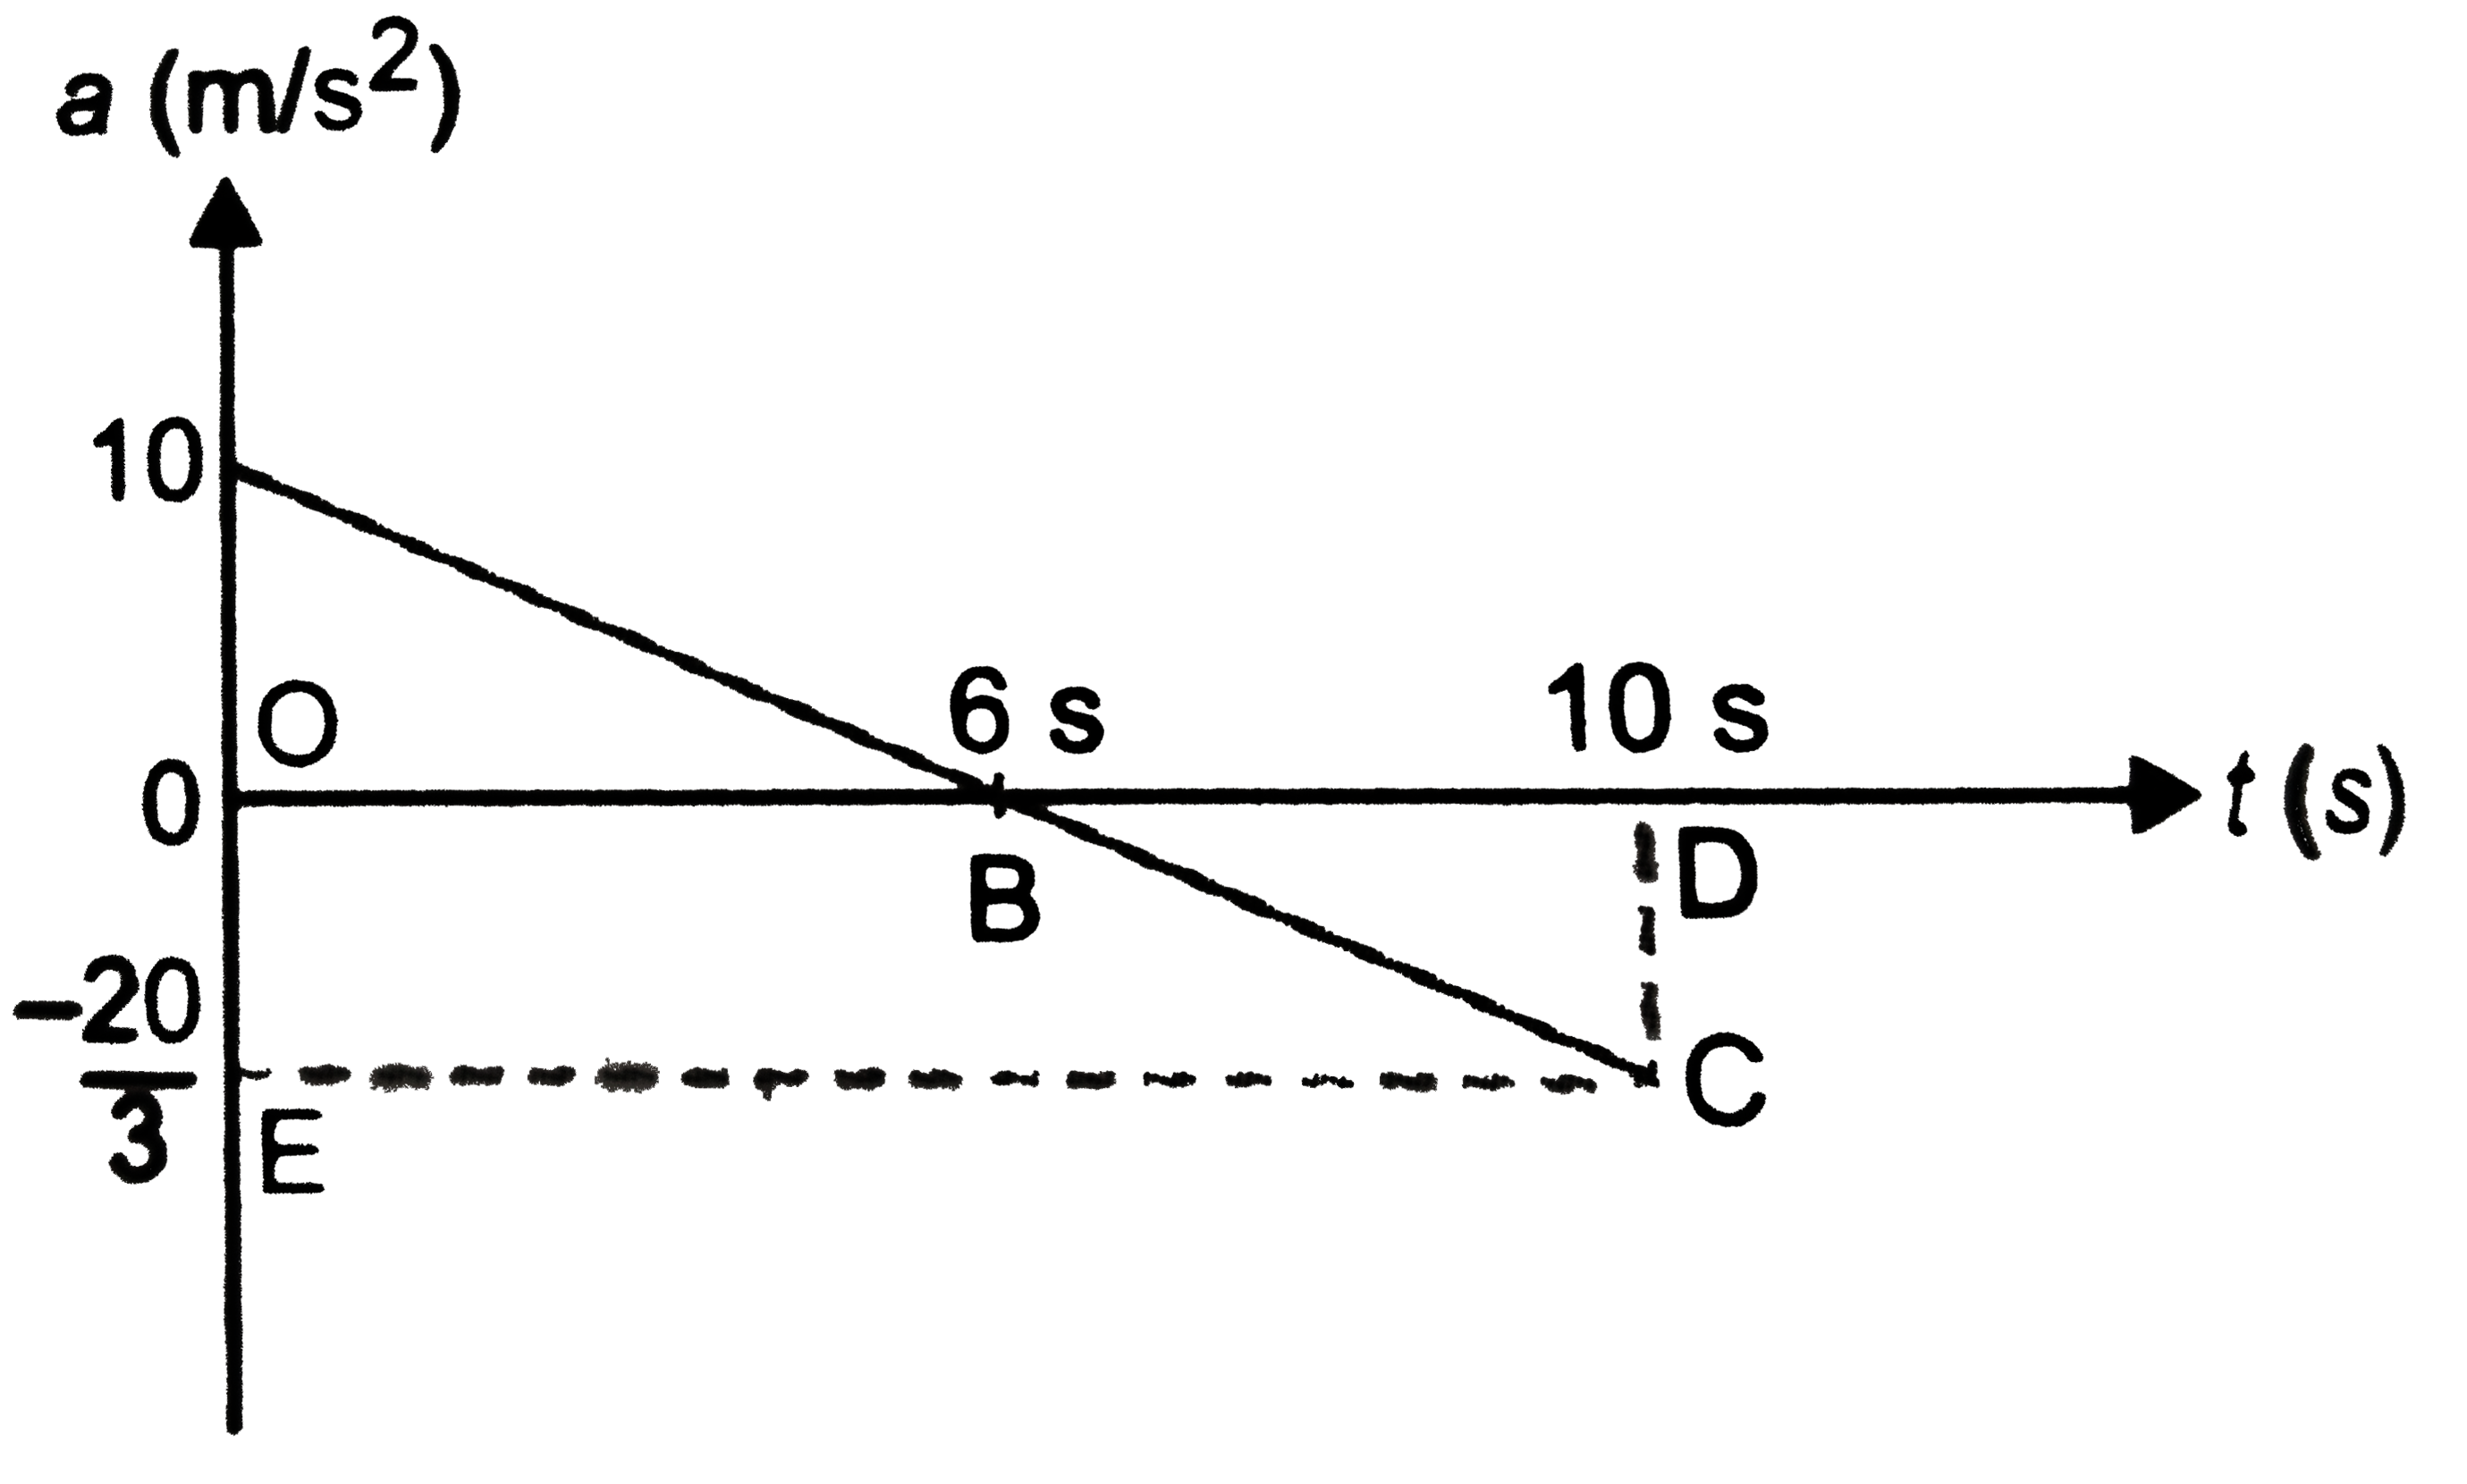
View SolutionThe acceleration time graph of a particle is shown in the Fig. 2 (CF). 11. At time t=10s is the particle is 8ms−1. Its velocity t=10s is.
 .
.
View SolutionA particle starts from rest with a time varying acceleration a=(2t−4). Here t is in second and a in m/s2
Maximum velocity of particle in negative direction is at t=…………… second
View Solution

