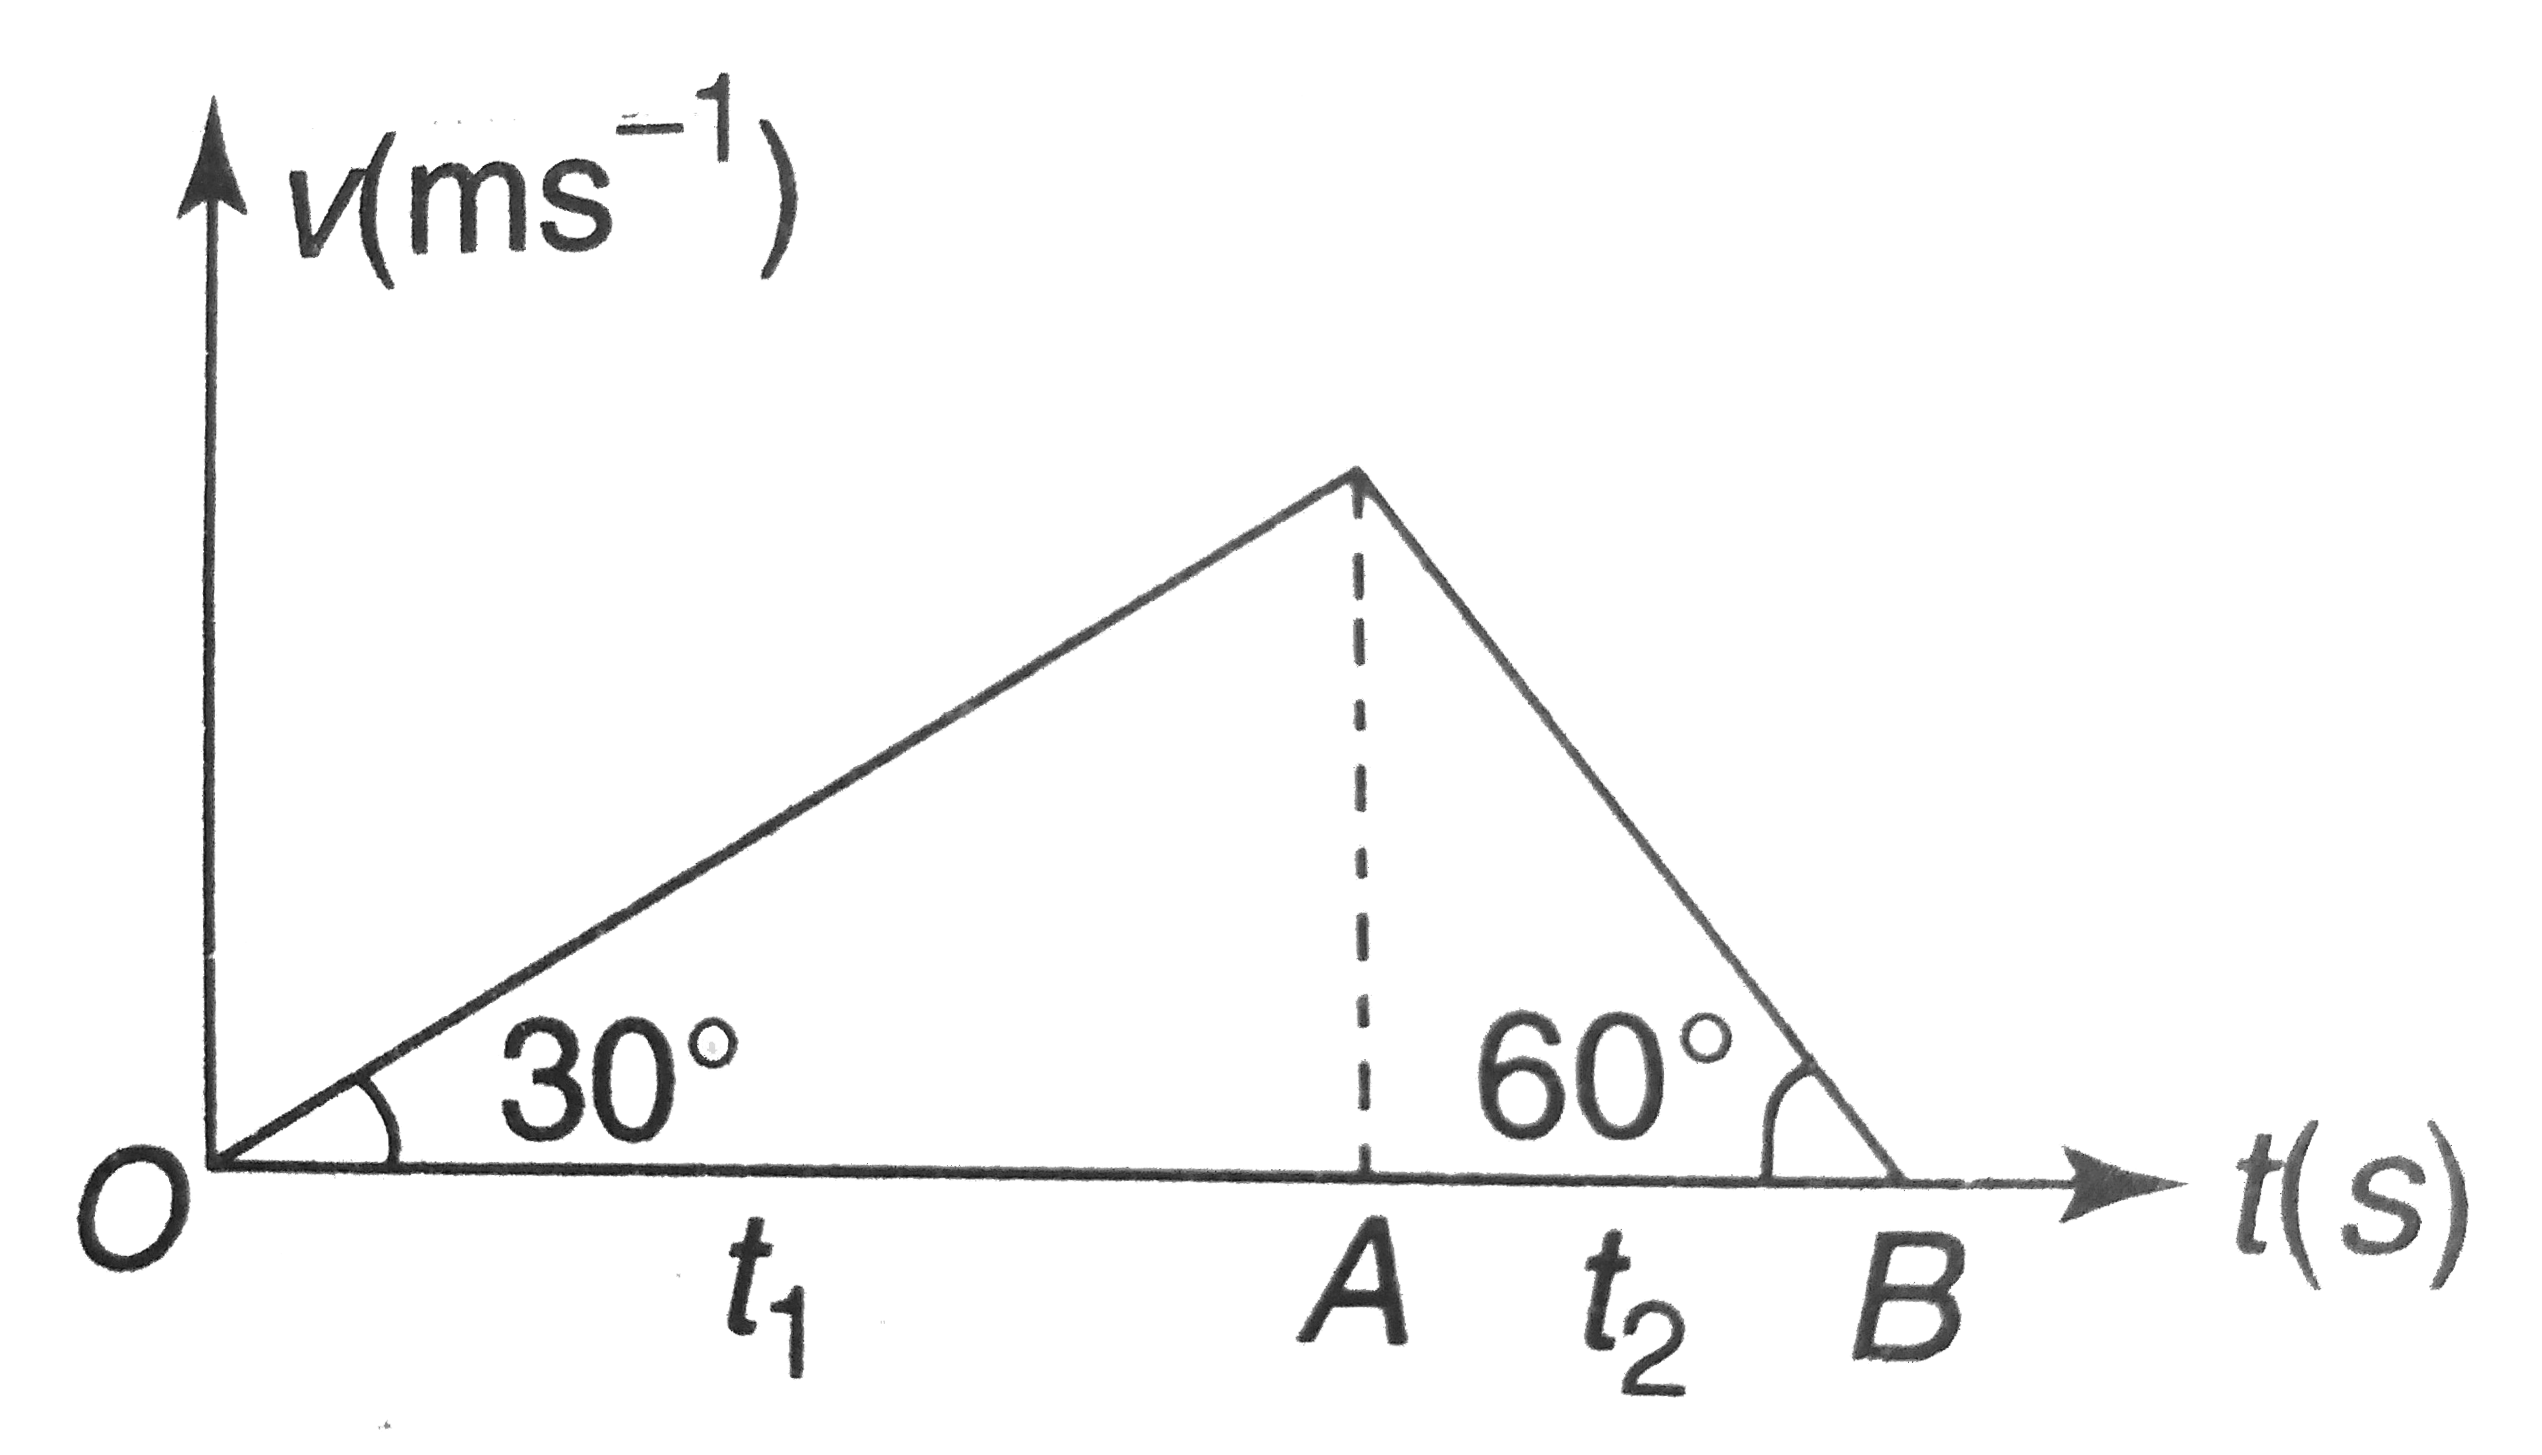
The drawing shows velocity (v) versus time (t) graphs for two cyclists moving along the same straight segment of a highway from the same point. The second cyclist starts moving at t=3min. At what time do the two cysclist meet ?
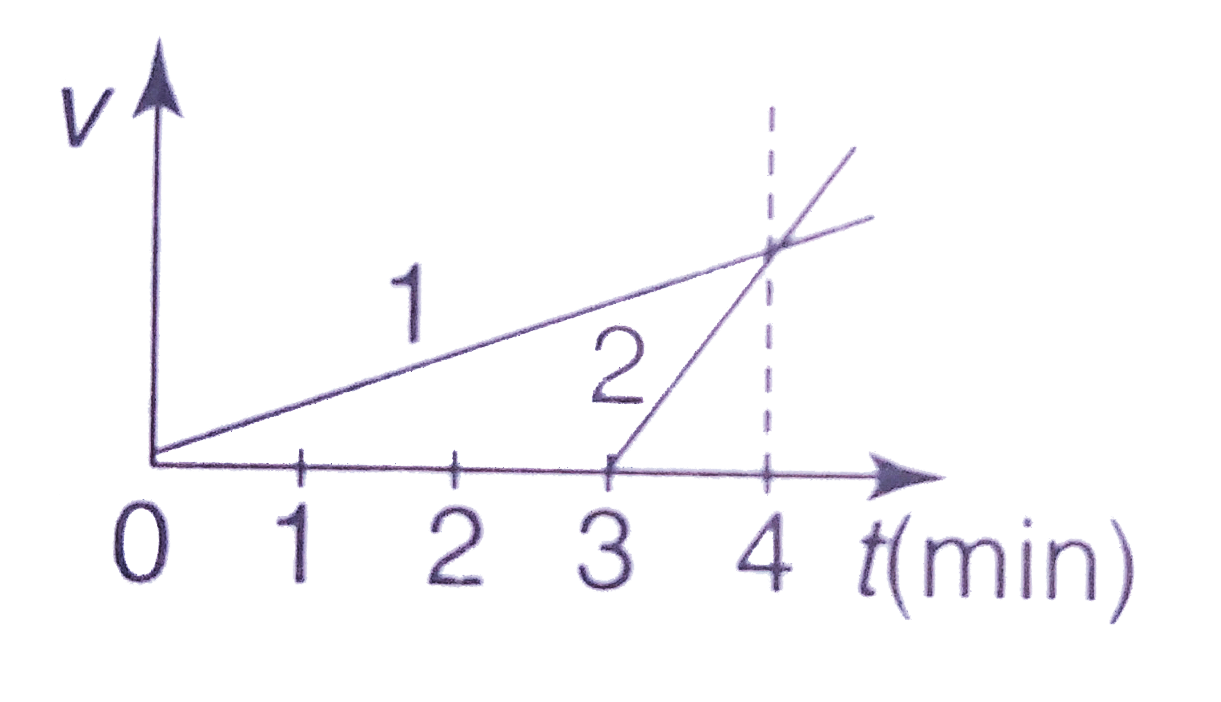
Acceleration of cyclist A,a1= slope of straight line OA=MC4
Aceeleration of cyclist B,a2= slope of straight
L∈e DB = ((MC))/((4-3)) = (MC)/1 <br>∴ a_1 /a_1 = ((MC))//4)/((MC)//1) = 1/4…(i)<br>Letthetwocyclistmeetaftertiem(t),whentimeis¬edomthestatrtofcyclist(A).Atmeet∈gp∮,thedistatncecovertedby⊥hthecyclististhesame.<br>So,1/2 a_1 t^2 = 1/2 a_2(t -3)^2<br>or a_1/a_2 = ((tt-3)^2)/t_2 = 1/4[om(i)]
or t−3t=12or 2 t- 6 or t= 6 min.
Topper's Solved these Questions
- KINEMATICSBook:PRADEEPChapter:KINEMATICSExercise:1 NCERT Assertion-Reaseon Type
Explore 14 Videos
- KINEMATICSBook:PRADEEPChapter:KINEMATICSExercise:1 NCERT Comprehension
Explore 4 Videos
- KINEMATICSBook:PRADEEPChapter:KINEMATICSExercise:4 NCERT multiple Choice
Explore 10 Videos
- GRAVIATIONBook:PRADEEPChapter:GRAVIATIONExercise:Assertion-Reason Type Questions
Explore 19 Videos
- LAWS OF MOTIONBook:PRADEEPChapter:LAWS OF MOTIONExercise:Assertion- Reason Type Questions
Explore 17 Videos
Similar Questions
Knowledge Check
The velocity versus time graph of a body moving along a straight line is as shown in figure. The ratio of displacement and distance covered body in 5 second is :-
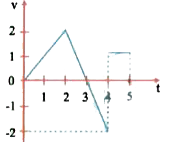 A2:3B3:5C1:1D1:5:5
The figure shows a velocity-time graph of a particle moving along a straight line
Q. If the particle starts from the position x0 = –15 m, then its position at t = 2s will beA−5mB5mC10mD15mThe figure shows a velocity-time graph of a particle moving along a straight line
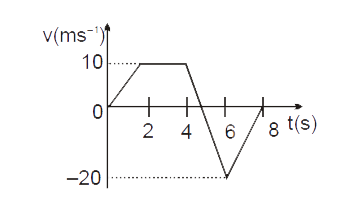
If the particle starts from the position x0=–15 m, then its position at t = 2s will beA−5mB5mC10 mD15 m
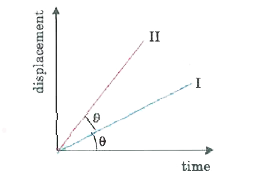
From the given displacement - time graph of two cars moving on a straight road , which of the following is moving with greater velocity ?
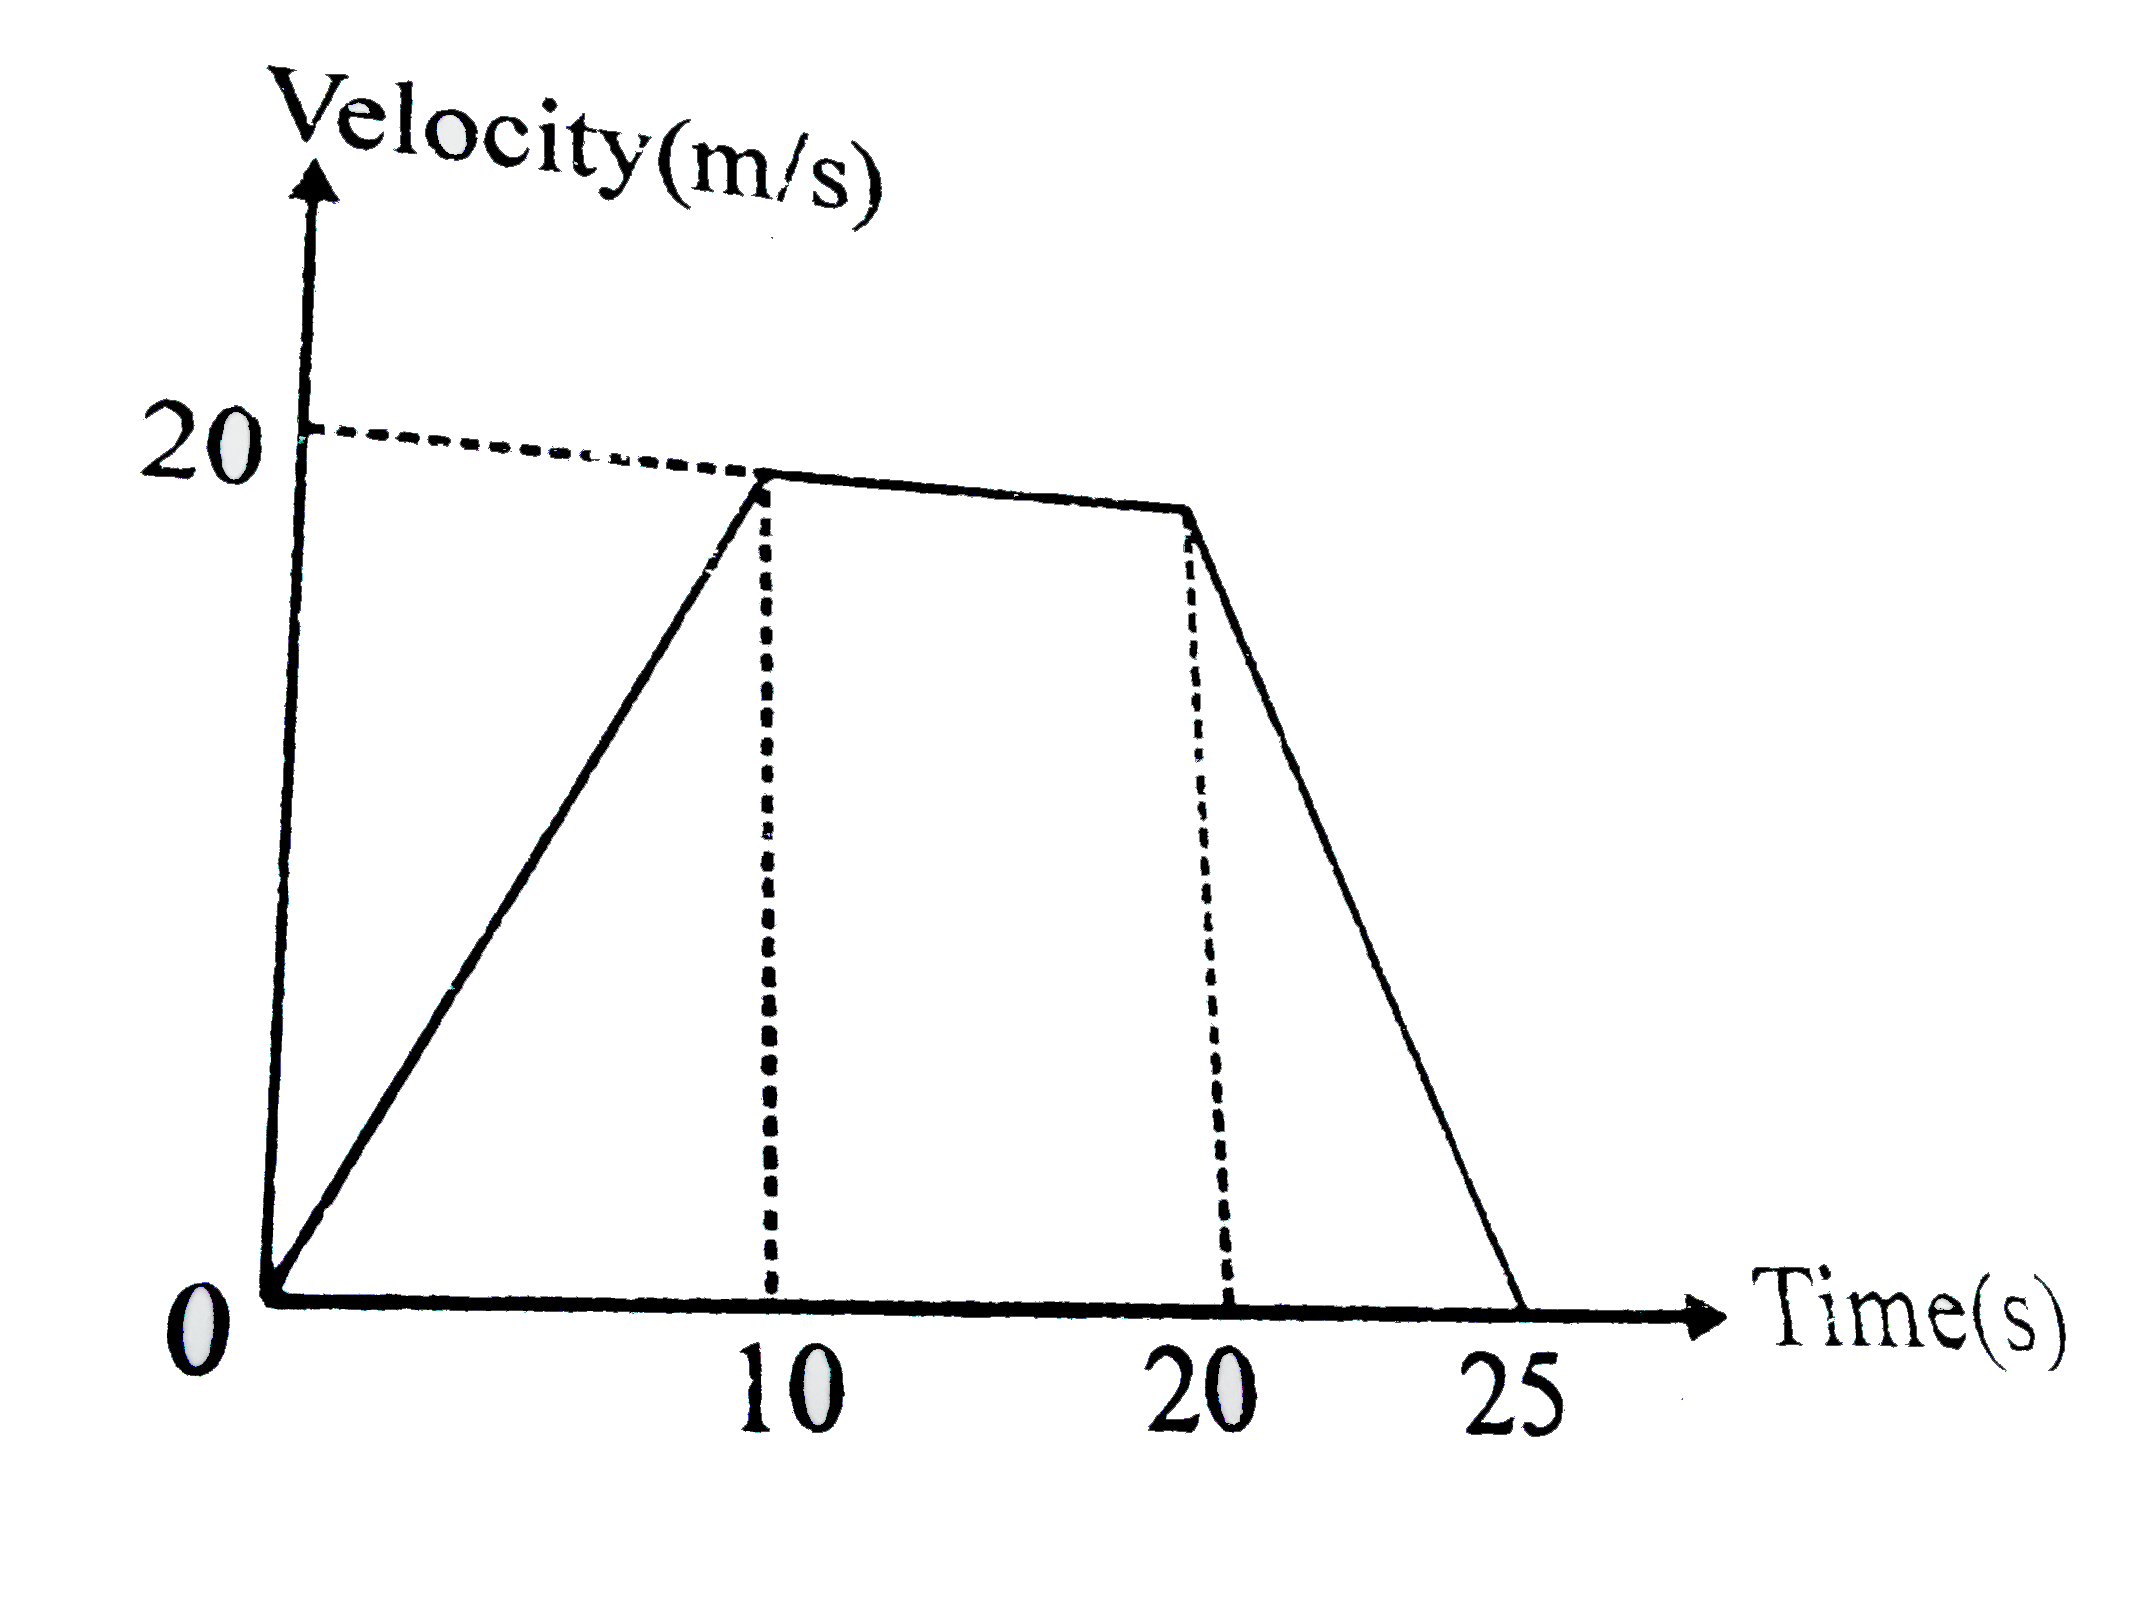
View SolutionThe velocity-time graph of a car moving along a straight road is shown in figure. The average velocity of the car in first 25 seconds is
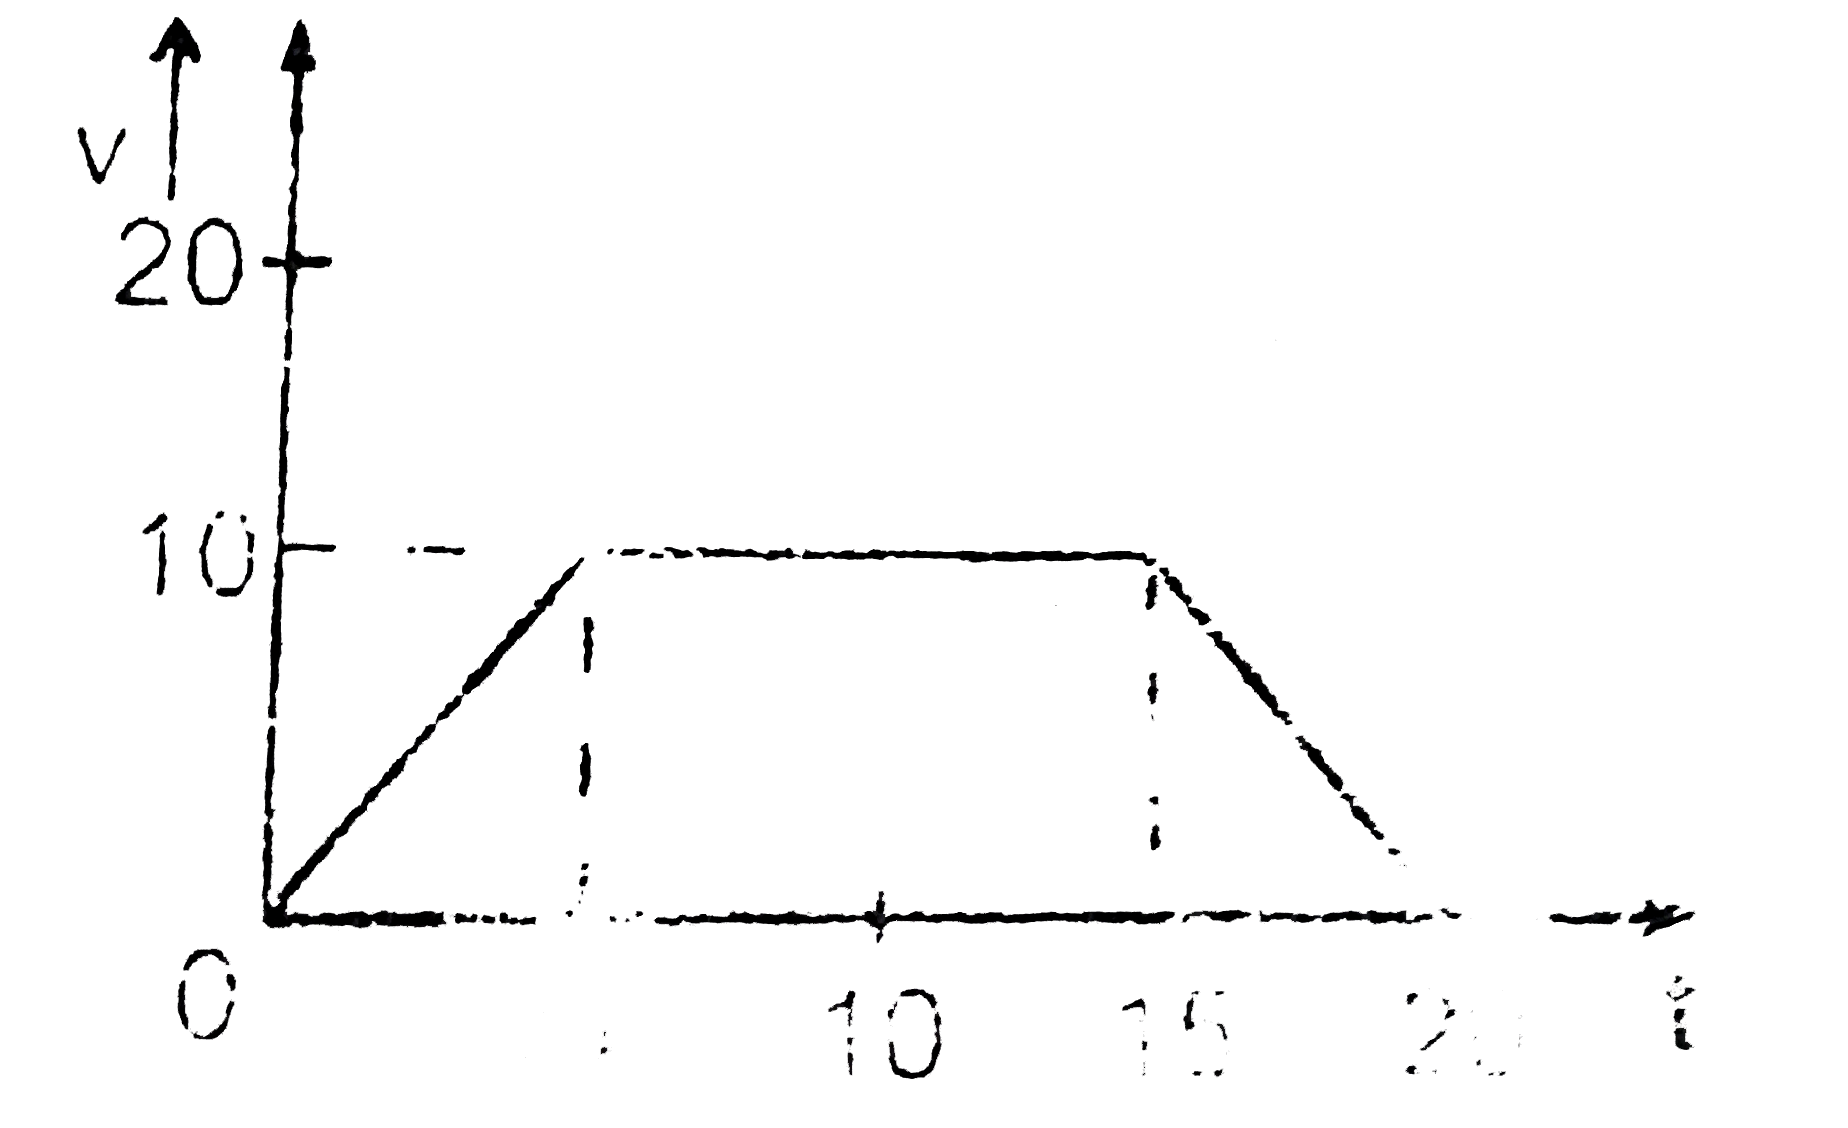
View SolutionFigure shows the velocity time graph of a particle moving along straight line (v is m/s and t is in second). It average velocity in 20 seconds will be:
 .
.
View SolutionThe velocity time graph of a body moving along a straight line is shown in figure. The ratio of the average velocities during the time t1 and t2 is.
View SolutionThe velocity (v) - time (t) graph for a particle moving along x - axis is shown in the figure. The corresponding position (x) - time (t) is best represented by
View Solution


