Pie chart shows the percentage distribution of total students appeared in six different shifts of an exam. Study the pie chart given below.and answer the following questions.
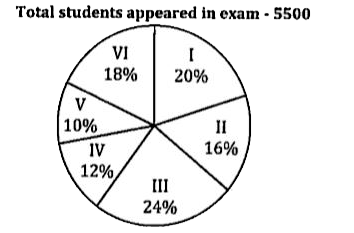
Find the central angle for students appeared in shift II of the examination.
64.2∘
48∘
57.6∘
43.6∘
The correct Answer is:C
Step by step video & image solution for Pie chart shows the percentage distribution of total students appeared in six different shifts of an exam. Study the pie chart given below.and answer the following questions. Find the central angle for students appeared in shift II of the examination. by Maths experts to help you in doubts & scoring excellent marks in Class 14 exams.
Updated on:21/07/2023Topper's Solved these Questions
Similar Questions
Study the pie-chart and answer the questions.
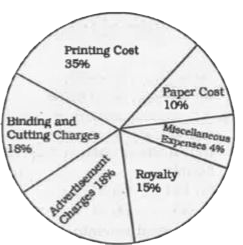
The central angle for the sector on "Paper-Cost" is
View SolutionThe following pie-chart shows the number of students who failed in different subjects in an examination. Examine the chart and answer the following questions. The total number of students who have failed is 500.
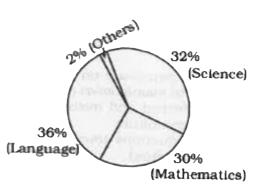
The central angle of the sector for the students who have failed in mathematics is :
View Solution
Knowledge Check
The following pie-chart shows the percentage distribution of the expenditure incurred in publishing a book. Study the pie-chart and answer the questions based on it.
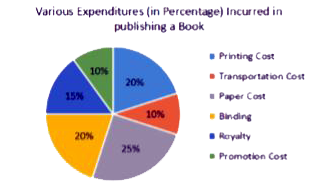
What is the central angle of the sector corresponding to the expenditure incurred on binding?A72∘B90∘C48∘D70∘The given pie chart shows the percentage distribution of 450 employees in an organisation. Study the pie chart and answer the question that follows
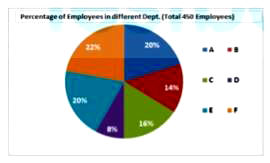
What is the central angle of the sector representing the number of employees in department A ?A72∘B108∘C90∘D36∘The given pie chart shows the percentage distribution of 450 employees in an organisation. Study the pie chart and answer the question that follows.
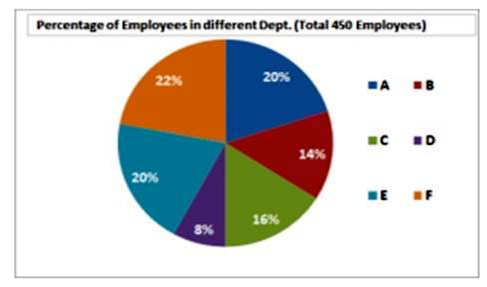
What is the number of employees working in departmetn B?A90B72C36D63
Direction :- The following pie-chart shows the number of students who failed in different subjects in an examination. Examine the chart and answer the following questions. The total number of students who have failed is 500.
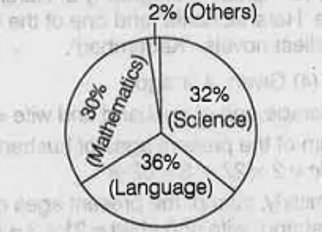
The number of students failed in Science is less than the number of student failed in all other subects by
View SolutionThe following pie-chart shows the number of students who failed in different subjects in an examination. Examine the chart and answer the following questions. The total number of students who have failed is 500.
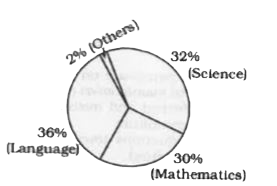
The number of students failed in science is less than the number of students failed in all other subjects by :
View SolutionStudy the Pie chart carefully and answer the questions.
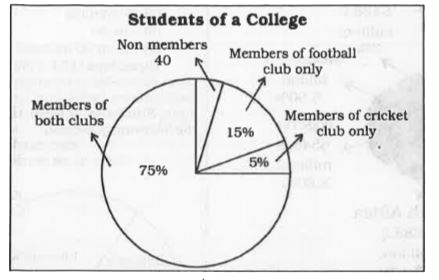
Percentage of students who are not members of any club is :
View SolutionThe following pie-chart shows the percentage distribution of the expenditure incurred in publishing a book. Study the pie-chart and answer the questions based on it.
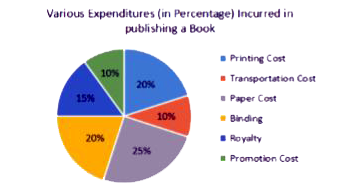
Royalty on the book is less than the paper cost by :
View SolutionThe following questions arfe based on the pie-chart given below. Study the pie-chart and answer the questions.
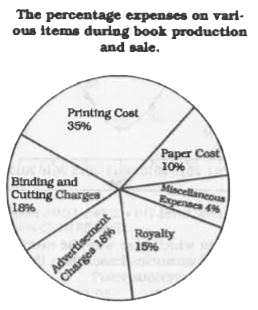
The central angle for the sector on ''Paper-Cost'' is
View Solution