Line graph given below shows number of passengers travelling in five (A, B, C, D & E) different compartment of a trains. Read the data carefully and answer the questions.
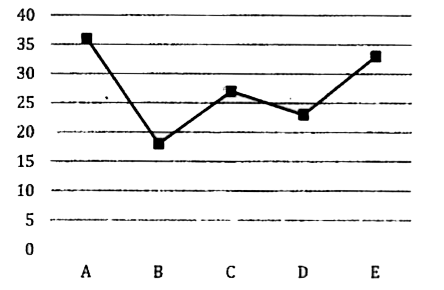
Find average number of passengers in A, C & E?
32
30
36
33
The correct Answer is:A
Step by step video & image solution for Line graph given below shows number of passengers travelling in five (A, B, C, D & E) different compartment of a trains. Read the data carefully and answer the questions. Find average number of passengers in A, C & E? by Maths experts to help you in doubts & scoring excellent marks in Class 14 exams.
Updated on:21/07/2023Topper's Solved these Questions
Similar Questions
Read the following graph carefully and answer the questions given below:
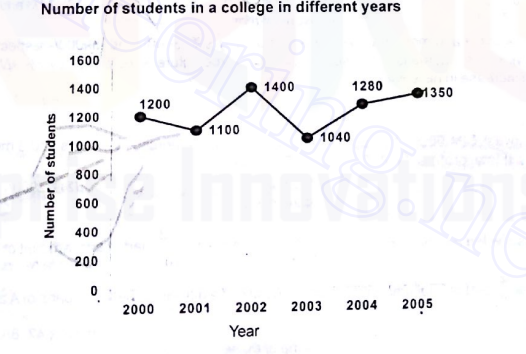
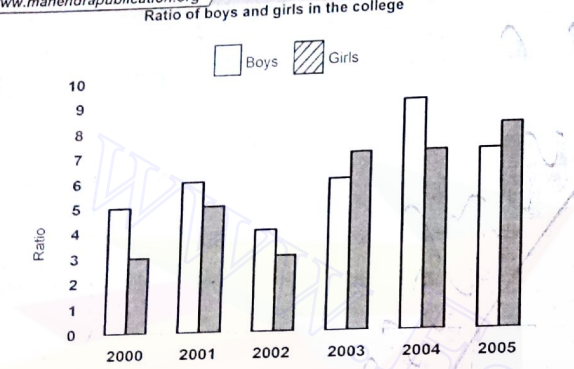
What is the average number of girls in all the years?
View SolutionBar graph given below shows pens sold by a retailor on five different days. Study the data carefully and answer the following questions.
Pen sold on different days
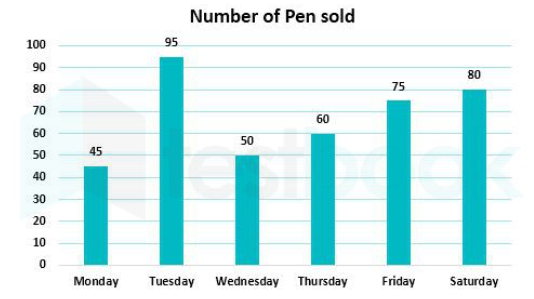
what is the average number of pens sold during a week if total number of pens sold on saturday is 25% more than total number of pens sold on Sunday .
View Solution
Knowledge Check
The bar graph shows the total number of male and female lives in four different towns and table shows the number of males and females whose ages are above 40 years. Read the data carefully and answer the questions below:
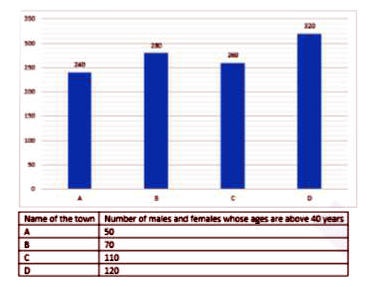
Find the average number of those males and females whose ages are below and equals to 40 years of town A, C and D.A180B160C190D200The following bar-diagram shows total number of males and females in five different organisations. Study it carefully to answer the questions.
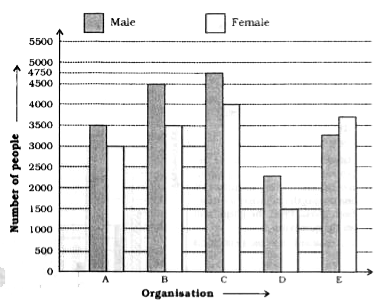
What is the ratio of average number of females from the organisations A, B and C to the average number of males from the organisations C, D and E?A42:41B41:42C40:41D41:40The given bar graph represents the number of boys and girls in five different schools. Read the graph and answer the question that follows.
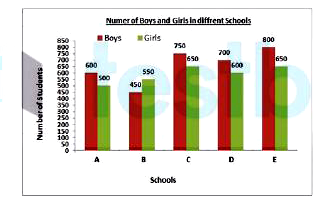
What is the average number of students (girls and boys) in schools A, B, C, D and E ?A596B1250C625D660
Directions: The following bar graph shows the number of pages in five different books (viz. A, B, C, D and E). Study the graph carefully and answer the following questions.
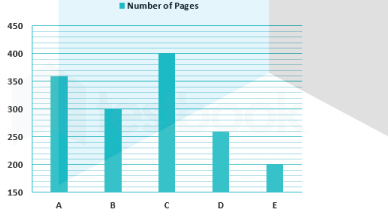
What is the ratio of total number of pages in book B and E together to the total number of pages in book C and D together?
View SolutionBar graph given below shows pens sold by a retailor on five different days. Study the data carefully and answer the following questions.
Pen sold on different days
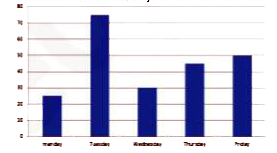
Find the difference between total number of pens sold on Monday and Tuesday together to total number of pens sold on Thursday and Friday together?
View SolutionRead the following graph carefully and answer the questions given below:


In which two years the number of girls is equal ?
View SolutionDirections: The following bar graph shows the number of pages in five different books (viz. A, B, C, D and E). Study the graph carefully and answer the following questions.
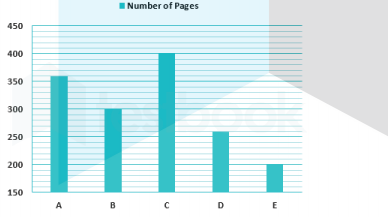
In book B, every even number page contains 75 words and the odd number pages contain 60 words. A person read the first 43 pages and stop reading and, on another day, read the last 216 pages. Find how many words remain unread.
View Solution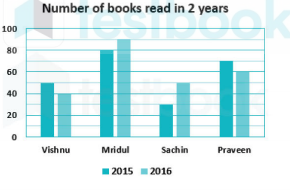
Directions: Read the bar graph carefully and answer the given questions.What is the average of total number of books read by all of them in the year 2016?
View Solution
