Study the table given below and answer the following questions.
Table gives information about total number of students in 3 different schools in 1999 & 2000 and also gives information about total number of girls in these 3 schools in 1999 & 2000.
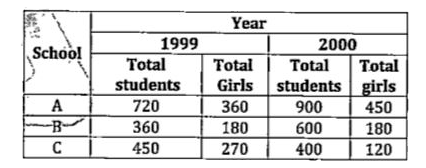
Number of girls in school - A & B together in 2000 are what percent more or less than total number of students in school - B & C together in 2000?
27%
42%
37%
30%
The correct Answer is:C
Step by step video & image solution for Study the table given below and answer the following questions. Table gives information about total number of students in 3 different schools in 1999 & 2000 and also gives information about total number of girls in these 3 schools in 1999 & 2000. Number of girls in school - A & B together in 2000 are what percent more or less than total number of students in school - B & C together in 2000? by Maths experts to help you in doubts & scoring excellent marks in Class 14 exams.
Updated on:21/07/2023Topper's Solved these Questions
Similar Questions
Knowledge Check
The total number of students in a school is 2140. If the number of girls in the school is 1200, then what is the ratio of the total number of boys to the total number of girls in the school ?
A26:25B47:60C18:13D31:79Direction: Study the graph and answer the following question.
The graph shows the total number of boys and girls in different classes of a school.
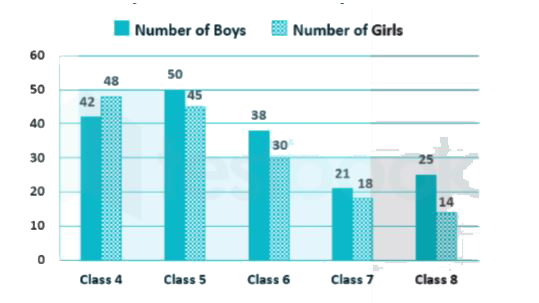
What is the total number of boys in these 5 classes together?A196B148C176D166Study the following graph carefully and answer the questions that follow
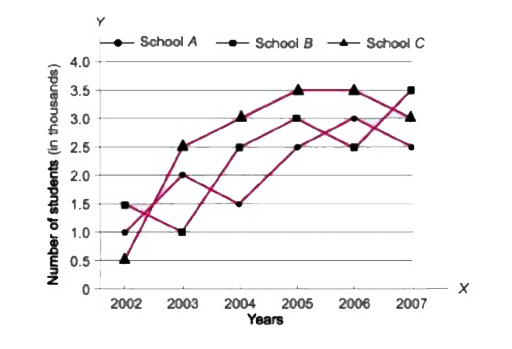
Total number of students in school B and school C together in the year 2004 was approximately what percent of the total number of students in school B and school C together in the year 2007 ?A85B80C75D184
Direction: Read the following table carefully and answer the questions given below: The given table shows the number of boys and girls in 5 different school:
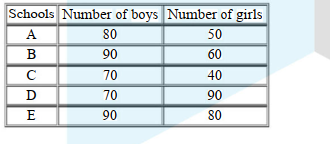
Find the total number of girls in school C and E together is how much percent more or less than the total number of students in school D
View SolutionIf 60% of students in a school are boys and the total number of girls in the school is 460, find the number of boys in the school.
View Solution60% students in a school are boys.Find the total number of students in the school if 120 are girls
View SolutionThe ratio of the number oif boys to that of girls in a school is 9:11. If the number of girls in the school is 2035, find:
a. number of boys is school.
b. number of students in school.
View SolutionDirection: Read the following table carefully and answer the questions given below:- The given the table is showing the number of students in different school:-
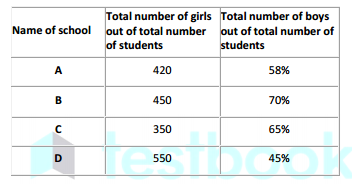
Find the ratio between the total number of boys in school D and the total number of girls in school A.
View Solution

