Pie chart shows the percentage distribution of total students appeared in six different shifts of an exam. Study the pie chart given below.and answer the following questions.
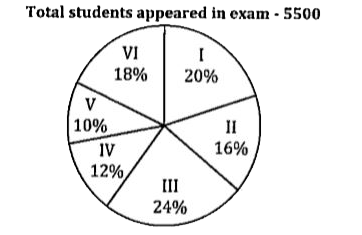
Find total number of students appeared in shift V & VI together of the examination.
1740
1600
1820
1540
The correct Answer is:D
Step by step video & image solution for Pie chart shows the percentage distribution of total students appeared in six different shifts of an exam. Study the pie chart given below.and answer the following questions. Find total number of students appeared in shift V & VI together of the examination. by Maths experts to help you in doubts & scoring excellent marks in Class 14 exams.
Updated on:21/07/2023Topper's Solved these Questions
Similar Questions
The following pie-chart shows the number of students who failed in different subjects in an examination. Examine the chart and answer the following questions. The total number of students who have failed is 500.
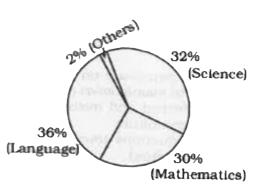
The central angle of the sector for the students who have failed in mathematics is :
View SolutionDirection :- The following pie-chart shows the number of students who failed in different subjects in an examination. Examine the chart and answer the following questions. The total number of students who have failed is 500.
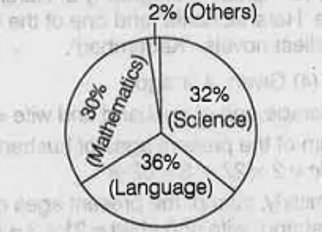
The number of students failed in Science is less than the number of student failed in all other subects by
View Solution
Knowledge Check
The given pie chart shows the percentage distribution of 450 employees in an organisation. Study the pie chart and answer the question that follows.
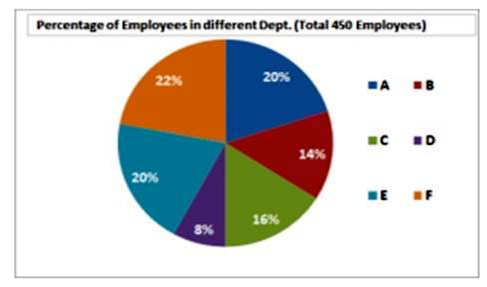
What is the number of employees working in departmetn B?A90B72C36D63The pie-chart shows percentage wise distribution of teachers who teach six different subjects. Study the pie chart and answer the question :
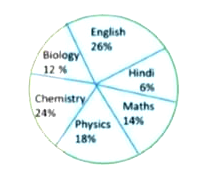
Total number of teachers =1650
What is the difference between the total number of teachers who teach Physics and Maths and the total number of teachers who tech chemistry and biology ?Aa) 60Bb) 76Cc) 66Dd) 68Study the Pie chart carefully and answer the questions.
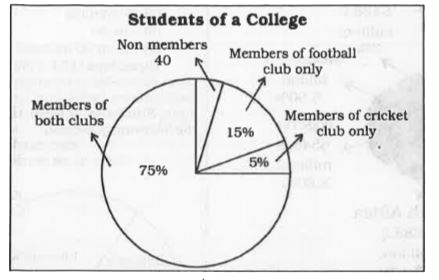
Percentage of students who are not members of any club is :A5%B8%C10%D6%
The following pie-chart shows the number of students who failed in different subjects in an examination. Examine the chart and answer the following questions. The total number of students who have failed is 500.
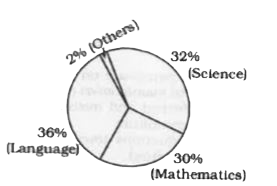
The number of students failed in science is less than the number of students failed in all other subjects by :
View SolutionThe pie chart shows percentage wise distribution of teachers who teach six different subjects. Study the pie chart and answer the question.
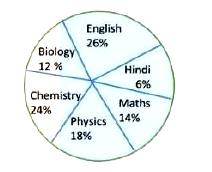
Total number of teachers = 1650
What is the difference between the total number of teachers who teach Physics and Maths and the total number of teachers who teach chemistry and biology?
View SolutionThe pie-chart shows percentage wise distribution of teachers who teach six different subjects. Study the pie chart and answer the question:
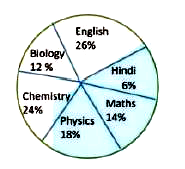
Total number of teachers = 1650
What is the total number of teachers teaching English. Maths and Physics?
View SolutionDirections: The given pie-charts compares the total population and the female population of six countries, Australia, Canada, Germany, India, USA and Philippines. The first pie chart gives the percentage distribution of the total population of the six countries, while, the second pie chart gives the percentage distribution of the female population of the six countries. Study the pie-charts and answer the questions that follow.
If the total number of females in India and USA is equal to the total population of the Philippines, then what is the ratio of the number of males in Australia to the number of females in Canada?
View SolutionThe following pie-chart shows the percentage-wise distribution of the number of students in five different schools P, Q, R, S and T. The total number of students in all five schools together is 8400.
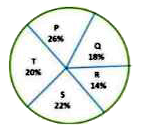
Find the average number of students in schools R and S together.
View Solution
