Study the following graph and answer the given questions
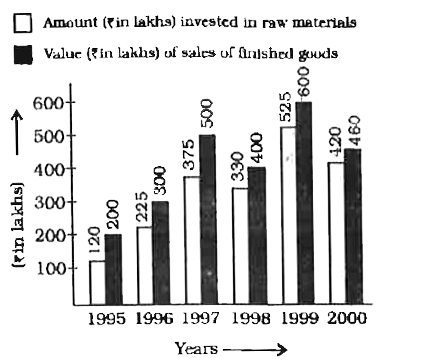
What was the difference between the average amount invested in raw materials during the given period and the average value of sales of finished goods during this period ?
Rs 62.5 lakhs
Rs 68.5 lakhs
Rs 71.5 lakhs
Rs 77.5 lakhs
The correct Answer is:D
Step by step video, text & image solution for Study the following graph and answer the given questions What was the difference between the average amount invested in raw materials during the given period and the average value of sales of finished goods during this period ? by Maths experts to help you in doubts & scoring excellent marks in Class 14 exams.
Updated on:21/07/2023Topper's Solved these Questions
- STATISTICS AND DATA INTERPRETATIONBOOK - KIRAN PUBLICATIONCHAPTER - STATISTICS AND DATA INTERPRETATIONEXERCISE - TYPE-V
38 Videos
- STATISTICS AND DATA INTERPRETATIONBOOK - KIRAN PUBLICATIONCHAPTER - STATISTICS AND DATA INTERPRETATIONEXERCISE - TYPE-VI
86 Videos
- STATISTICS AND DATA INTERPRETATIONBOOK - KIRAN PUBLICATIONCHAPTER - STATISTICS AND DATA INTERPRETATIONEXERCISE - TYPE-III
39 Videos
- SIMPLIFICATIONBOOK - KIRAN PUBLICATIONCHAPTER - SIMPLIFICATIONEXERCISE - TEST YOURSELF
25 Videos
- TIME AND DISTANCEBOOK - KIRAN PUBLICATIONCHAPTER - TIME AND DISTANCEEXERCISE - Type -XI
74 Videos
Similar Questions
Out of the bar graphs provided below one shows the amount invested a company in purchasing raw material over the year and the other shows the values of finished goods sold by the company over the years
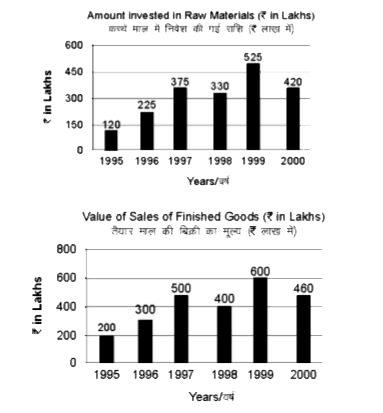
what was the difference between the average amount invested in raw materials during 1997 to 2000 and the average value of sales of finished goods during the same period 1997 to 2000
View SolutionWhat was the difference between the average amount invested in raw materials during the given period and the average value of sales of finished goods during this period? (a) 62.5 lakhs (b) Rs 68.5 lakhs (c) Rs 71.5 lakhs (d) Rs 77.5 lakhs (e) Rs 83.5 lakhs
View Solution
Knowledge Check
Study the following graph and answer the given questions

What was the difference between the average amount invested in raw materials during the given period and the average value of sales of finished goods during this period ?ARs 62.5 lakhsBRs 68.5 lakhsCRs 71.5 lakhsDRs 77.5 lakhsStudy the following line graph and answer the questions.
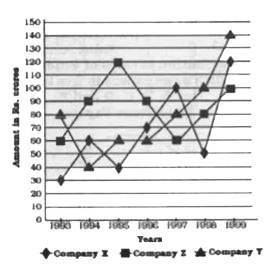
What was the difference between the average exports of all three companies in 1994 and 1995 ?ARs. 5 croresBRs. 20 croresCRs. 10 croresDRs. 30 croresStudy the following graph carefully and answer the question given below-----
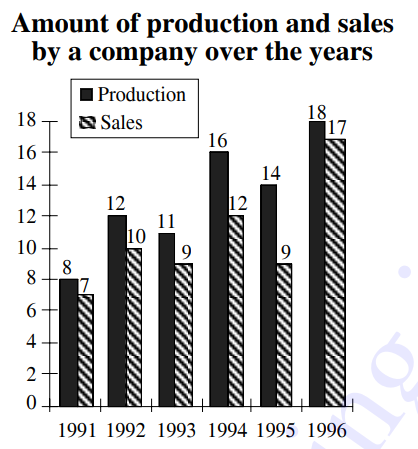
What was the difference between the sales of 1992 and 1995 ?A10 lakh tonnesB50 thousand tonnesC1 lakh tonnesD75 thousand tonnes
Study the following graph and answer the given questions:
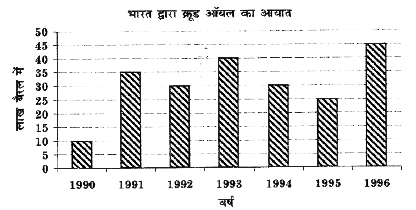
In how many years were the imports higher than the average value of imports?
View SolutionThe maximum difference between the amount invested in raw materials and the value of sales of finished goods was during the year (a) 2005 (b) 2006 (c) 2007 (d) 2008 (e) 2009
View SolutionStudy the following graph carefully and answer the questions -----
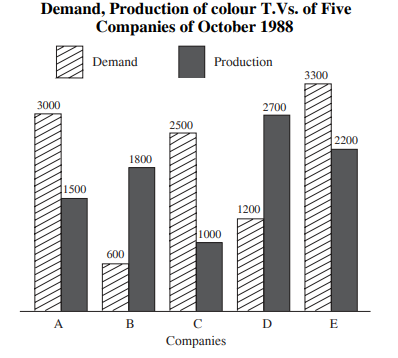
What is the difference between average demand and average production of the five companies taken together ?
View SolutionStudy the following graph carefully and answer given below ------
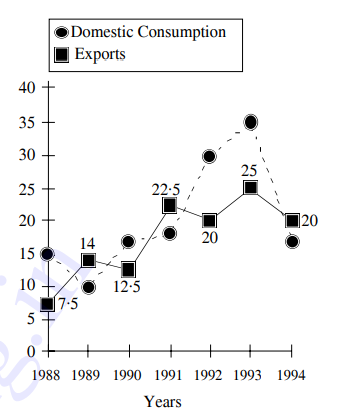
What was the difference between the average domestic consumption and the average exports of the given years ?
View SolutionStudy the following graph carefully and answer the questions that
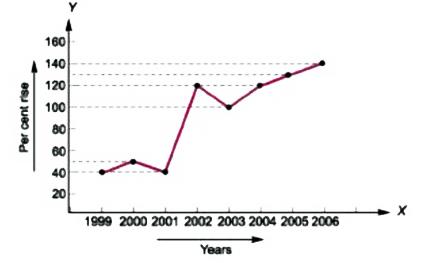
What was the average of percent rise over the given years ?
View Solution
