Study the following graph and answer the given questions:
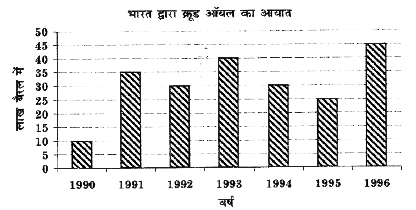
In how many years were the imports higher than the average value of imports?
4
1
2
3
The correct Answer is:D
औसत आयात = 10+35+30+40+30+25+457
=2157>30 लाख बैरल
ग्राफ से स्पष्ट है कि तीन बार (1991, 1993, 1996) में आयात औसत आयात से अधिक रहा।
Similar Questions
Study the graph and answer the question
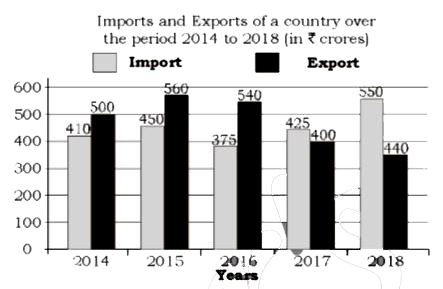
In how many years were the exports of the country more than the average imports during the given yearView SolutionStudy the graph and answer the question
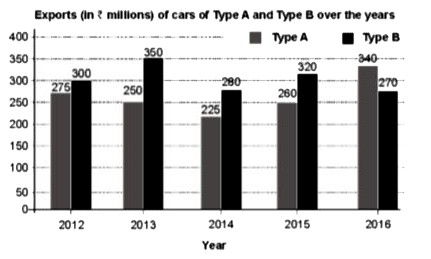
In how many years were the exports of type B cars more than the average exports of type A cars during 2012 to 2016View Solution
Knowledge Check
- Question 1 - Select One
Study the following graph carefully and answer the questions that
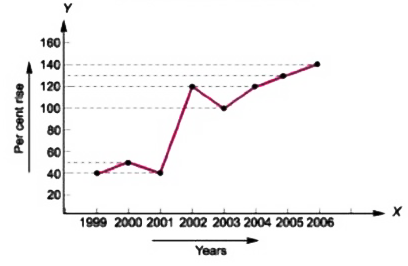
For how many years , the percent rise was lower than the average of the percent rise over the given years ?ATwoBOneCThreeDFive - Question 2 - Select One
Study the following graph carefully and answer the questions given below it -----
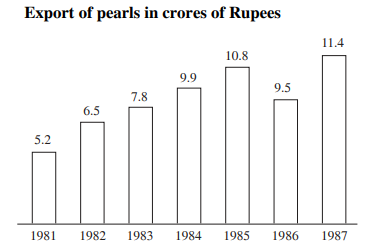
In how many years was the export above the average for the given period ?A2B3C4D5 - Question 3 - Select One
Study the following graph and answer questions
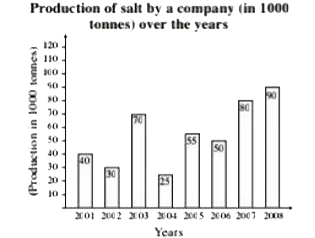
In how many of the given years was the production of salt more than the average production of the given years?A1B2C3D4
Study the graph and answer the question.
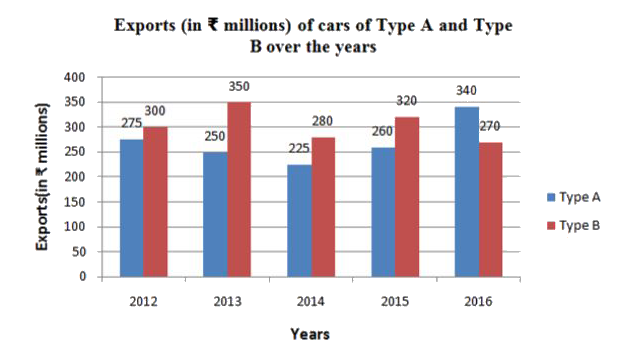
In how many years were the exports of type B cars more than the average exports of type A cars during 2012 to 2016?View SolutionStudy the bar graph and answer the question
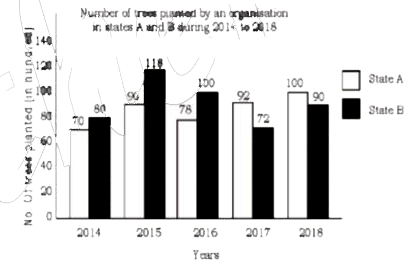
In how many years was the number of trees planted in state B more than the average number of trees planted in state A over the yearsView SolutionStudy the following graph carefully and answer the questions that
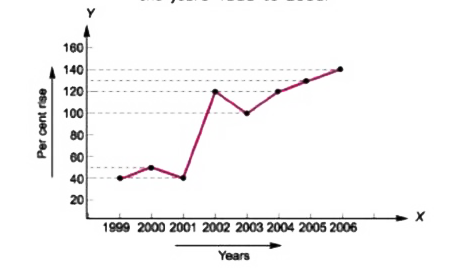
For how many years , the percent rise was more than 100 % ?View SolutionStudy the bar graph and answer the question.
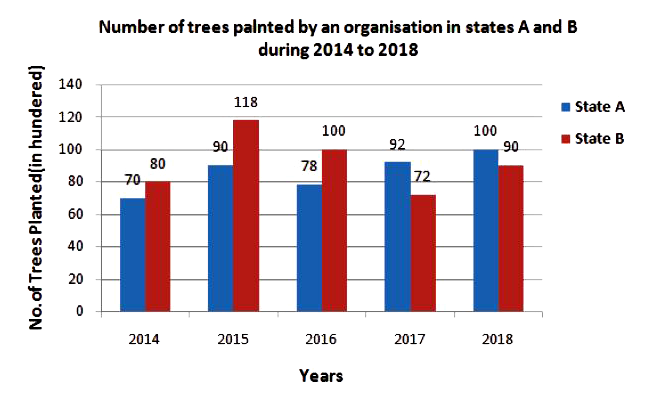
In how many years was the number of trees planted in state B more than the average number of trees planted in state A over the years ?View SolutionStudy the following graph carefully and answer the questions given below it -----
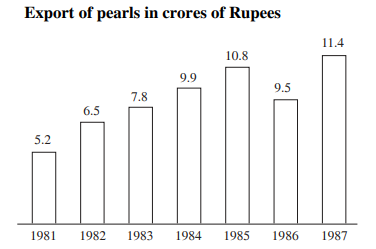
In which year was the export equal to the average export of the preceding and the following year ?View Solution
