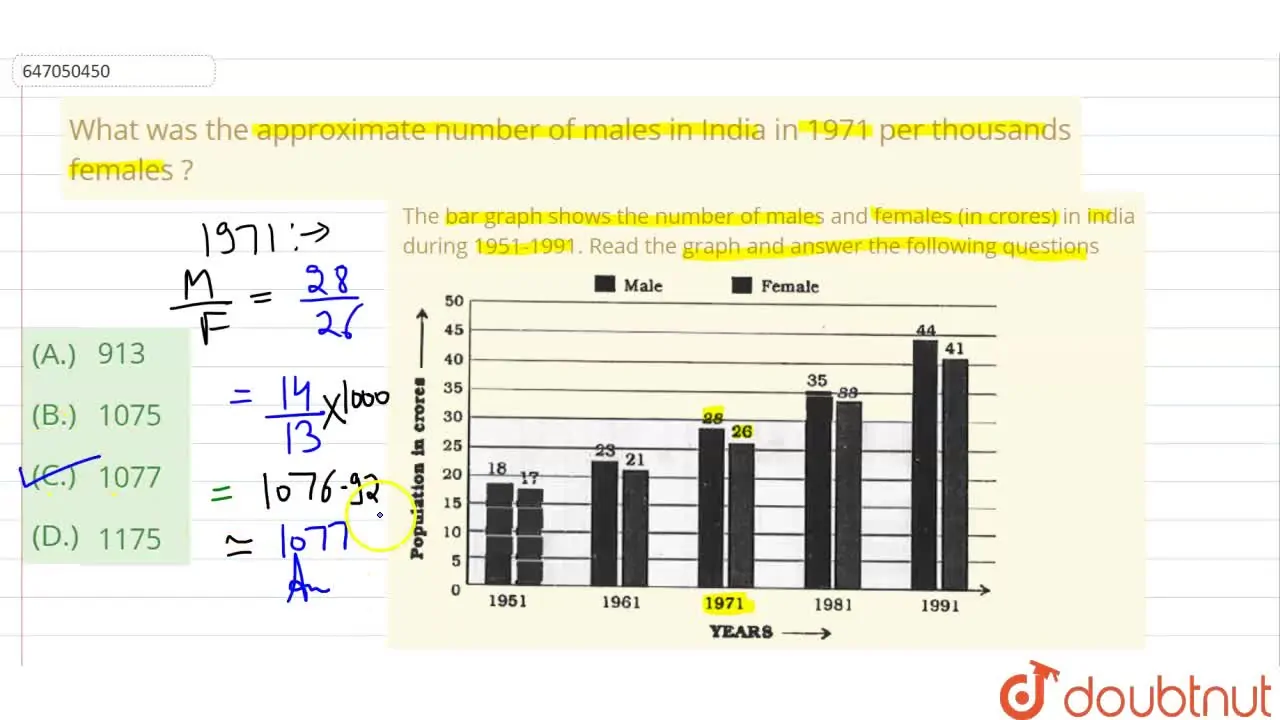
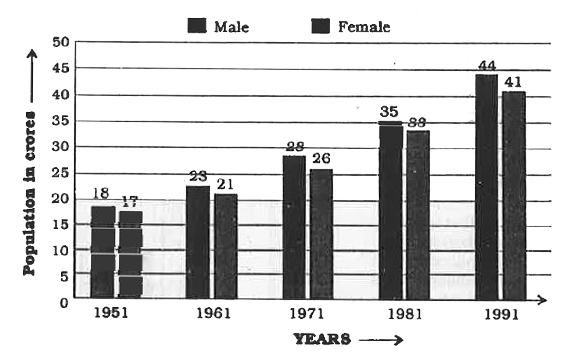
The bar graph shows the number of males and females (in crores) in india during 1951-1991. Read the graph and answer the following questions
What was the approximate number of males in India in 1971 per thousands females ?
913
1075
1077
1175
The correct Answer is:C
Step by step video, text & image solution for The bar graph shows the number of males and females (in crores) in india during 1951-1991. Read the graph and answer the following questions What was the approximate number of males in India in 1971 per thousands females ? by Maths experts to help you in doubts & scoring excellent marks in Class 14 exams.
Related Playlists
- BOOK - KIRAN PUBLICATIONCHAPTER - STATISTICS AND DATA INTERPRETATIONEXERCISE - TYPE-V38videos
STATISTICS AND DATA INTERPRETATION
- BOOK - KIRAN PUBLICATIONCHAPTER - STATISTICS AND DATA INTERPRETATIONEXERCISE - TYPE-VI86videos
STATISTICS AND DATA INTERPRETATION
- BOOK - KIRAN PUBLICATIONCHAPTER - STATISTICS AND DATA INTERPRETATIONEXERCISE - TYPE-III39videos
STATISTICS AND DATA INTERPRETATION
- BOOK - KIRAN PUBLICATIONCHAPTER - SIMPLIFICATIONEXERCISE - TEST YOURSELF25videos
SIMPLIFICATION
- BOOK - KIRAN PUBLICATIONCHAPTER - TIME AND DISTANCEEXERCISE - Type -XI74videos
TIME AND DISTANCE
Similar Questions
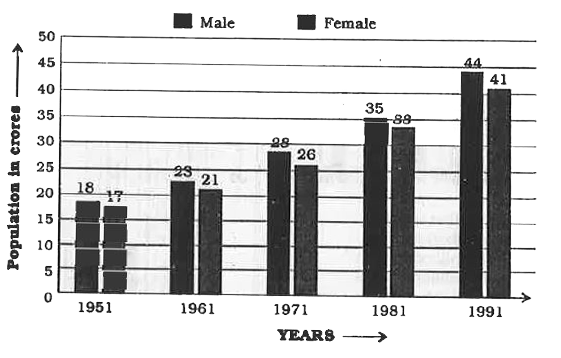
The bar graph shows the number of males and females (in crores) in india during 1951-1991. Read the graph and answer the following questions
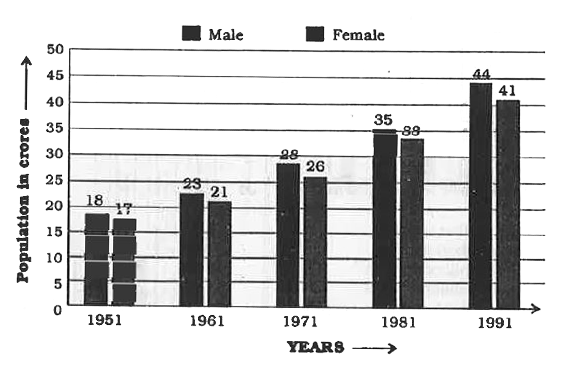
What is the ratio of the number of females in India in 1961 per thousand males to the number of males in India in 1991 per thousand females?View SolutionThe bar graph shows the number of males and females (in crores) in india during 1951-1991. Read the graph and answer the following questions
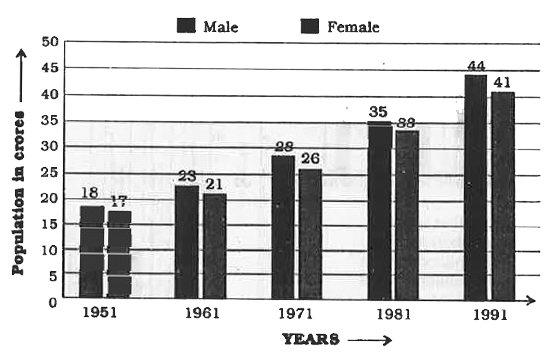
What was the approximate percentage of female population of female population in India during 1991 ?View SolutionThe bar graph shows the number of males and females (in crores) in india during 1951-1991. Read the graph and answer the following questions
Assuming that the rate of increase in the total population in India during 1991-2001 remains the same as that was during the period 1981-1991, extimate the total population in India in 2001.View SolutionRead the graph and answer the following questions
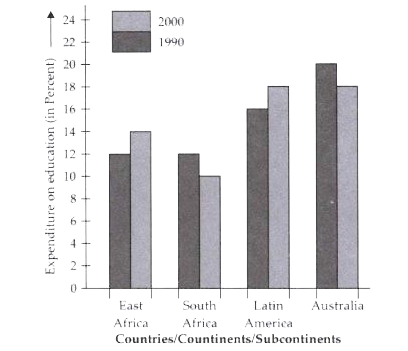
Give a suitable title to bar graphView SolutionNumber of females/ males in India
View SolutionRead the graph and answer the following questions
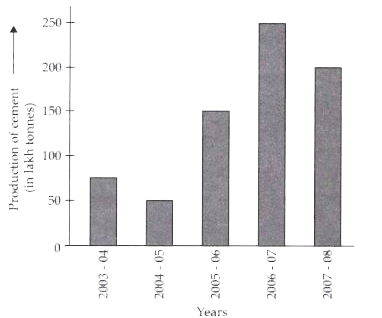
What information is conveyed by the bar graphView SolutionRead the bar graph and answer the following questons.
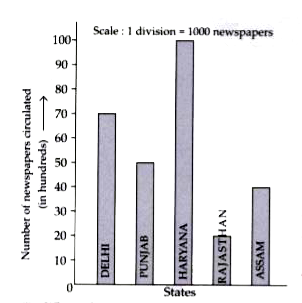
What information is given by graph ?View SolutionRead the bar graph shown in figure and answer the following questions.
What is the information given by the bar graph?
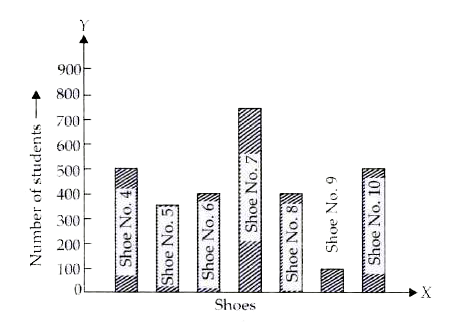 View Solution
Answer the following questions by looking at the graph:
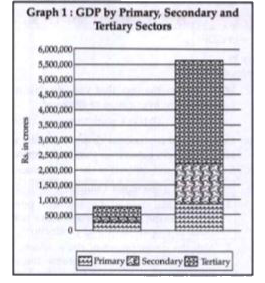
What was the GDP of India in 2013–14?View SolutionRead the bar graph shown in figure and answer the following questions.
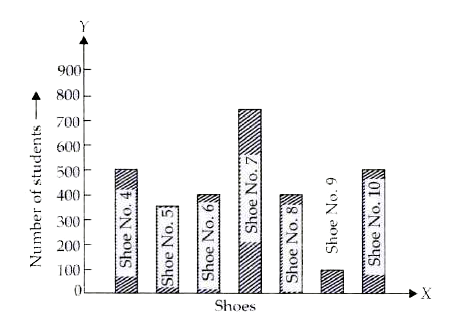
What are the different numbers of the shoesworn by the students?View Solution

