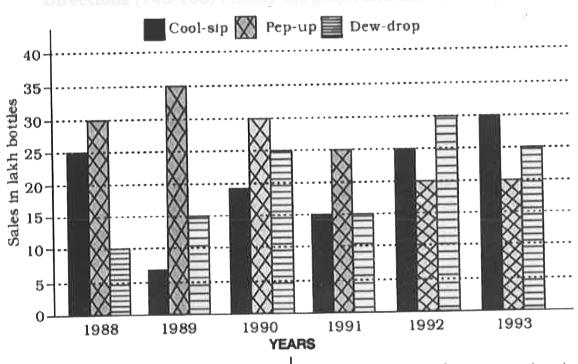
Study the graph and answer the questions.
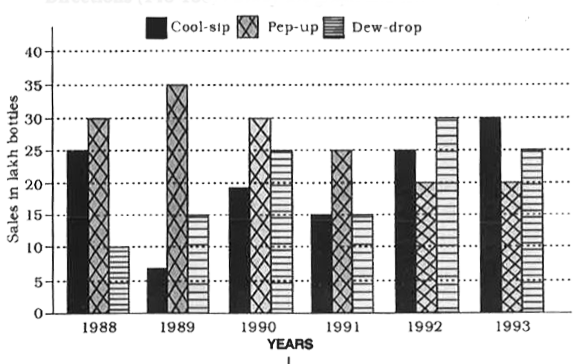
What was the approximater percent drop in the sale of Prep-up in 1990 over its sale in 1989 ?
5
14
12
20
The correct Answer is:B
Step by step video, text & image solution for Study the graph and answer the questions. What was the approximater percent drop in the sale of Prep-up in 1990 over its sale in 1989 ? by Maths experts to help you in doubts & scoring excellent marks in Class 14 exams.
Updated on:21/07/2023Topper's Solved these Questions
- STATISTICS AND DATA INTERPRETATIONBOOK - KIRAN PUBLICATIONCHAPTER - STATISTICS AND DATA INTERPRETATIONEXERCISE - TYPE-V
38 Videos
- STATISTICS AND DATA INTERPRETATIONBOOK - KIRAN PUBLICATIONCHAPTER - STATISTICS AND DATA INTERPRETATIONEXERCISE - TYPE-VI
86 Videos
- STATISTICS AND DATA INTERPRETATIONBOOK - KIRAN PUBLICATIONCHAPTER - STATISTICS AND DATA INTERPRETATIONEXERCISE - TYPE-III
39 Videos
- SIMPLIFICATIONBOOK - KIRAN PUBLICATIONCHAPTER - SIMPLIFICATIONEXERCISE - TEST YOURSELF
25 Videos
- TIME AND DISTANCEBOOK - KIRAN PUBLICATIONCHAPTER - TIME AND DISTANCEEXERCISE - Type -XI
74 Videos
Similar Questions
Knowledge Check
Study the graph and answer the questions.

What was the approximater percent drop in the sale of Prep-up in 1990 over its sale in 1989 ?A5B14C12D20Study the graph and answer the questions.
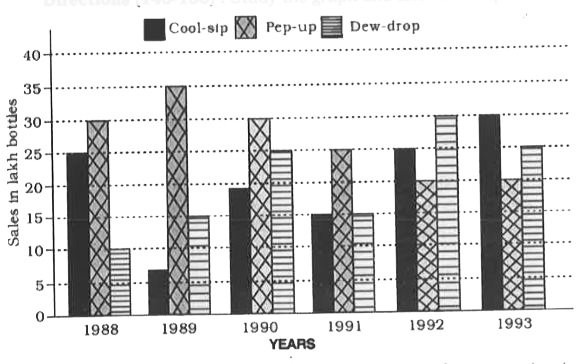
What was the approximate percent increase in sales of Cool - sip in 1990 over its sales in 1989 ? iA100B50C171D150Study the graph and answer the questions.
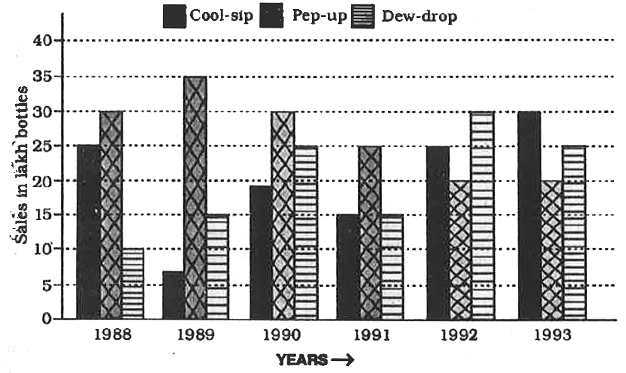
In which year sale of Drew-drop is maximum ?A1998B1992C1989D1993
Study the graph and answer the questions.
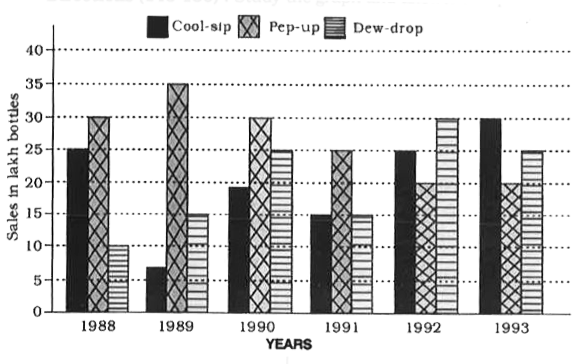
In which year the sale of coolsip is minimum?
View SolutionStudy the graph and answer the questions.
ग्राफ का अध्ययन कीजिए और दिये गये प्रश्नों के उत्तर दीजिए:
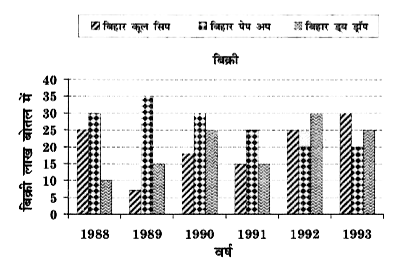
What was the approximate percent increase in sales of Cool-sip in 1990 over its sales in 1989 ?
कूल-सिंप की 1989 में बिक्री की तुलना में 1990 में बिक्री में लगभग कितने प्रतिशत की बढ़ोतरी हुई?
View SolutionStudy the graph and answer the questions.
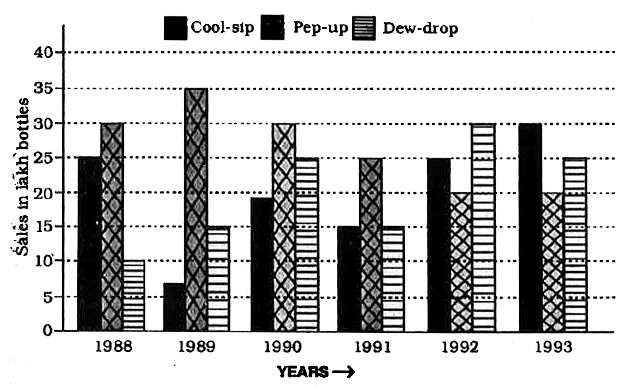
In which year the sale of cool-sip is minimum ?
View SolutionStudy the following graph carefully and answer the questions that
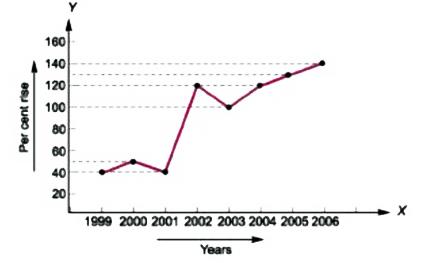
What was the average of percent rise over the given years ?
View SolutionStudy the following graph carefully and answer the question given below-----
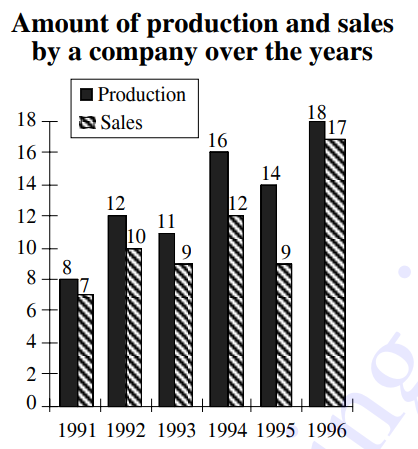
What was the percentage drop in sales from 1992 to 1993 ?
View Solution

