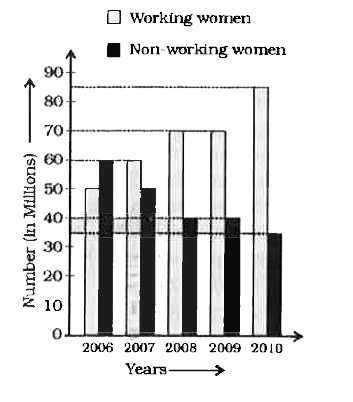
Study the following multiple bar graph carefully and answer the questions.
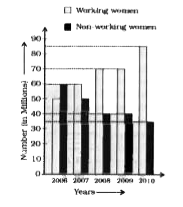
What is the ratio of number of working women to the non-working women in the year 2009 ?
(a) 7:4
(b) 4:7
(c) 2:3
(d) 3:2
The correct Answer is:A
Step by step video, text & image solution for Study the following multiple bar graph carefully and answer the questions. What is the ratio of number of working women to the non-working women in the year 2009 ? by Maths experts to help you in doubts & scoring excellent marks in Class 14 exams.
Updated on:21/07/2023Topper's Solved these Questions
- STATISTICS AND DATA INTERPRETATIONBOOK - KIRAN PUBLICATIONCHAPTER - STATISTICS AND DATA INTERPRETATIONEXERCISE - TYPE-V
38 Videos
- STATISTICS AND DATA INTERPRETATIONBOOK - KIRAN PUBLICATIONCHAPTER - STATISTICS AND DATA INTERPRETATIONEXERCISE - TYPE-VI
86 Videos
- STATISTICS AND DATA INTERPRETATIONBOOK - KIRAN PUBLICATIONCHAPTER - STATISTICS AND DATA INTERPRETATIONEXERCISE - TYPE-III
39 Videos
- SIMPLIFICATIONBOOK - KIRAN PUBLICATIONCHAPTER - SIMPLIFICATIONEXERCISE - TEST YOURSELF
25 Videos
- TIME AND DISTANCEBOOK - KIRAN PUBLICATIONCHAPTER - TIME AND DISTANCEEXERCISE - Type -XI
74 Videos
Similar Questions
Knowledge Check
Study the following multiple bar graph carefully and answer the questions.
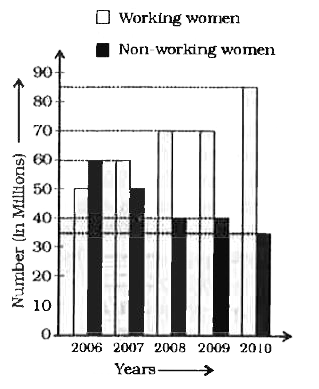
What is the ratio of the number of women working in the year 2006 to the number of women working in the year 2010 ?A5:17B17:5C17:10D10:17Study the following multiple bar graph carefully and answer the questions.

In which year was the difference between the number of working and non-working women the highest?A2007B2008C2009D2010Study the following multiple bar graph carefully and answer the questions.
In which year or years, the difference between the number of working and non-working women the lowest ?A2006 and 2007B2007 and 2008COnly 2006DOnly 2007
Read the following graph carefully and answer the questions given below:
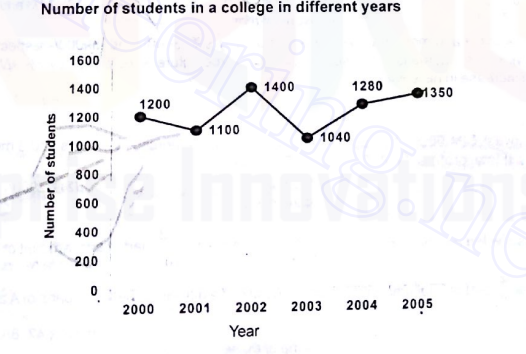
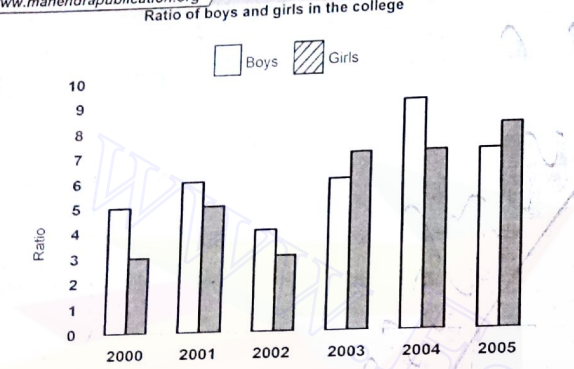
What is the respective ratio of number of boys in the year 2003 and that of girls in the year 2005 ?
View SolutionStudy the following multiple bar graph carefully and answer the questions.
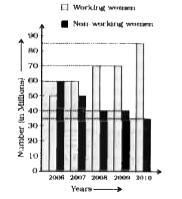
The number of non-working women in the year 2010 was approxiamtely (correct up to an integer) what per cent of total number of working as well as non-working women in that year ?
View SolutionStudy the following graph carefully and answer the questions that
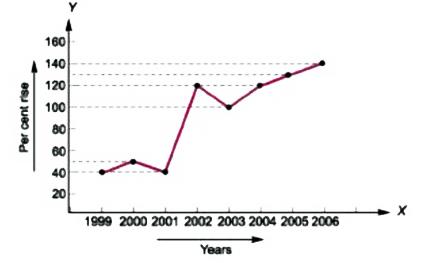
What was the average of percent rise over the given years ?
View SolutionStudy the following bar graph and answer the question that follows.
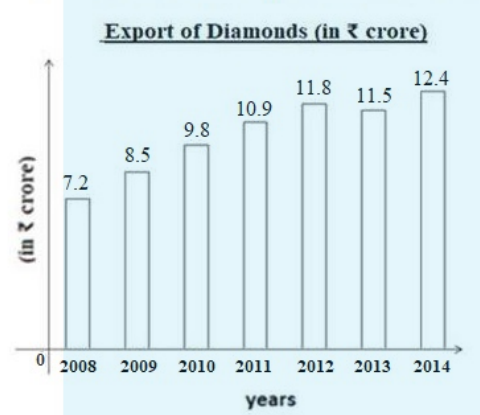
In which year was the maximin percentage increase in diamonds exports compared to the previous year?
View SolutionStudy the following graph carefully and answer the questions that follow
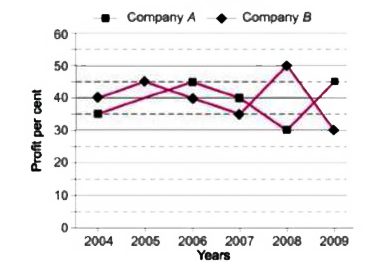
What is the respective ratio of the amount of profit earned by companies A and B in the year 2009 ?
View Solution

