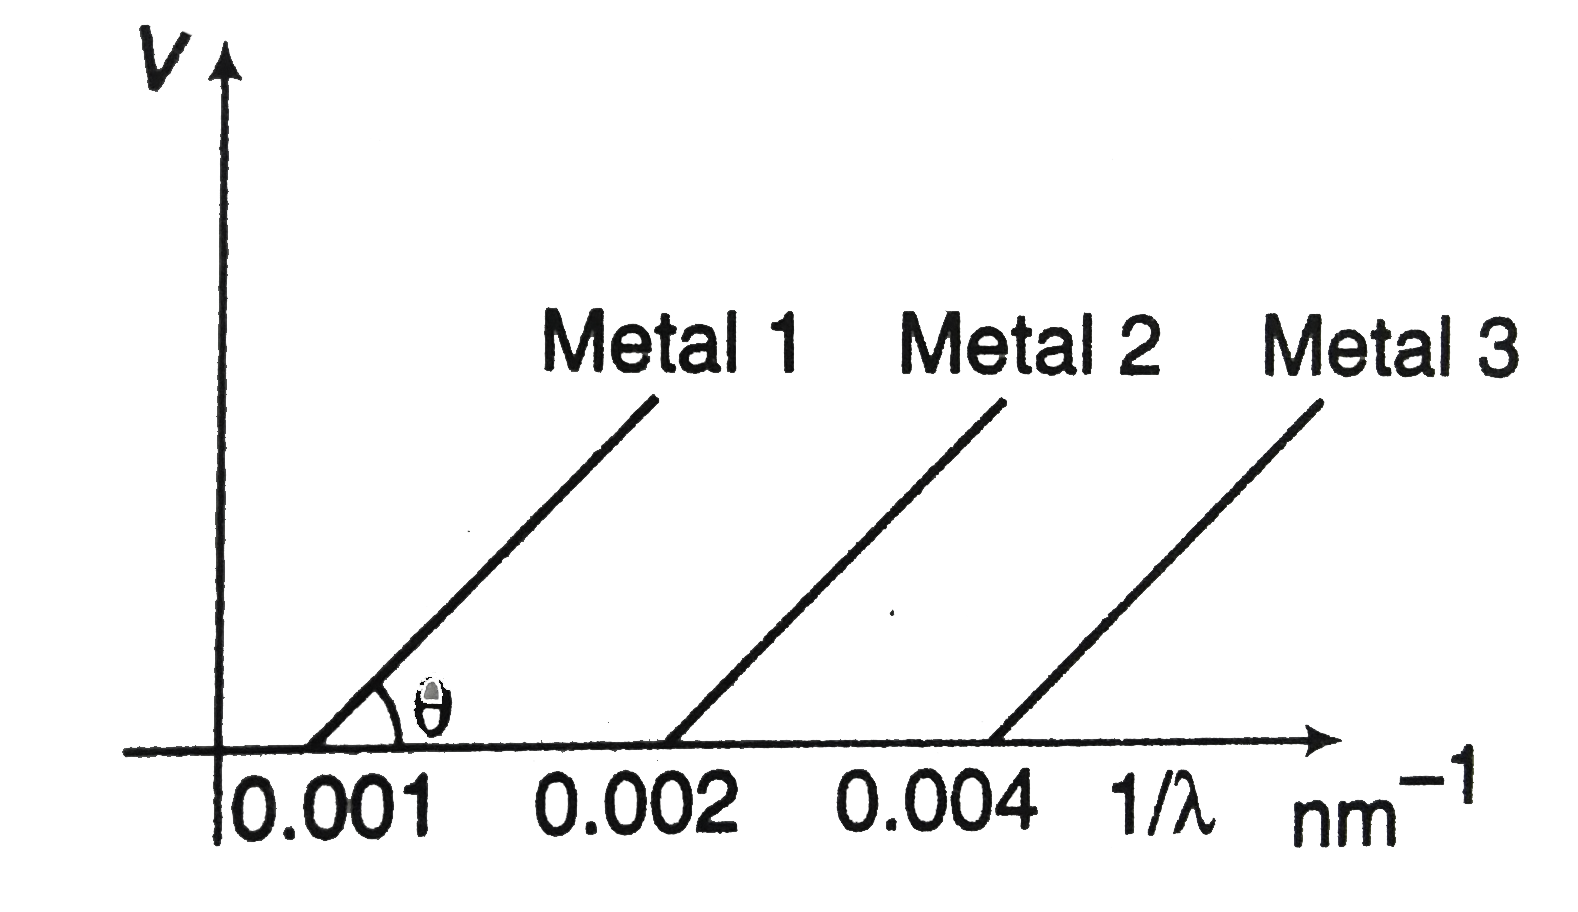
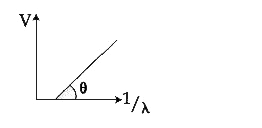
The graph between and stopping potential of three metals having work functions and , in an experiment of photo-electric effect is plotted as shown in the figure. Which of the following statements (s) isare correct?[ Here is the wavelength of the incident ray].
![The graph between 1//lambda and stopping potential (V) of three metals having work functions phi(1),phi(2) and phi(3), in an experiment of photo-electric effect is plotted as shown in the figure. Which of the following statements (s) is//are correct?[ Here lambda is the wavelength of the incident ray].](https://d10lpgp6xz60nq.cloudfront.net/physics_images/RES_MOD_PHY_XII_C01_E01_144_Q01.png)
Ratio of work functions
Ratio of work functions
is directly proportional to , where h is Planck's constant and c is the speed of light can eject photoelectrons from metals 2 and 3.
The vilolet colour light can eject photoelectron from metals 2 and 3.
The correct Answer is:A, C
From the relation,
This is equation of straight line.
Slope is
Violet colour has wavelength .
So violet colour can eject photoelectrons from metal-1 and metal -2.
Topper's Solved these Questions
- SIMPLE HARMONIC MOTIONBOOK - ALLENCHAPTER - SIMPLE HARMONIC MOTIONEXERCISE - Comprehension #1
3 Videos
- SIMPLE HARMONIC MOTIONBOOK - ALLENCHAPTER - SIMPLE HARMONIC MOTIONEXERCISE - Comprehension #2
3 Videos
- SIMPLE HARMONIC MOTIONBOOK - ALLENCHAPTER - SIMPLE HARMONIC MOTIONEXERCISE - Exercise-05(B)
46 Videos
- RACEBOOK - ALLENCHAPTER - RACEEXERCISE - Basic Maths (Wave Motion & Dopplers Effect) (Stationary waves & doppler effect, beats)
24 Videos
- TEST PAPERBOOK - ALLENCHAPTER - TEST PAPEREXERCISE - PHYSICS
4 Videos
Similar Questions
The graph between 1/λ and stopping potential (V) of three metals having work- functions Φ1, Φ2 and Φ3 in an experiment of photoelectric effect is plotted as shown in the figure. Which of the following statement(s) is/are correct? (Here, λ is the wavelength of the incident ray).
View SolutionThe graph between 1λ and stopping potential V0 of two metals having work funcation ϕ1 and ϕ2 in an experiment of photoelectric effect is obtained as shown in the figure. Find out -
_E01_164_Q01.png)
(i) Threshold wavelength ofboth metals
(ii) ϕ1:ϕ2
(iii) Whihc metal cen emit photoelectrons with visible light ?
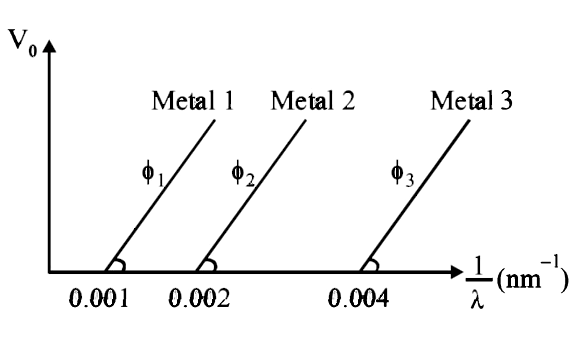
View SolutionThe graph between the stopping potential (V0)and(1λ) is shown in the figure ϕ1,ϕ2andϕ3 are work function , which of the following is /are correct
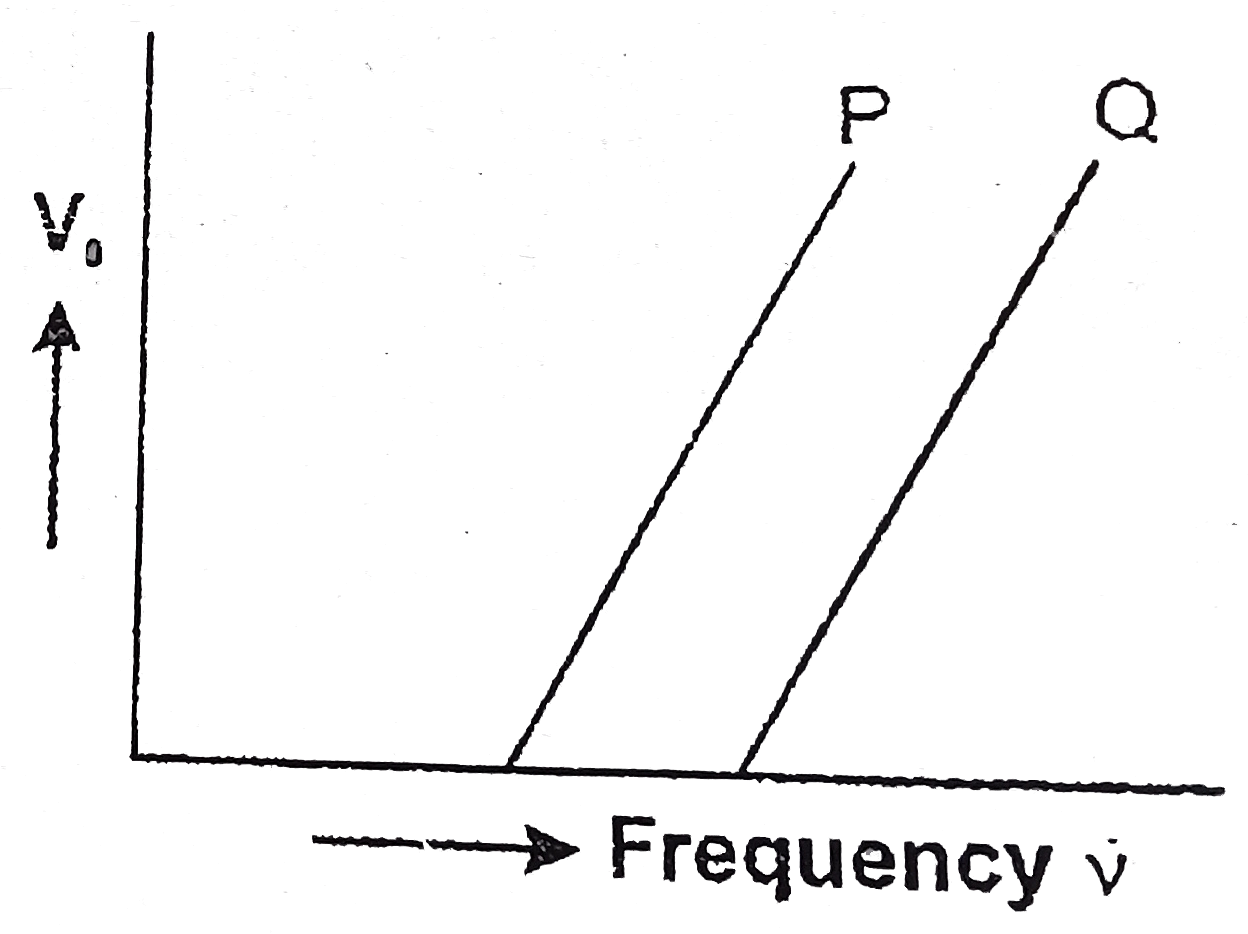
View SolutionThe graph between the stopping potential V0 and frequency v for two different metal plates P and Q are shown in the figure. Which of the metals has greater threshold wavelength and work function.
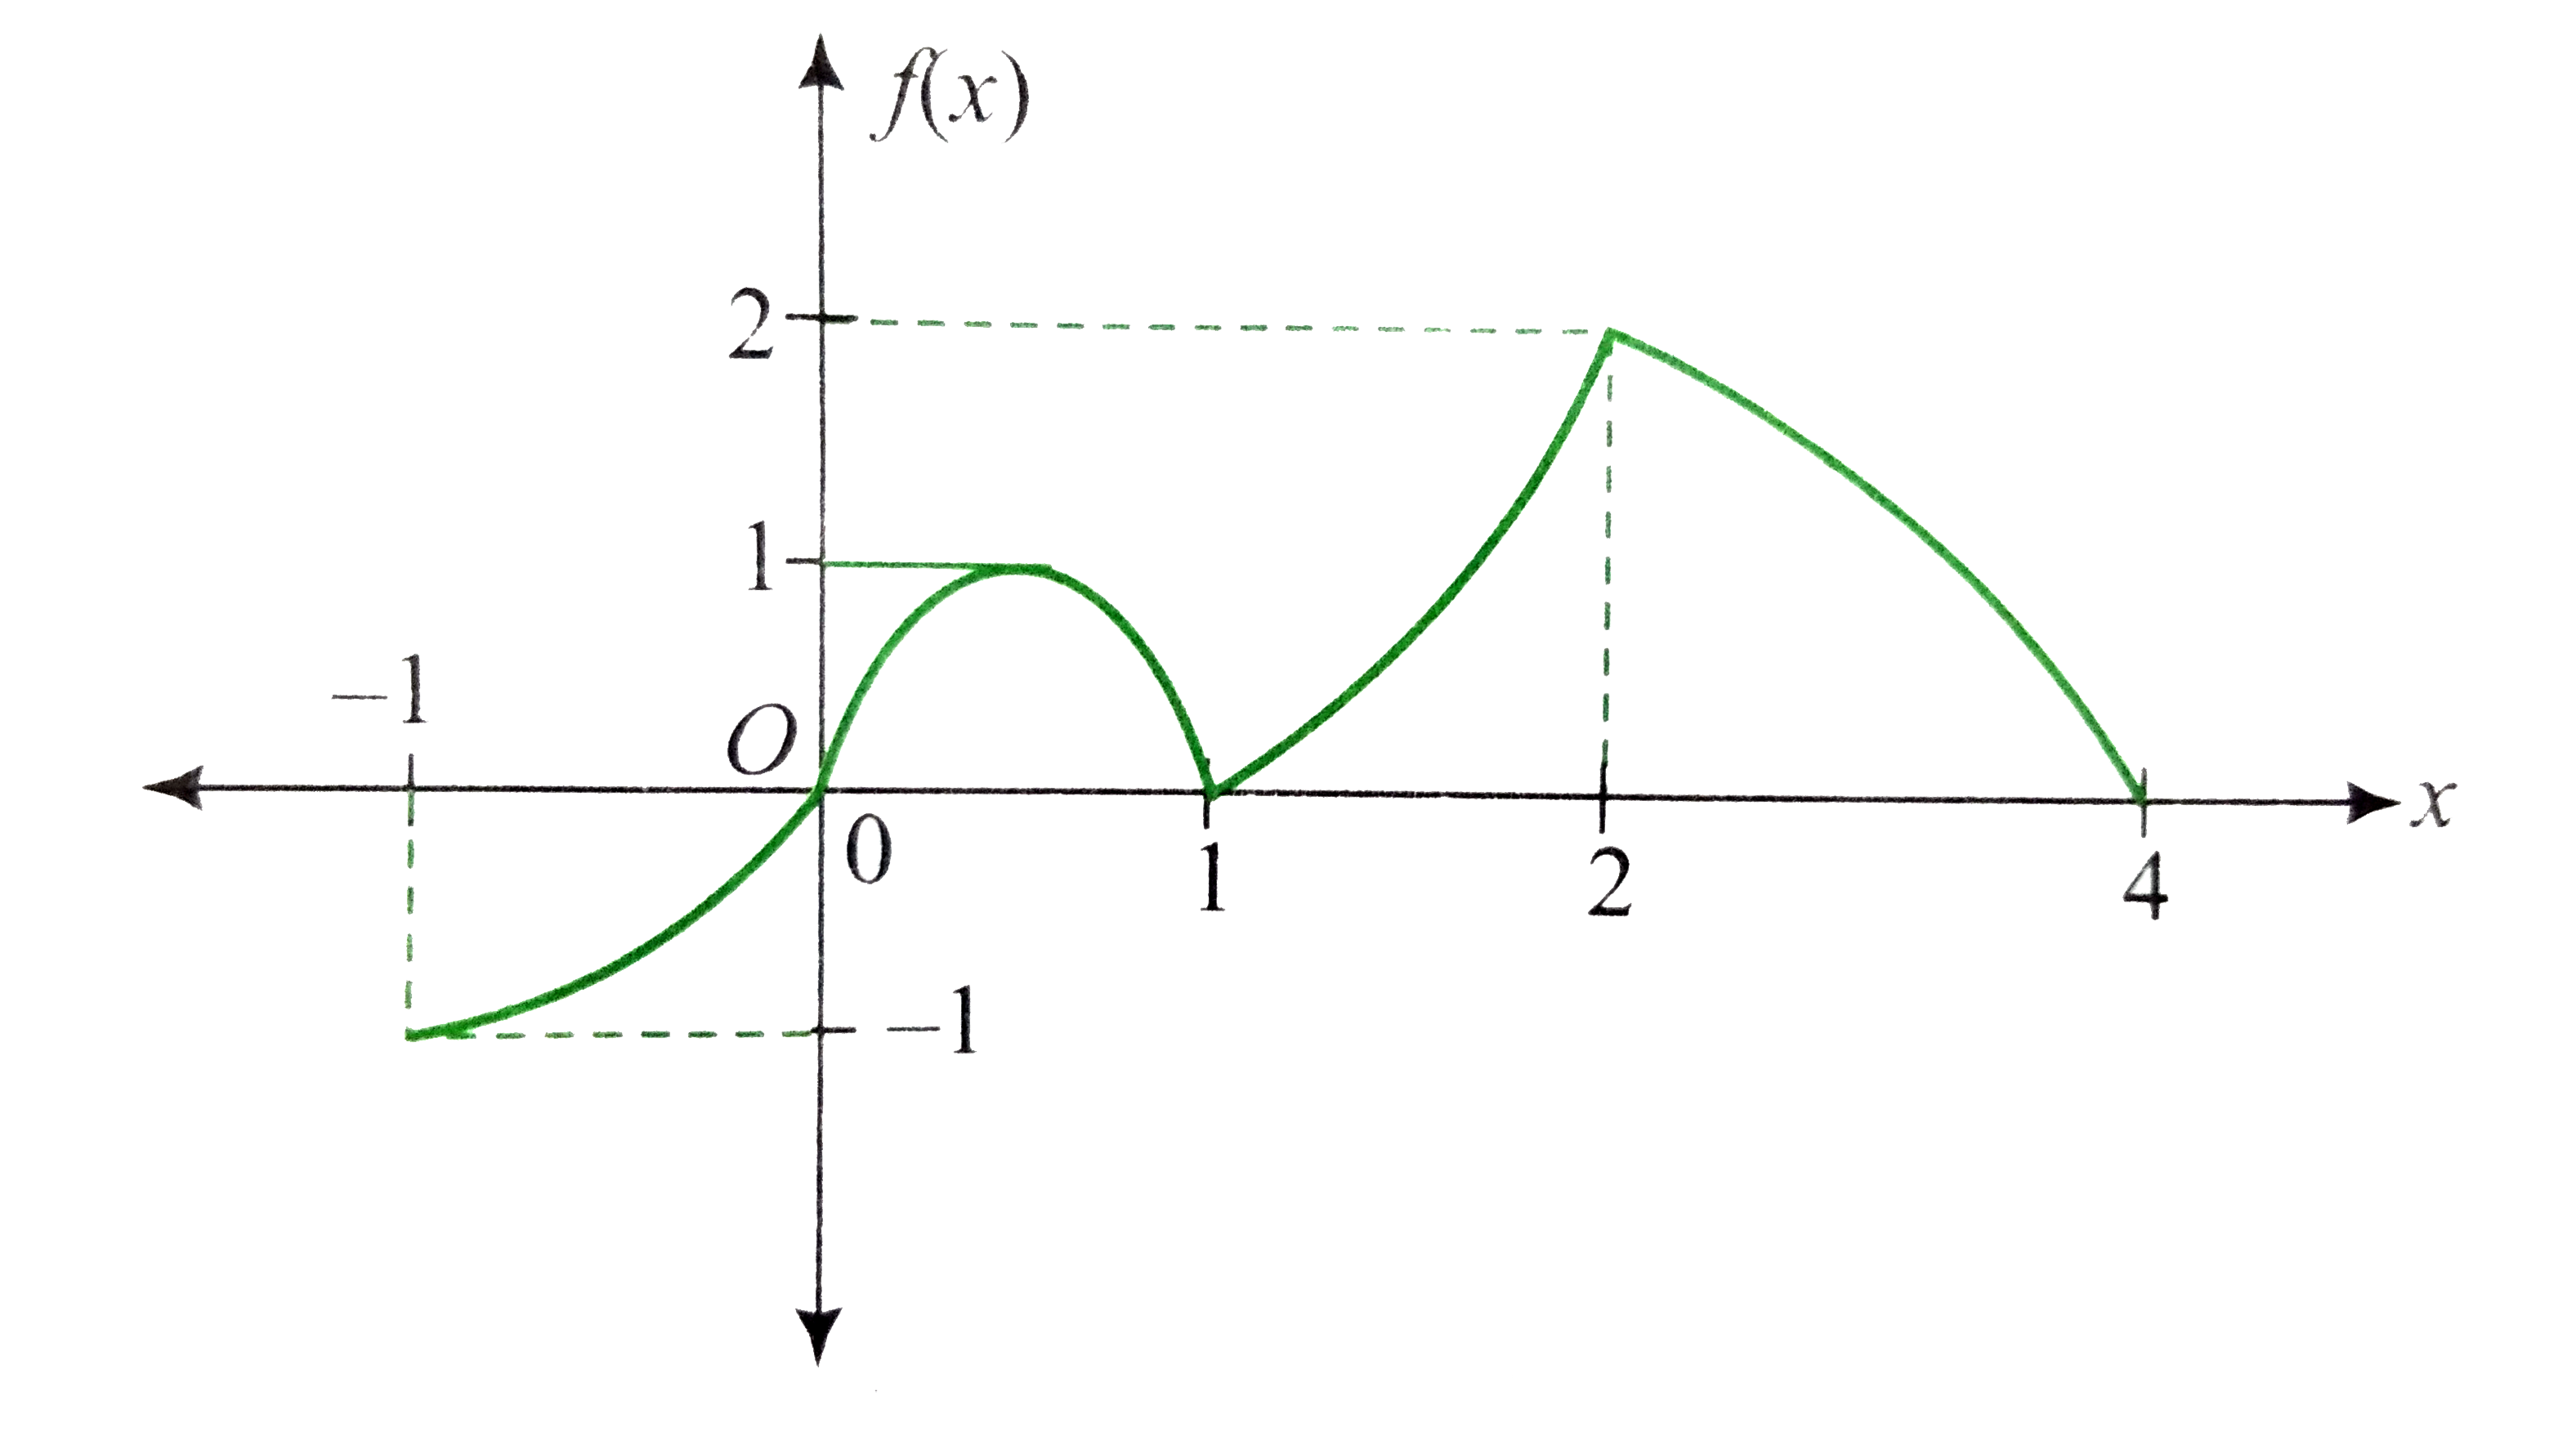
View SolutionIf graph of a function f(x) which is defined in [-1, 4] is shown in the following figure then identify the correct statement(s).
View SolutionThree metals have work functions in the ratio 2 3:4. Graphs are drawn for all connecting stopping potential and incident frequency. The graphs have slopes in the ratio
View SolutionIn a photoelectric effect experiment, the graph of stopping potential V versus reciprocal of wavelength obtained is shown in the figure. As the intensity of incident radiation is increased :
View SolutionIf a graph is plotted between 1/v and 1/u , which one of the graph shown in figure is approximately correct ?
View SolutionFor photo - electric effect with incident photon wavelength λ the stopping is V0 identify the correct variation(s) of V0 with λand1/λ
View SolutionPhotoelectric effect experiments are performed using three different metal plates p,q andr having work function ϕp=2.0eV,ϕe=2.5eVandϕr=3.0eV respectively A light beam containing wavelength of 550nm,450nm and 350nm with equal intensities illuminates each of the plates . The correct I−V graph for the experiment is [Take hc = 1240 eV nm]
View Solution
