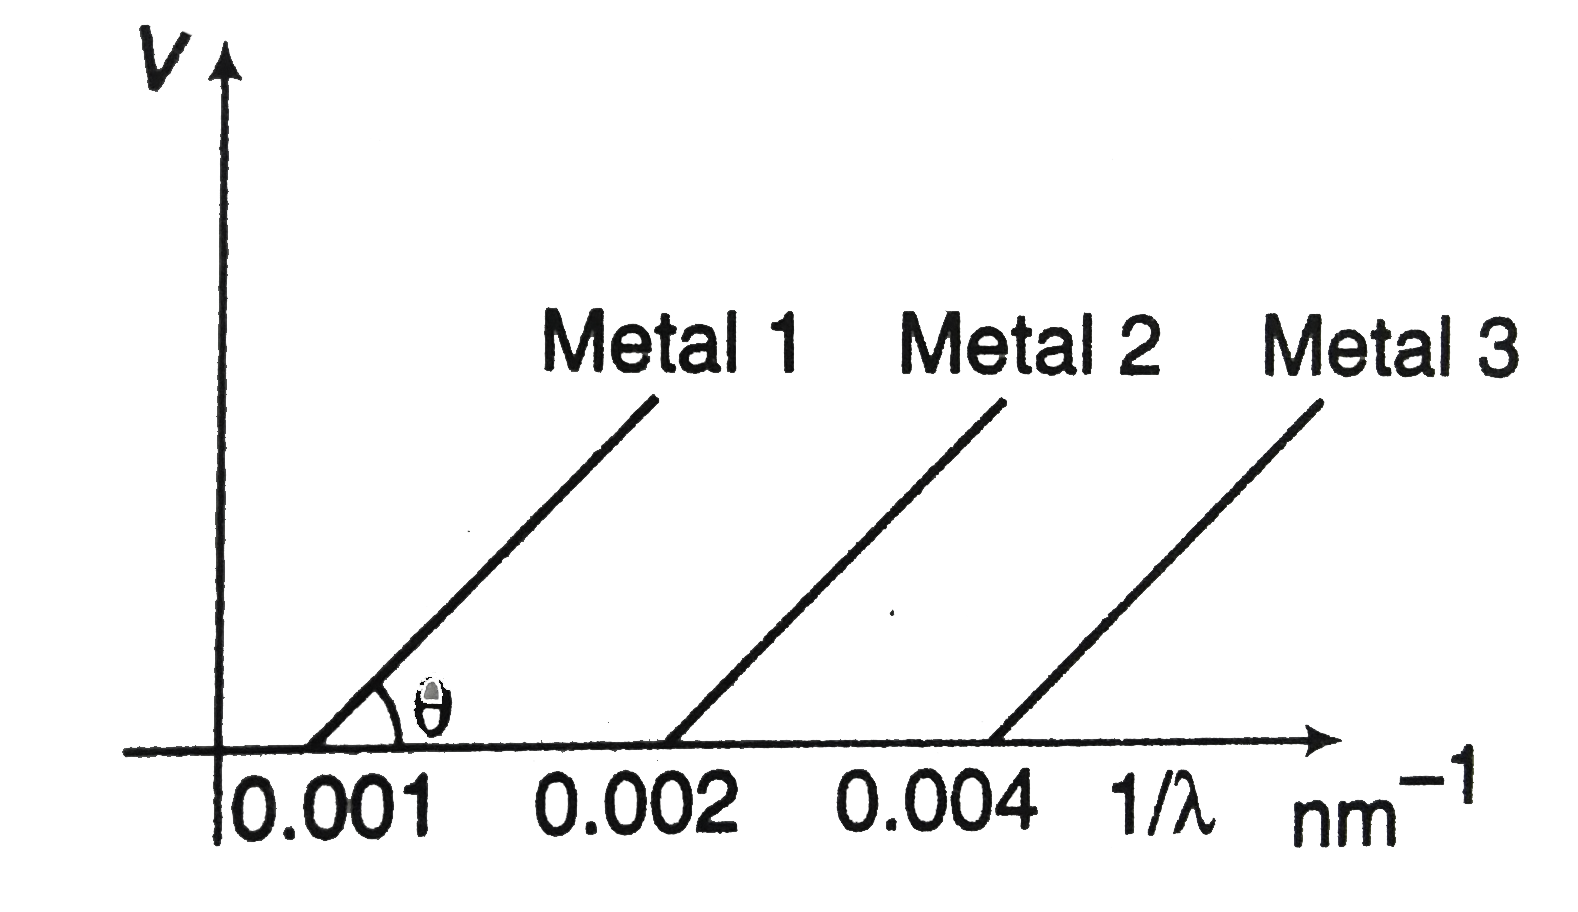
The graph between the stopping potential is shown in the figure are work function , which of the following is /are correct
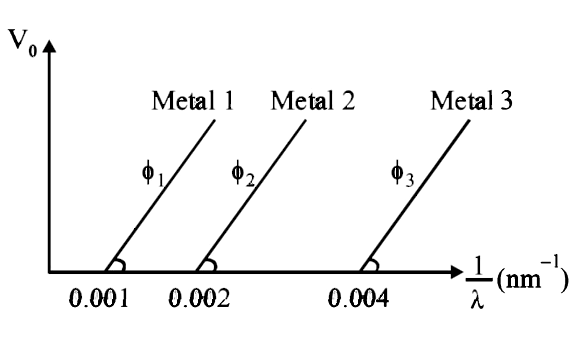
Ratio of work functions
Ratio of work functions
is directly proportional to , where is Planck's constant and is the speed of light.
The violet colour light can eject photoelectrons from metlas and
The correct Answer is:A, C
For plate , threshold wavelength
For plate threshold wavelength
Since violet colour light is , so for plate .
So, violet colour light will eject photo-electrons from plate and not from plate .
Topper's Solved these Questions
- ATOMIC PHYSICSBook:RESONANCE ENGLISHChapter:ATOMIC PHYSICSExercise:Advanved level problems
Explore 17 Videos
- ATOMIC PHYSICSBook:RESONANCE ENGLISHChapter:ATOMIC PHYSICSExercise:Exercise-2 Part-III : Comprehension
Explore 12 Videos
- ALTERNATING CURRENTBook:RESONANCE ENGLISHChapter:ALTERNATING CURRENTExercise:HIGH LEVEL PROBLEMS
Explore 11 Videos
- CAPACITANCEBook:RESONANCE ENGLISHChapter:CAPACITANCEExercise:High Level Problems
Explore 16 Videos
Similar Questions
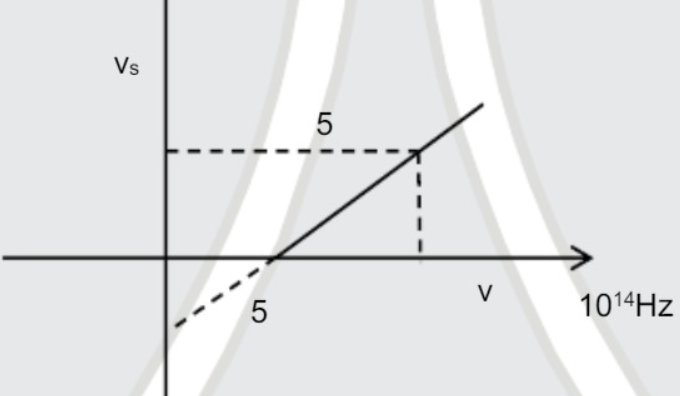
Graph between stopping potential and frequency of light as shown find the work function
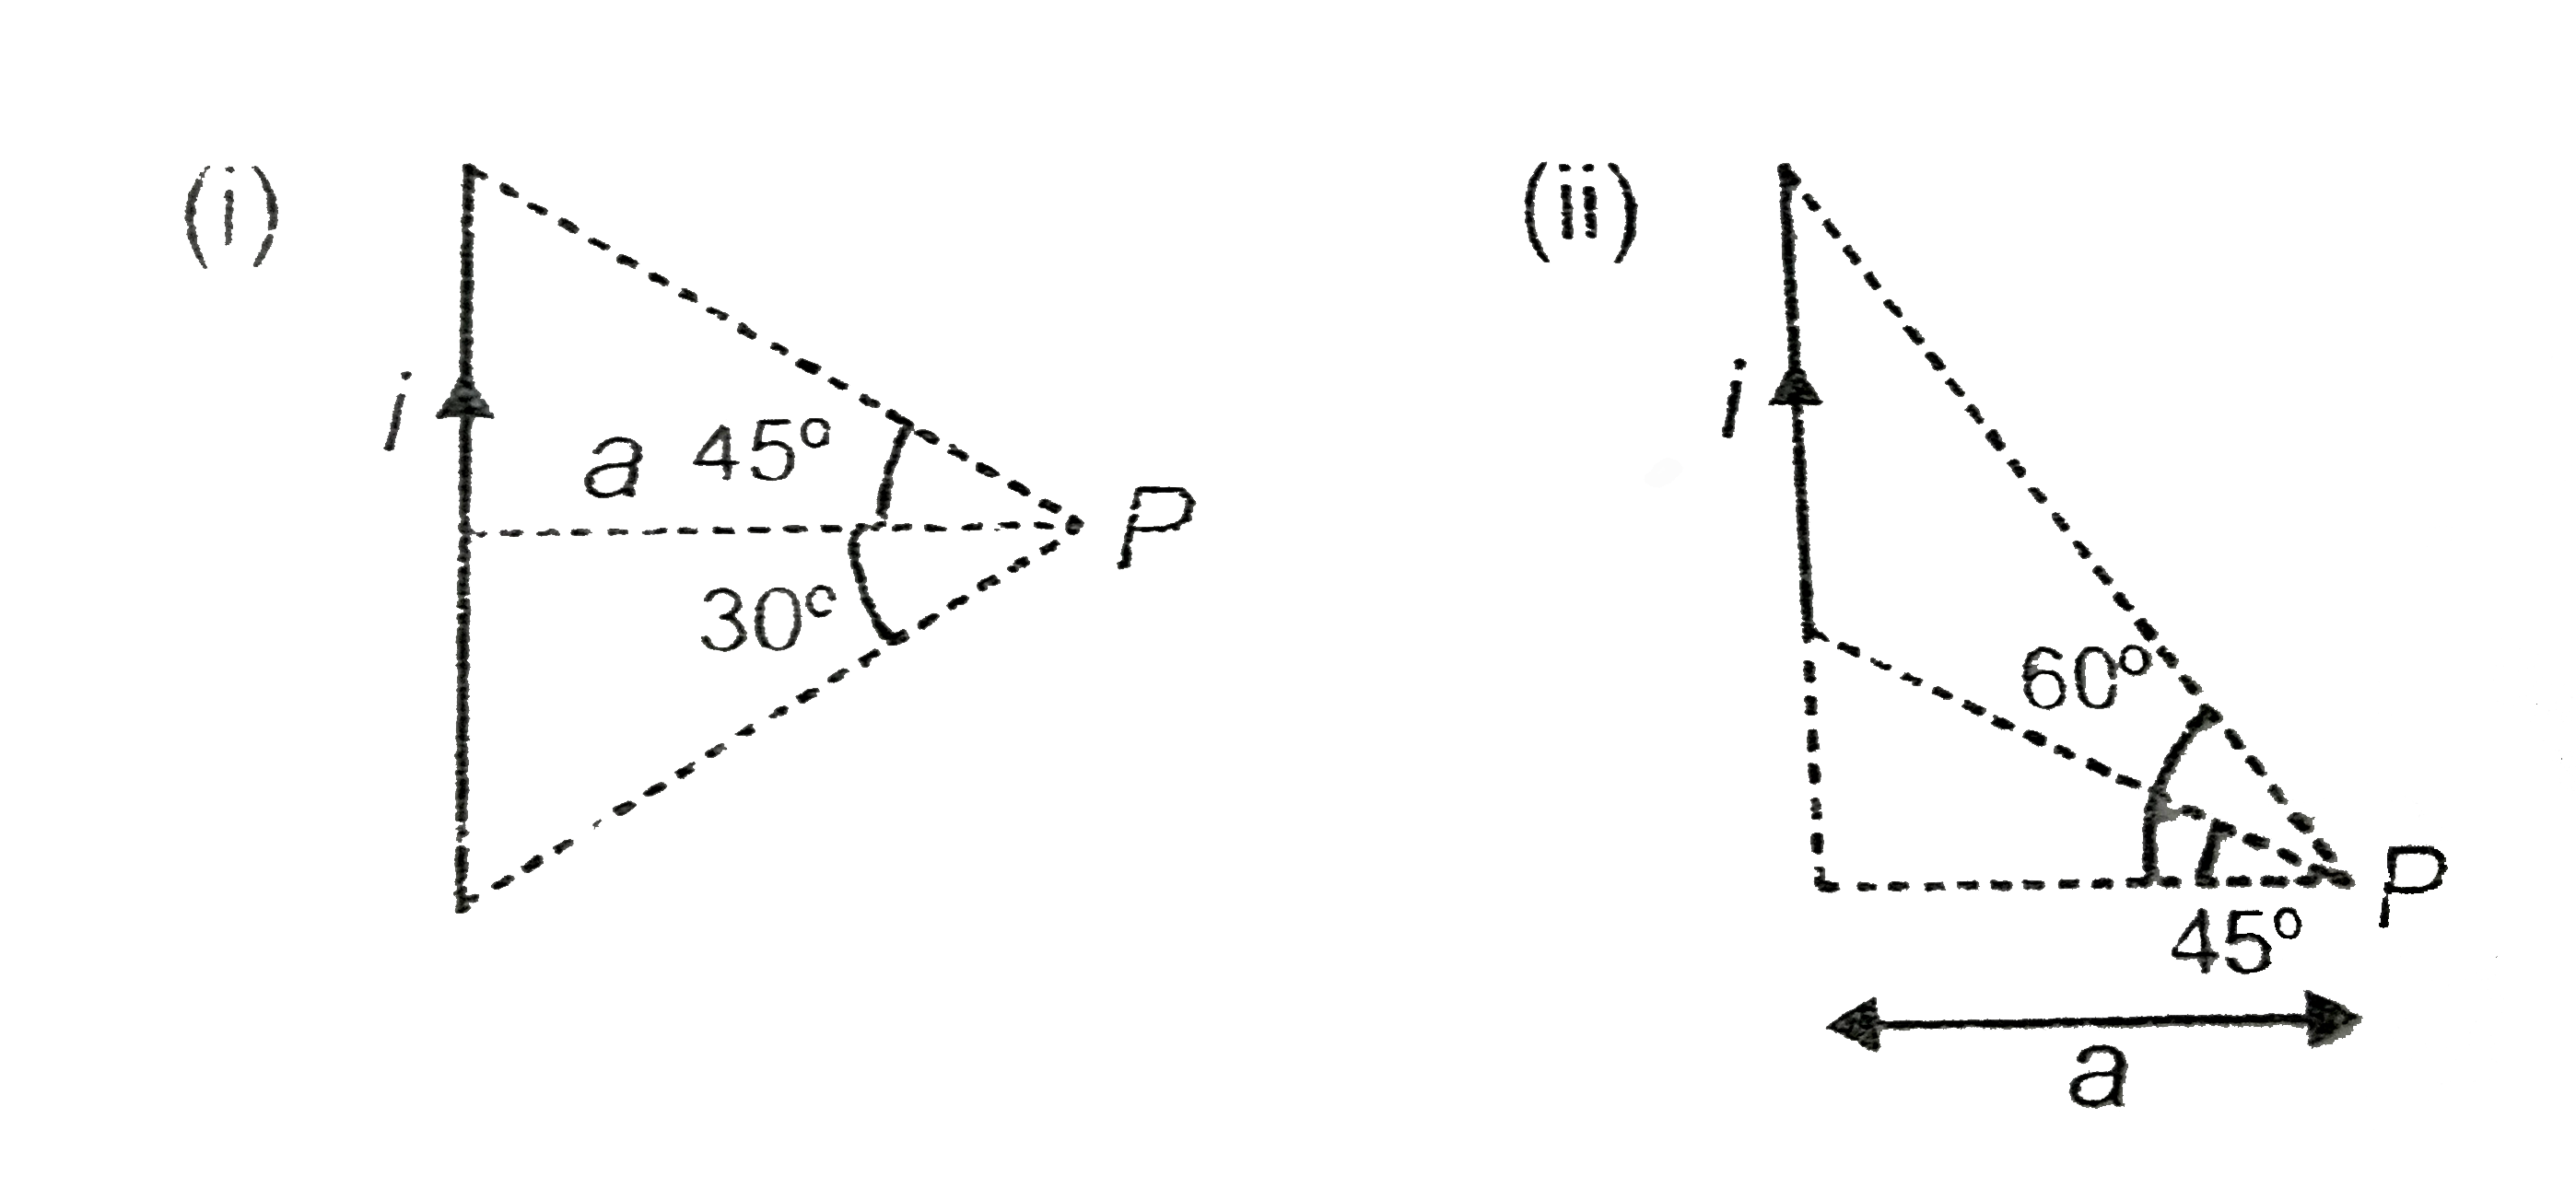
View SolutionWhat are value of ϕ1,ϕ2 and r to find out magnetic field at P in the following cases ?
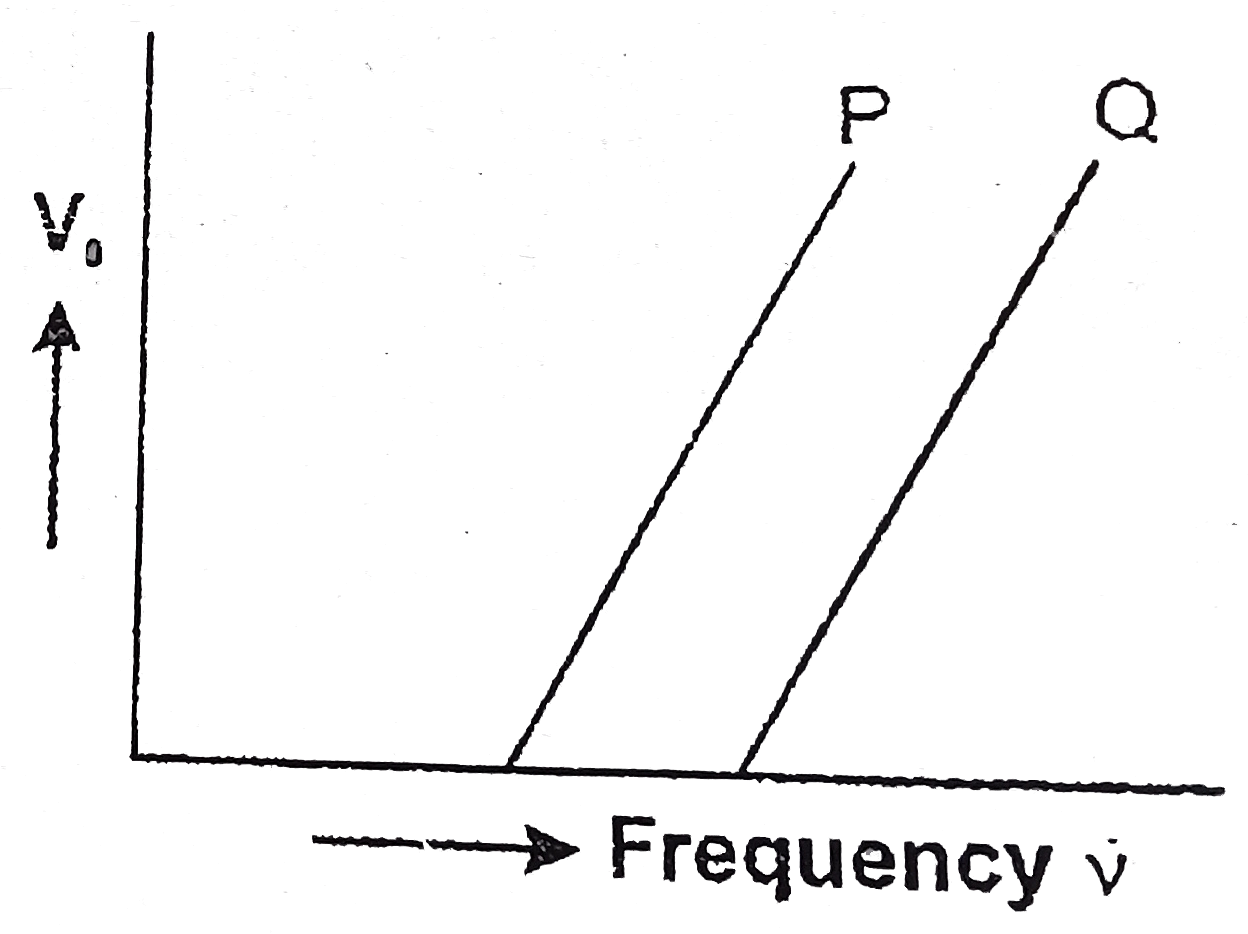
View SolutionThe graph between the stopping potential V0 and frequency v for two different metal plates P and Q are shown in the figure. Which of the metals has greater threshold wavelength and work function.
View SolutionThe graph between 1λ and stopping potential V0 of two metals having work funcation ϕ1 and ϕ2 in an experiment of photoelectric effect is obtained as shown in the figure. Find out -
_E01_164_Q01.png)
(i) Threshold wavelength ofboth metals
(ii) ϕ1:ϕ2
(iii) Whihc metal cen emit photoelectrons with visible light ?
View SolutionWhich of the following statements are true ?
0 cancel in phi
View SolutionThe graph between 1/λ and stopping potential (V) of three metals having work- functions Φ1, Φ2 and Φ3 in an experiment of photoelectric effect is plotted as shown in the figure. Which of the following statement(s) is/are correct? (Here, λ is the wavelength of the incident ray).
View SolutionThe figure shows different graphs between stopping potential (V0) and frequency (v) for photosensitive surface of cesium , potassium , sodium and lithium. The plots are parallel. Correct ranking of the targets according to their work function greatest forst will be

View SolutionGraph between stopping potential and frequency of photon is given in figure
_2019_CBT7_E01_021_Q01.png)
Find out work function of metal:
View SolutionA light is incidence on a metallic surface. Graph etween stopping potential Vs and 1λ is as shown in figure. when intensity of ligh is increases at given frequency then:
View SolutionIf ϕ(x)=ϕ'(x) and ϕ(1)=2, then ϕ(3) equals
View Solution

