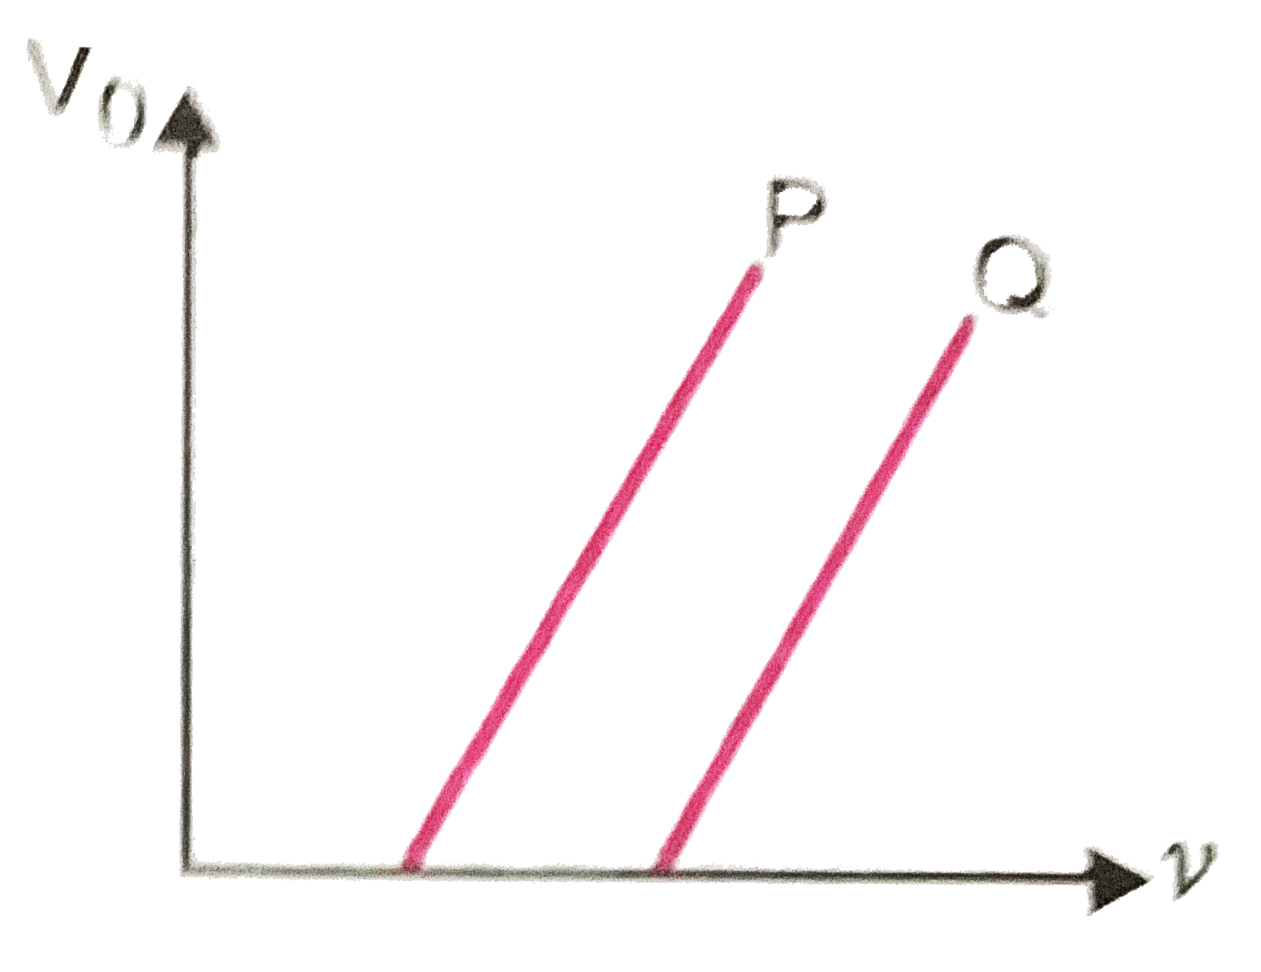
The graph between the stopping potential and frequency for two different metal plates and are shown in the figure. Which of the metals has greater threshold wavelength and work function.
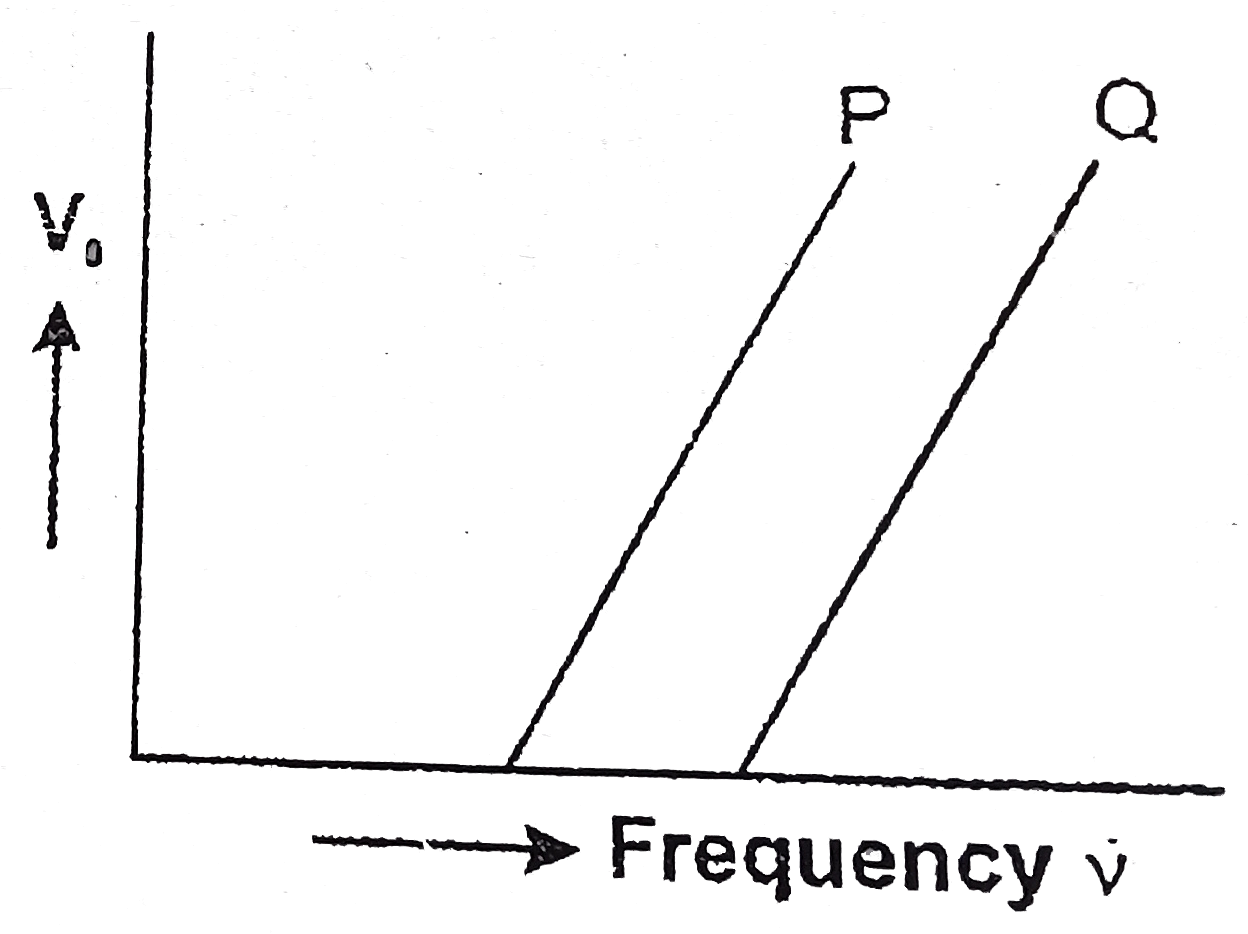
From graph,
So work function of is greater than
Topper's Solved these Questions
- ATOMIC PHYSICSBook:RESONANCE ENGLISHChapter:ATOMIC PHYSICSExercise:Advanved level problems
Explore 17 Videos
- ATOMIC PHYSICSBook:RESONANCE ENGLISHChapter:ATOMIC PHYSICSExercise:Exercise-2 Part-III : Comprehension
Explore 12 Videos
- ALTERNATING CURRENTBook:RESONANCE ENGLISHChapter:ALTERNATING CURRENTExercise:HIGH LEVEL PROBLEMS
Explore 11 Videos
- CAPACITANCEBook:RESONANCE ENGLISHChapter:CAPACITANCEExercise:High Level Problems
Explore 16 Videos
Similar Questions
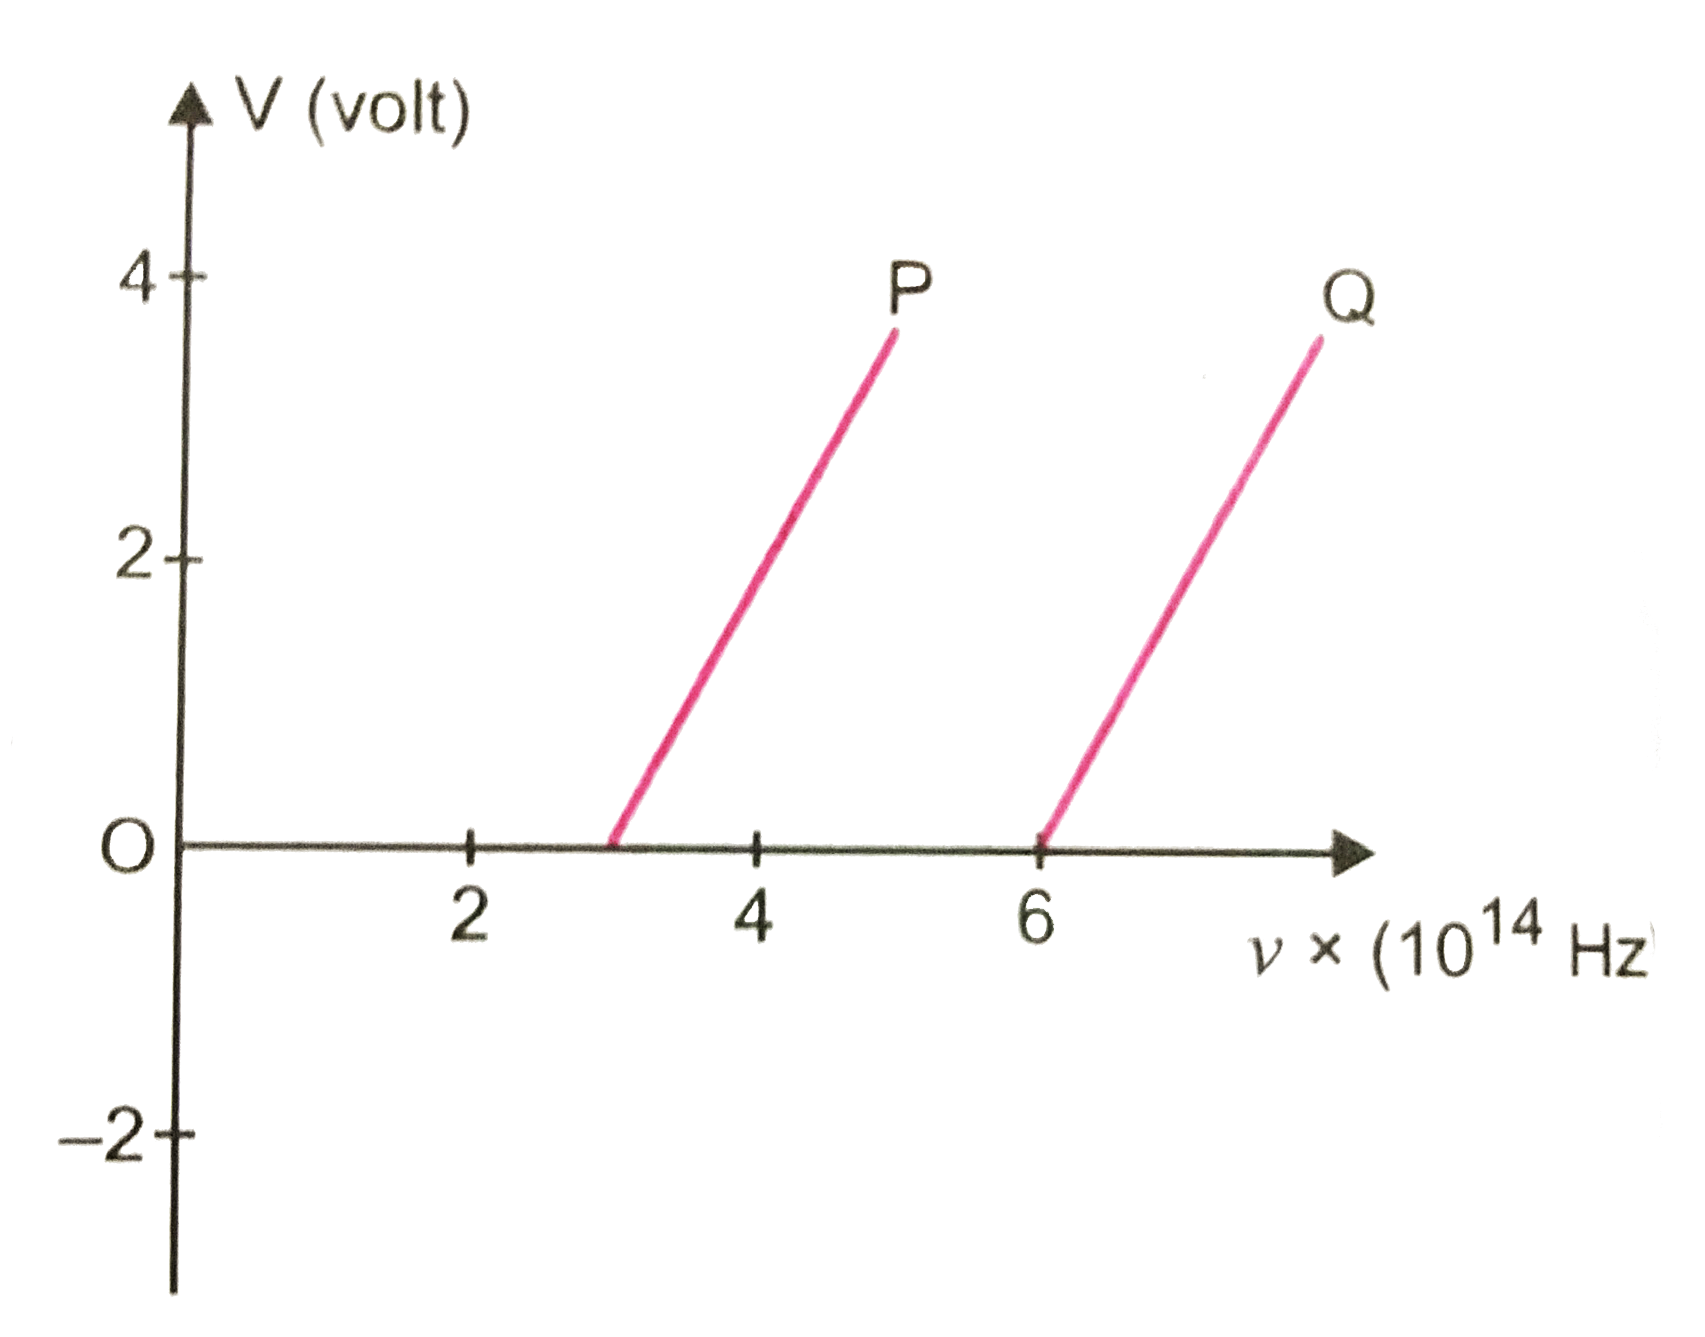
In the study of a photoelectric effect the graph between the stopping potential V and frequency ν of the incident radiation on two different metals P and Q is shown in fig.
(i) which one of two metals have higher threshold frequency
(ii) Determine the work function of the metal which has greater value
(iii) Find the maximum kinetic energy of electron emitted by light of frequency 8×10¹⁴Hz for this metal.
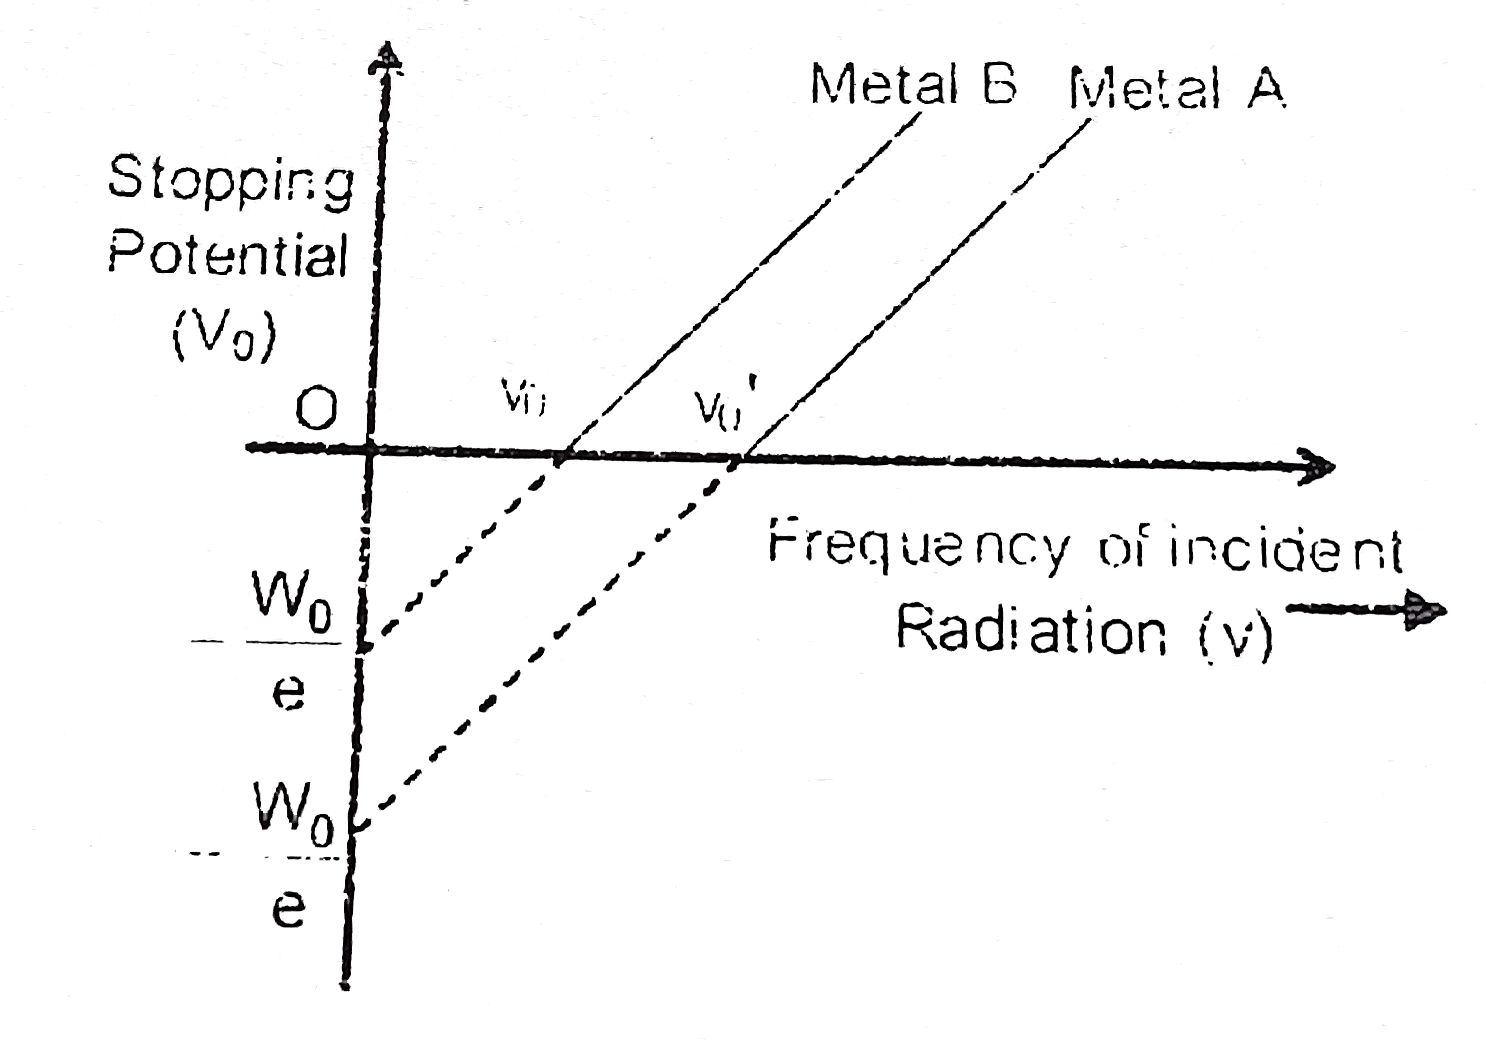
View SolutionThe graph shows variation of stopping potential V0 versus frequency of incident radiation v for two photosensitive metals A and B. Which of two metals has higher threshold frequency and why?
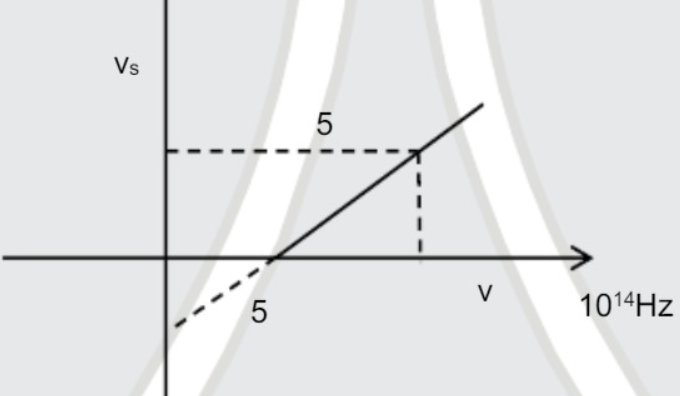
View SolutionGraph between stopping potential and frequency of light as shown find the work function
View SolutionGraph between stopping potential and frequency of photon is given in figure
_2019_CBT7_E01_021_Q01.png)
Find out work function of metal:
View SolutionFig. shows the variation of stopping potential V0 with the frequency v of the incident radiation for two photosensitive metal P and Q:
(i) Explain which metal has smaller threshold wavelength
(ii) Explain, giving reason, which metal emits photoelectrons having smaller kinetic energy, for the same wavelength of incident radiation.
(iii) If the distance between the light source and metal P is doubled, how will the stopping potential change.
View SolutionTwo metals A and B have work functions 4 eV and 6 eV respectively. Which metal has lower threshold wavelength for photoelectric effect ?
View SolutionThe figure shows different graphs between stopping potential (V0) and frequency (v) for photosensitive surface of cesium , potassium , sodium and lithium. The plots are parallel. Correct ranking of the targets according to their work function greatest forst will be

View SolutionFigure shows the graph of stopping potential verus that frequency of a photosensitive metal. The plank's constant and work funcation of the metal are
_S01_035_Q01.png)
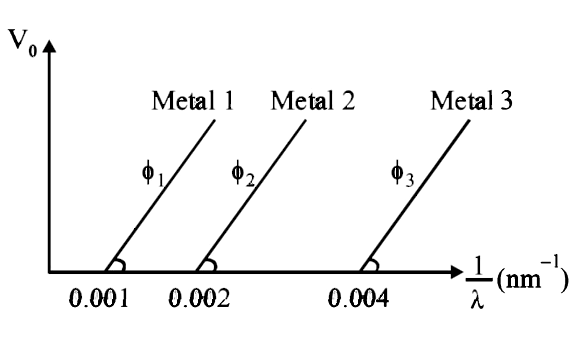
View SolutionThe graph between the stopping potential (V0)and(1λ) is shown in the figure ϕ1,ϕ2andϕ3 are work function , which of the following is /are correct
View SolutionThe displacement-time graphs of two particles P and Q are as shown in the figure. The ratio of their velocities VP and VQ will be

View Solution

