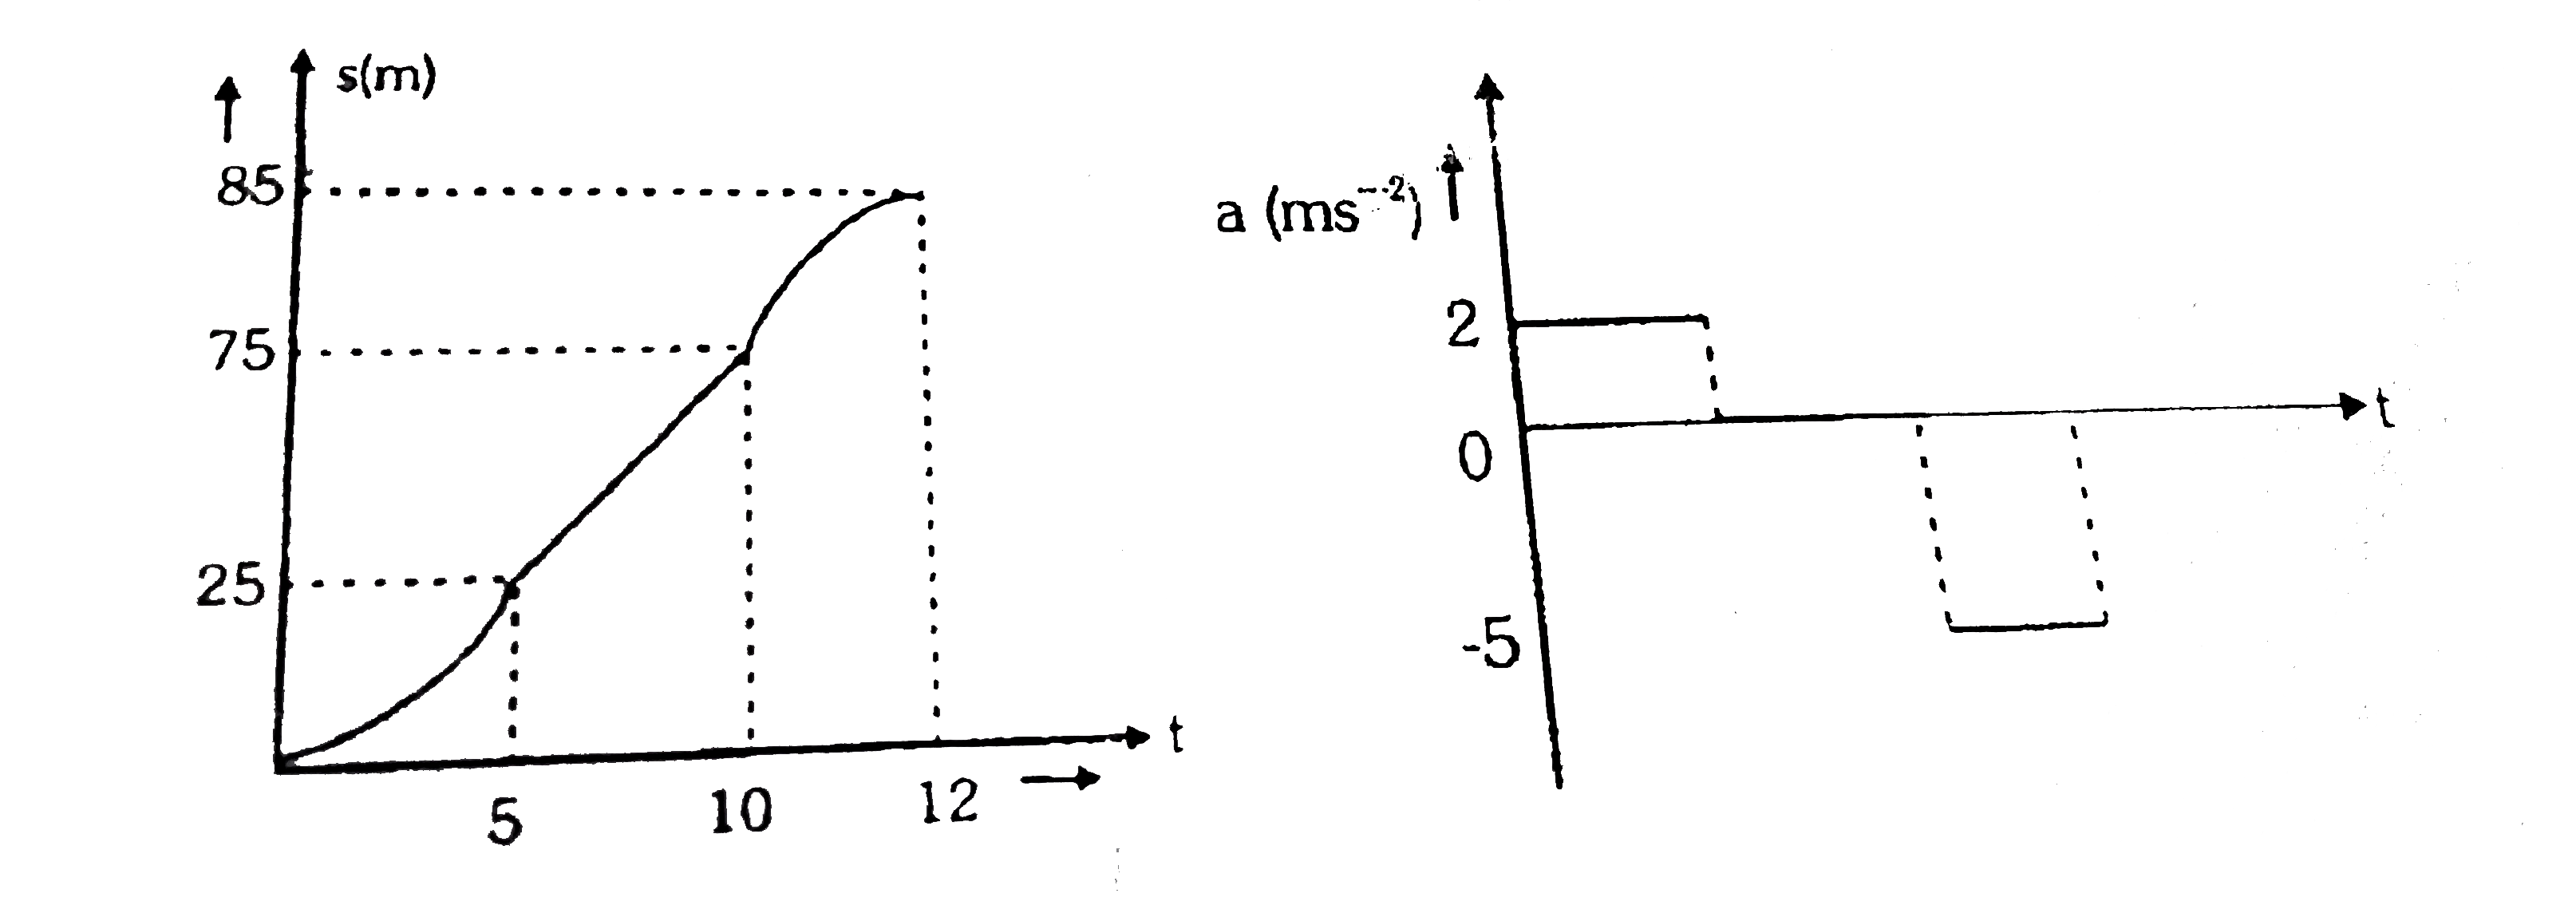
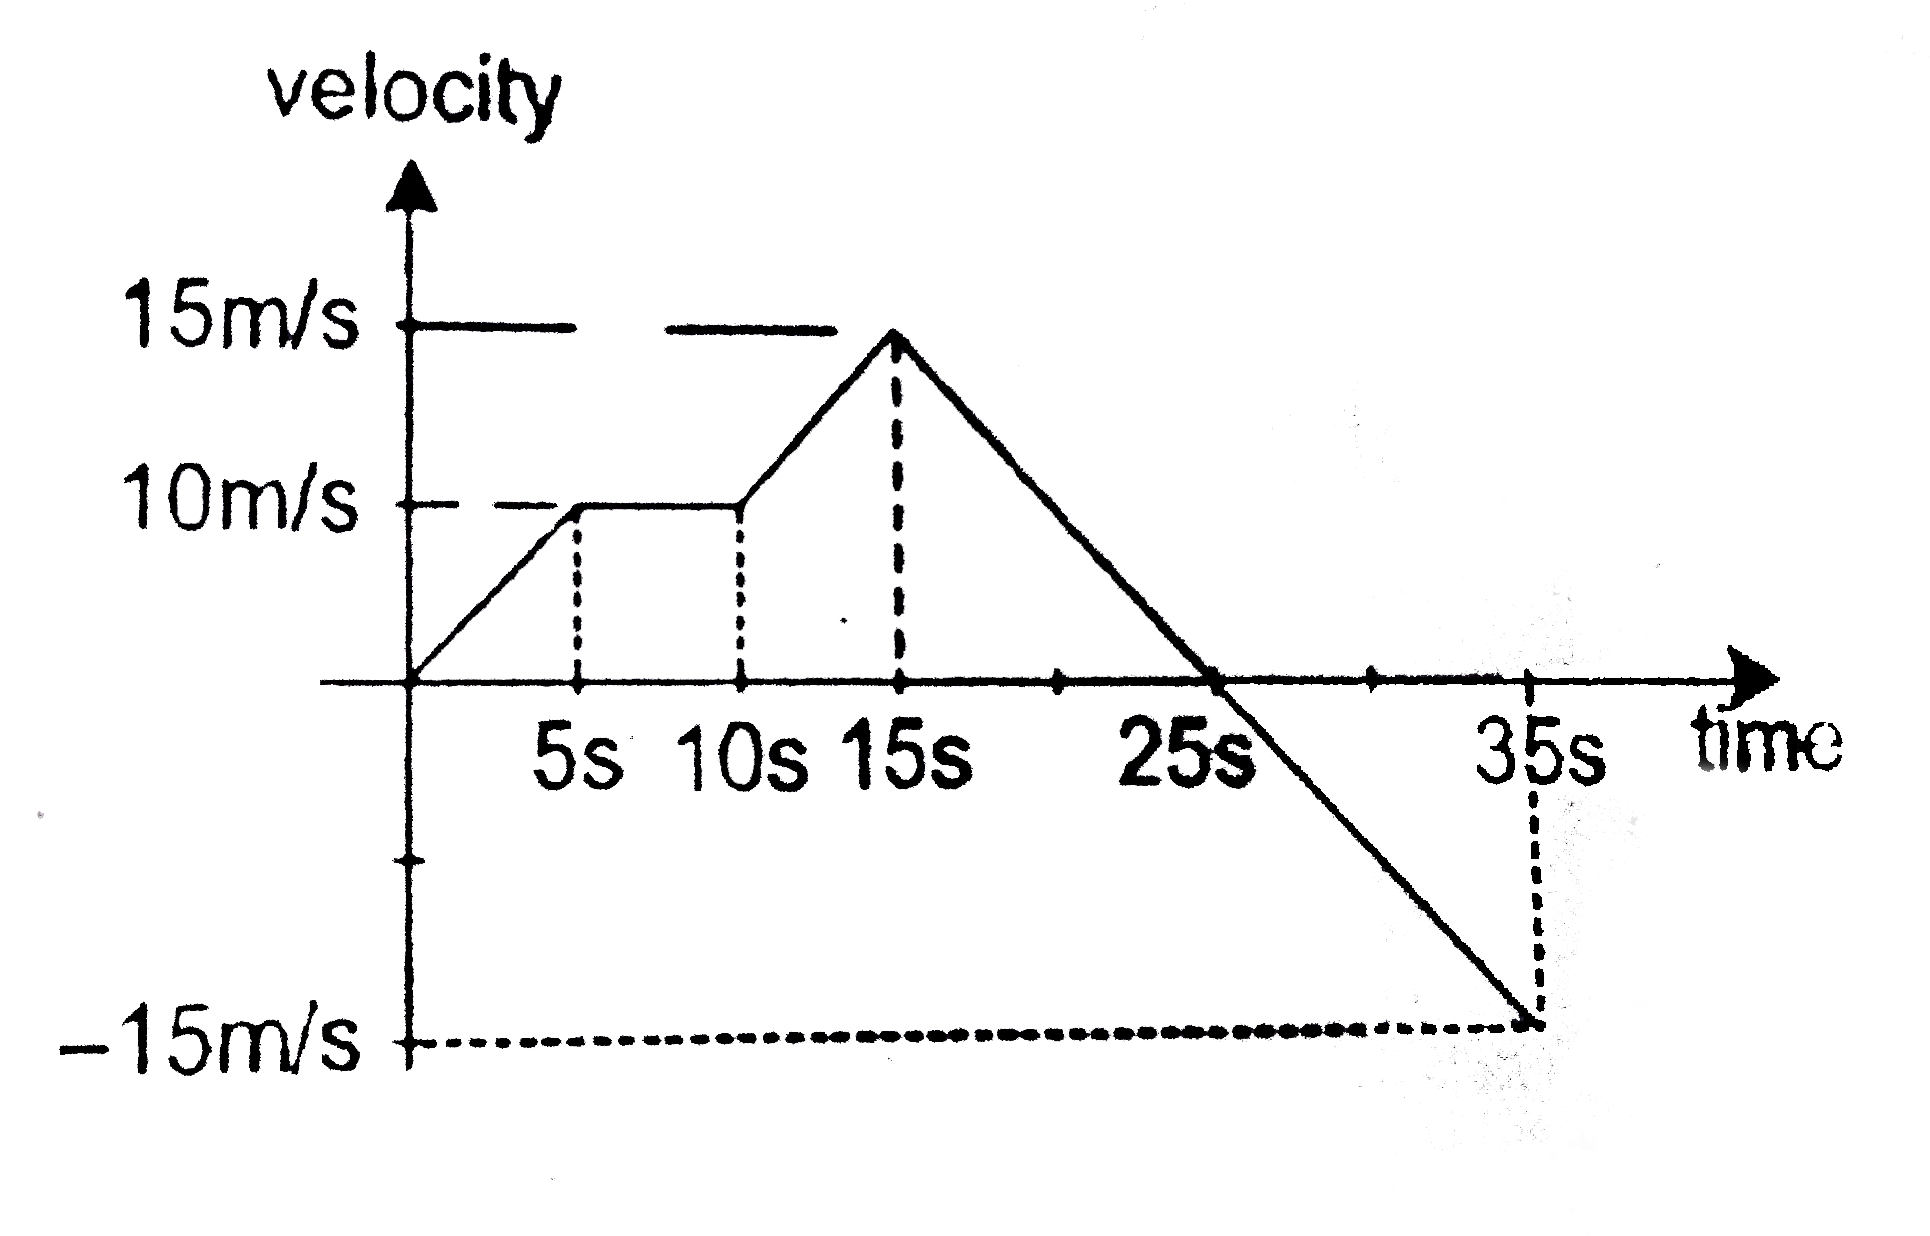
Draw displacement time and acceleration -time graph for the given velocity-time graph
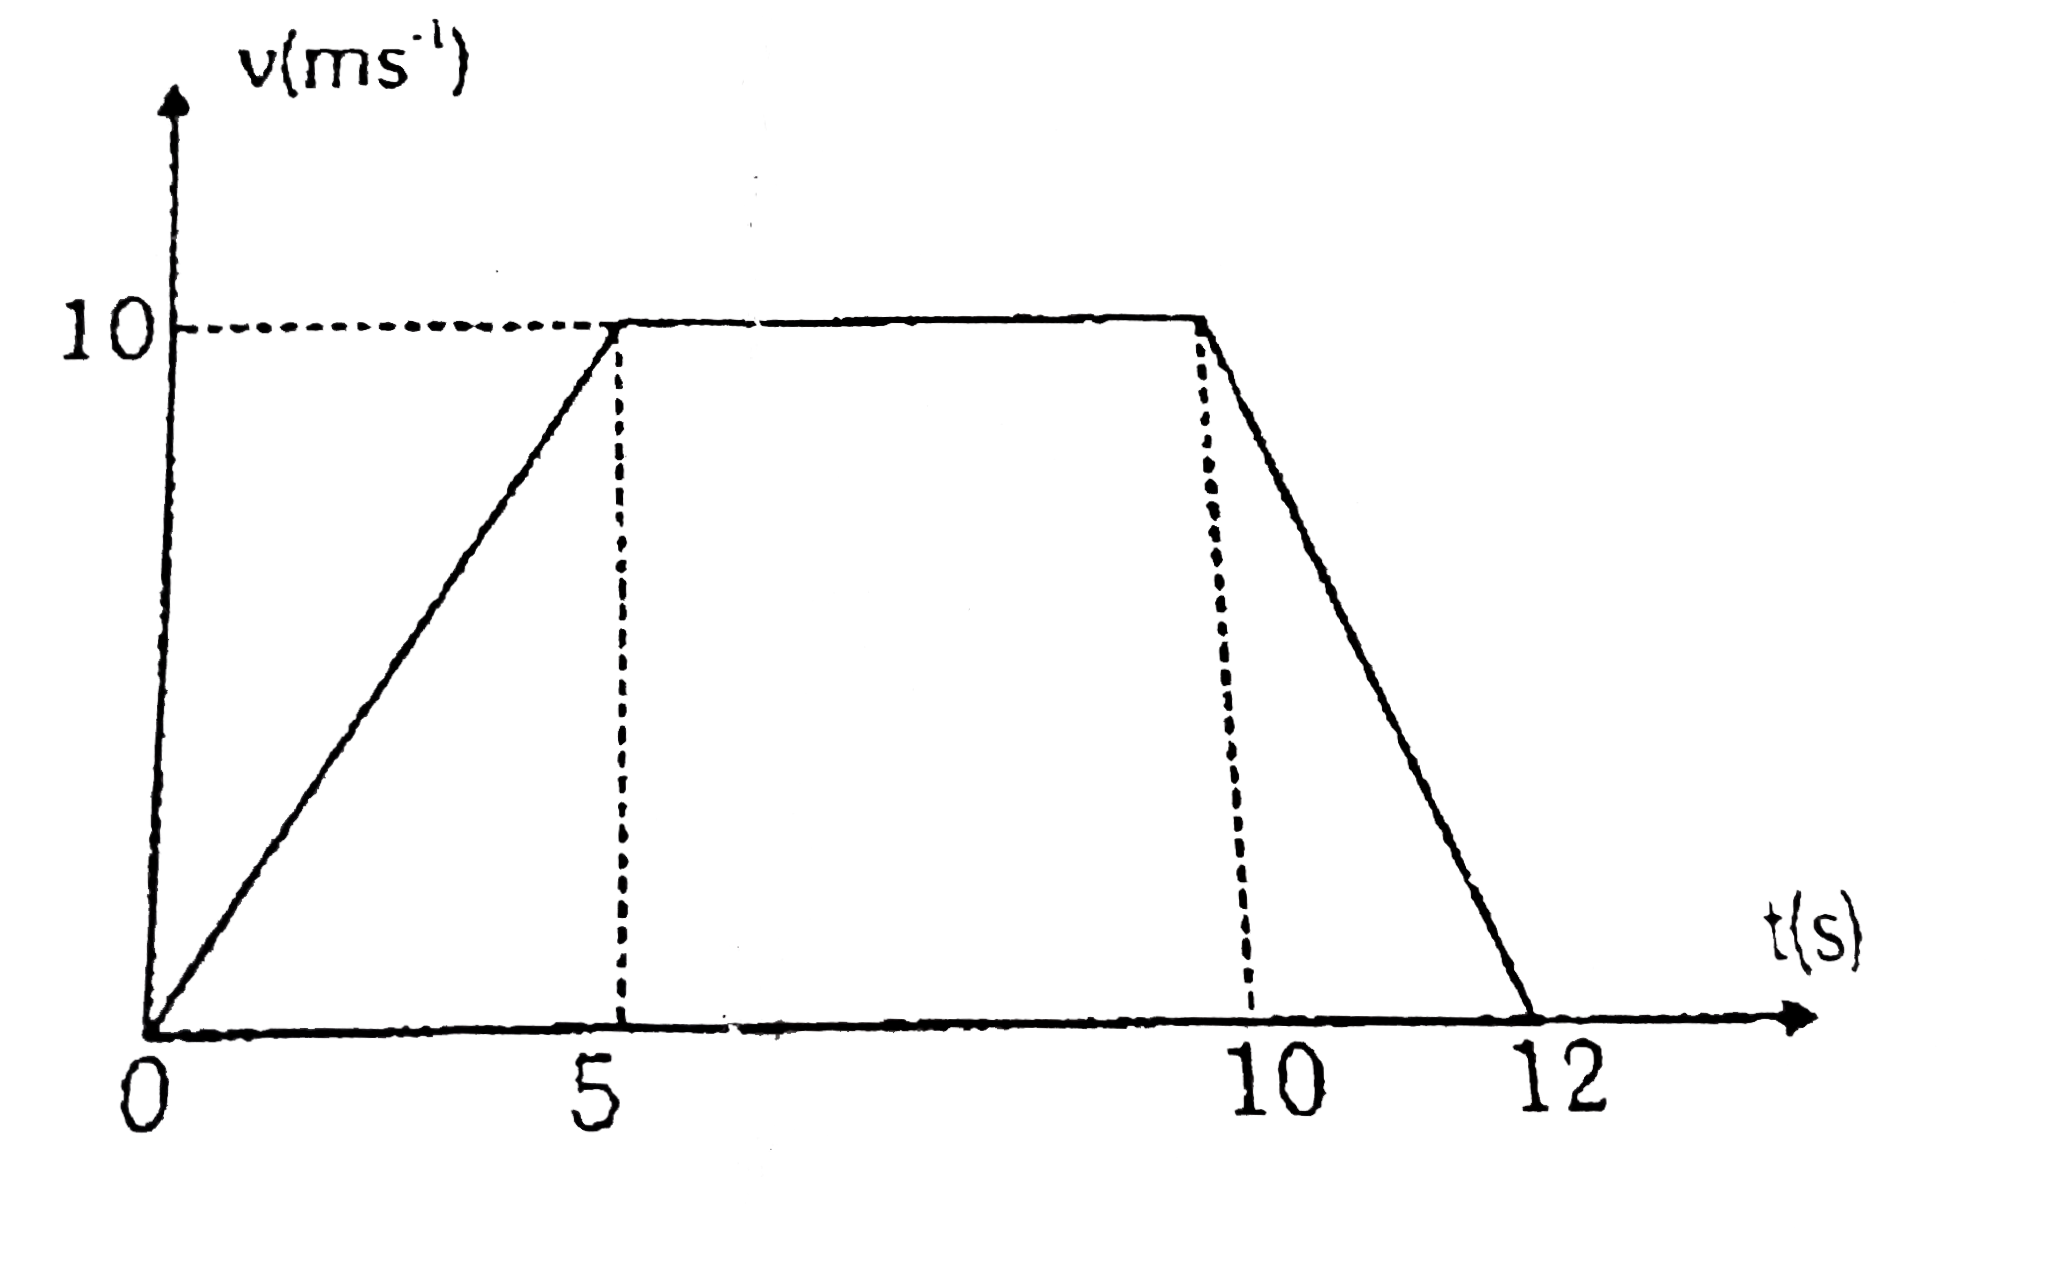
For 0≤t≤5v∝t⇒s∝t2 and a1= constant 105=2m/s2
for whole interval s1= Area under the curve =12×5×10=25m
For 5≤t≤10,v=10ms−1⇒a=0
for whole interval s2= area under the curve =5×10=50m
For 10≤t≤12 v linearly decreases decreases with time ⇒a3=−102=−5ms−2
for whole interval s3= Area under the curve =12×2×10=10m
Topper's Solved these Questions
- KINEMATICSBOOK - ALLENCHAPTER - KINEMATICSEXERCISE - EXERCISE-01
55 Videos
- KINEMATICSBOOK - ALLENCHAPTER - KINEMATICSEXERCISE - EXERCISE-02
57 Videos
- ERROR AND MEASUREMENTBOOK - ALLENCHAPTER - ERROR AND MEASUREMENTEXERCISE - Part-2(Exercise-2)(B)
22 Videos
- KINEMATICS (MOTION ALONG A STRAIGHT LINE AND MOTION IN A PLANE)BOOK - ALLENCHAPTER - KINEMATICS (MOTION ALONG A STRAIGHT LINE AND MOTION IN A PLANE)EXERCISE - BEGINNER S BOX-7
8 Videos
Similar Questions
Draw the acceleration-time graphs for the given velocity-time graphs of a particle moving along x-axis.

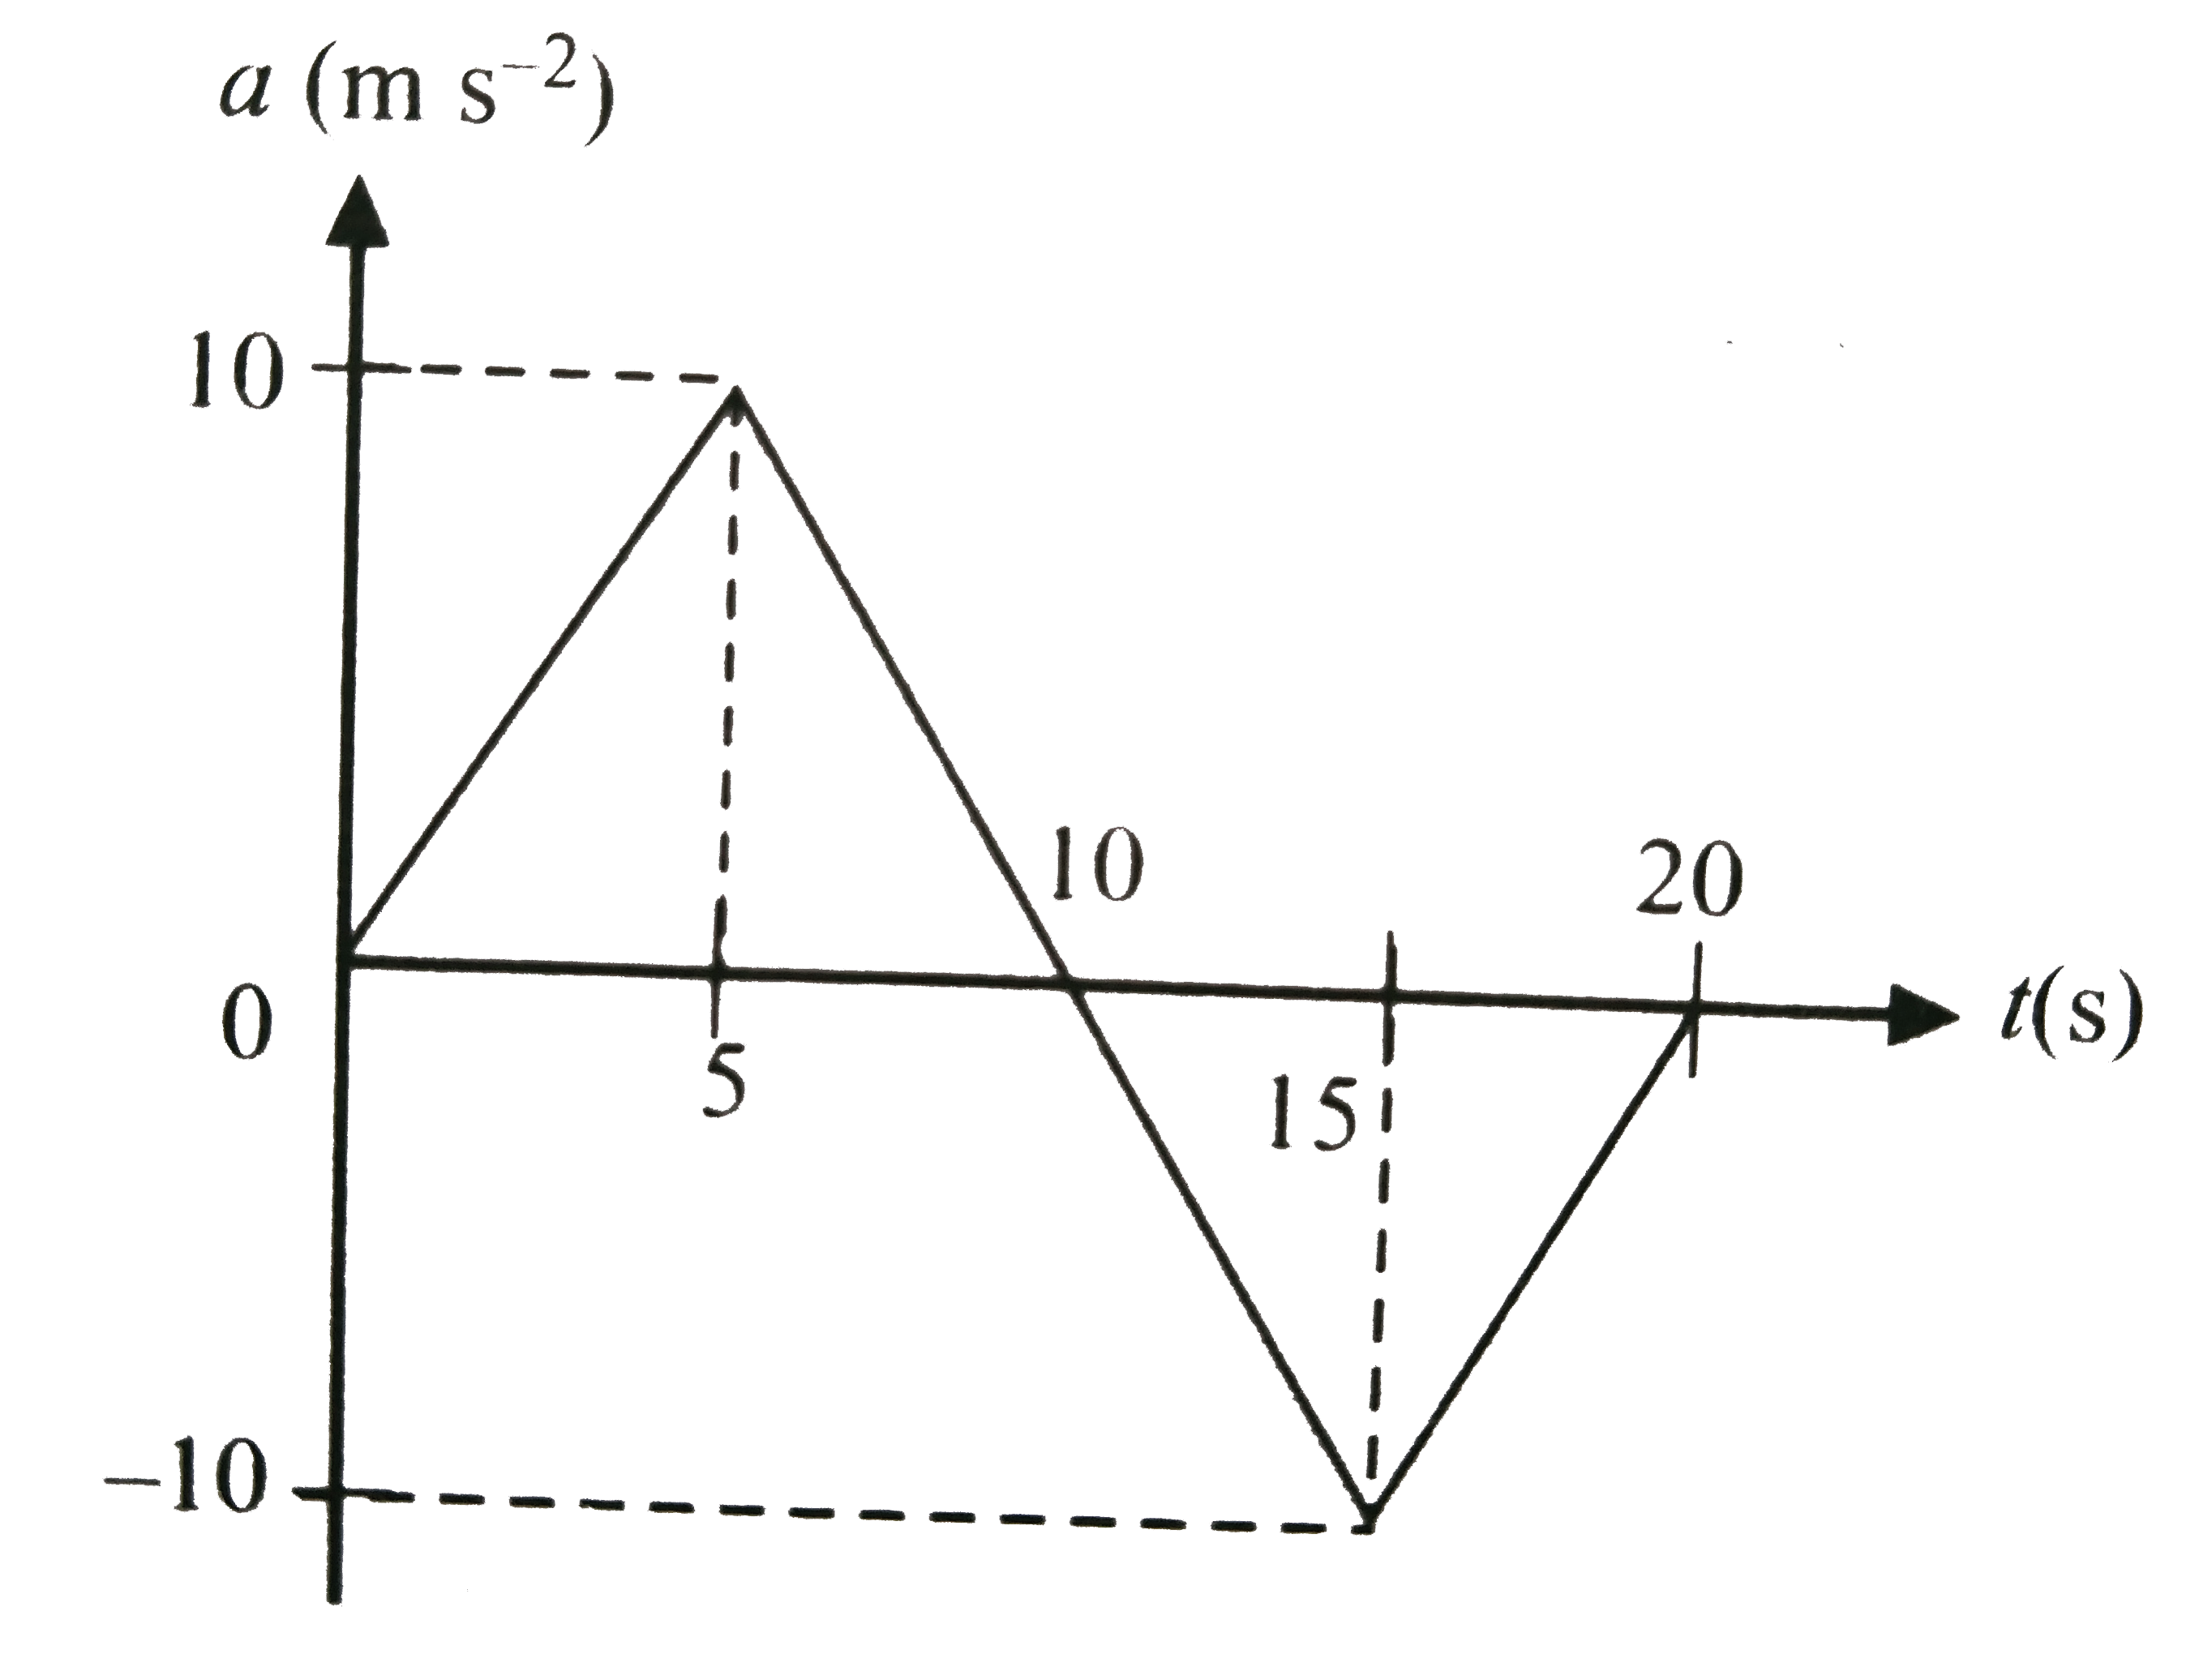
View SolutionPlot the acceleration-time graph of the welocity-time graph given in.
 .
.
View SolutionHow can you determine the displacement and the acceleration of an object from its velocity-time graph?
View SolutionDraw the displacement-time, velocity-time and acceleration-time graph of a body executing shm.
View SolutionDraw areal velocity time graph for Mars.
View SolutionWhich of the following graph for a body moving along a straight line is possible ?
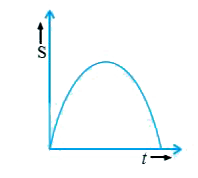
View SolutionThe graph of displacement v/s time is given below. Its corresponding velocity-time graph will be :
View SolutionA person starts from origin and for his linear motion velocity is given as shown in figure. Draw displacement and acceleration graph with respect to time. Also find maximum displacement of the person.
View SolutionSlope of a velocity – time graph gives
View SolutionThe velocity-time graph is given below
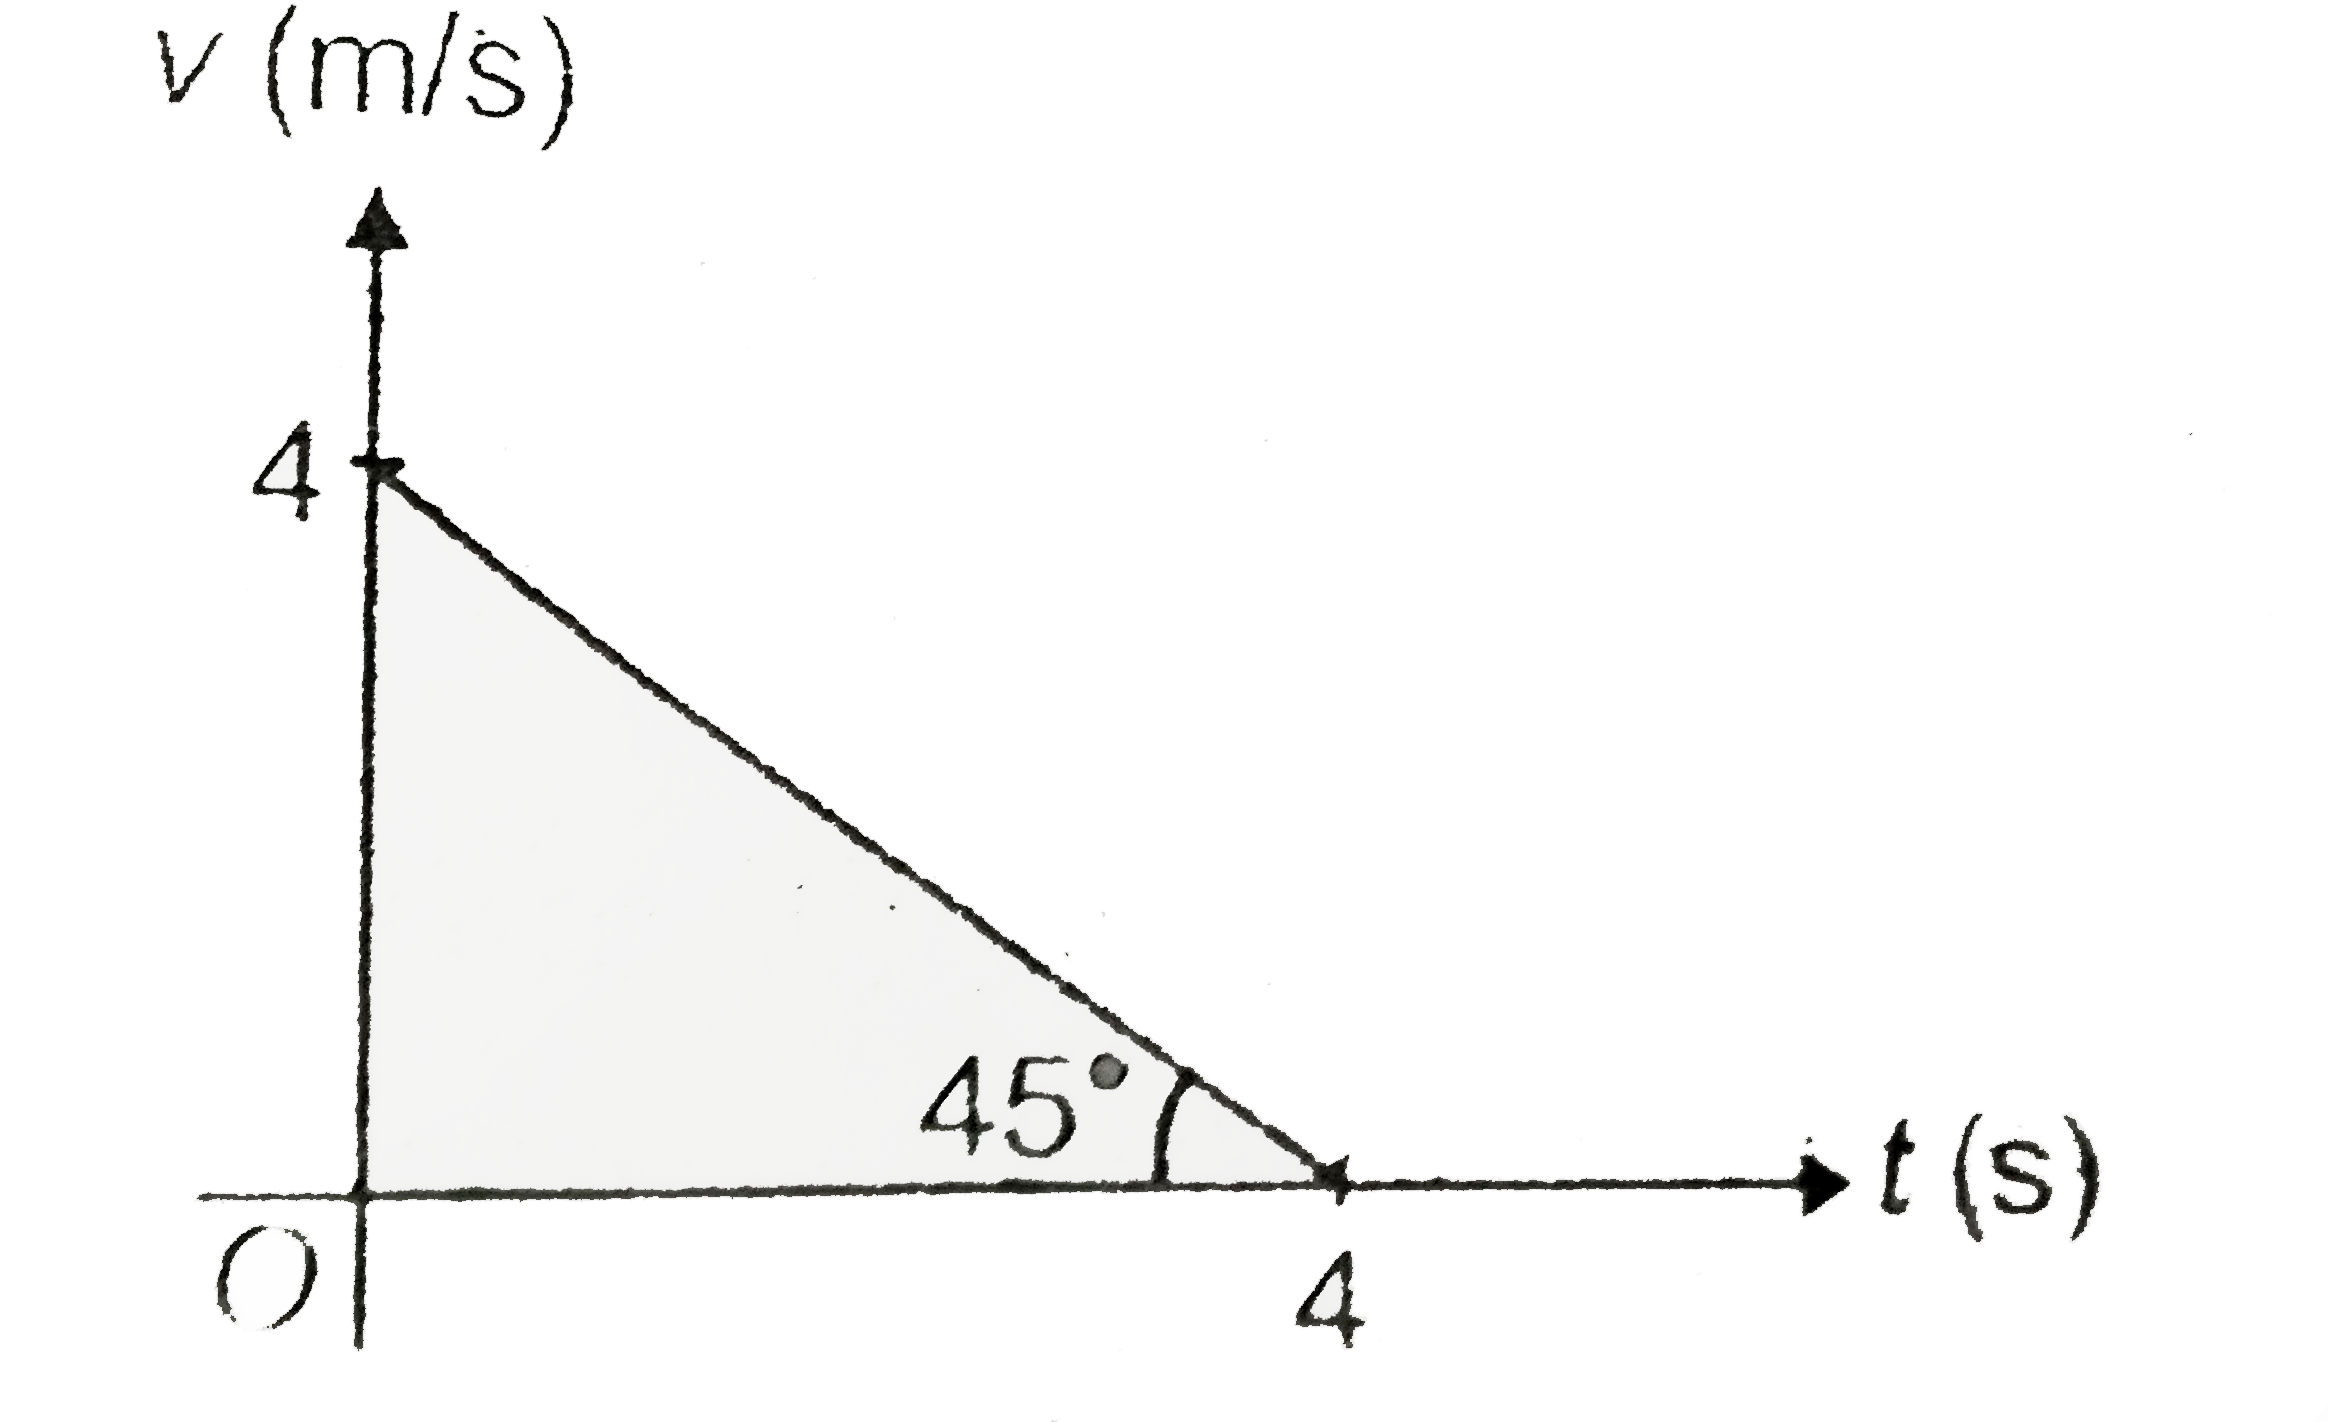
Draw the acceleration-time graph and position-time graph, given that at t = 0, particle is at origin.
View Solution
