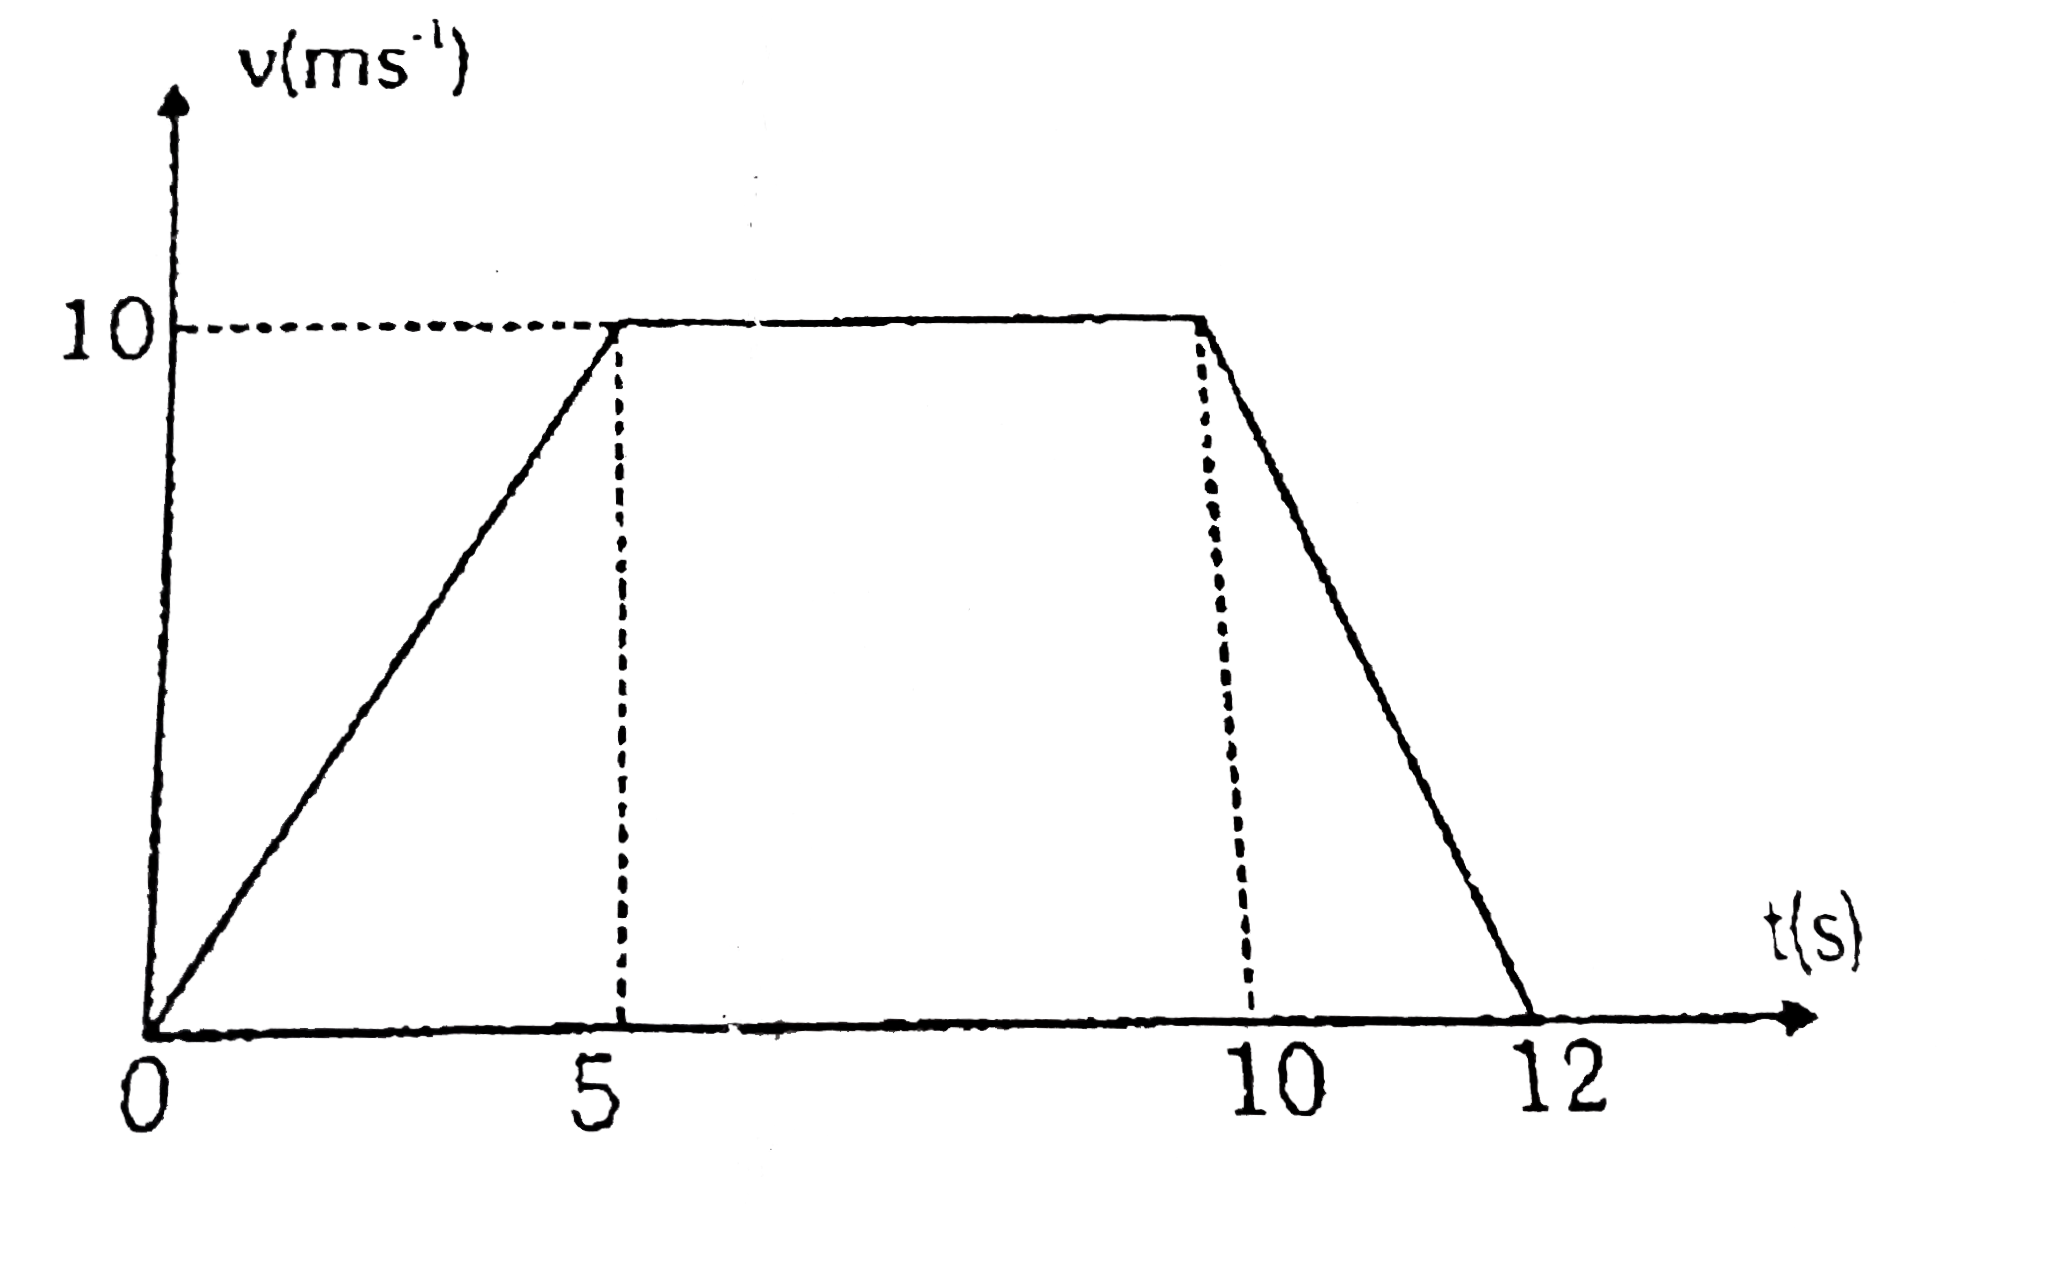
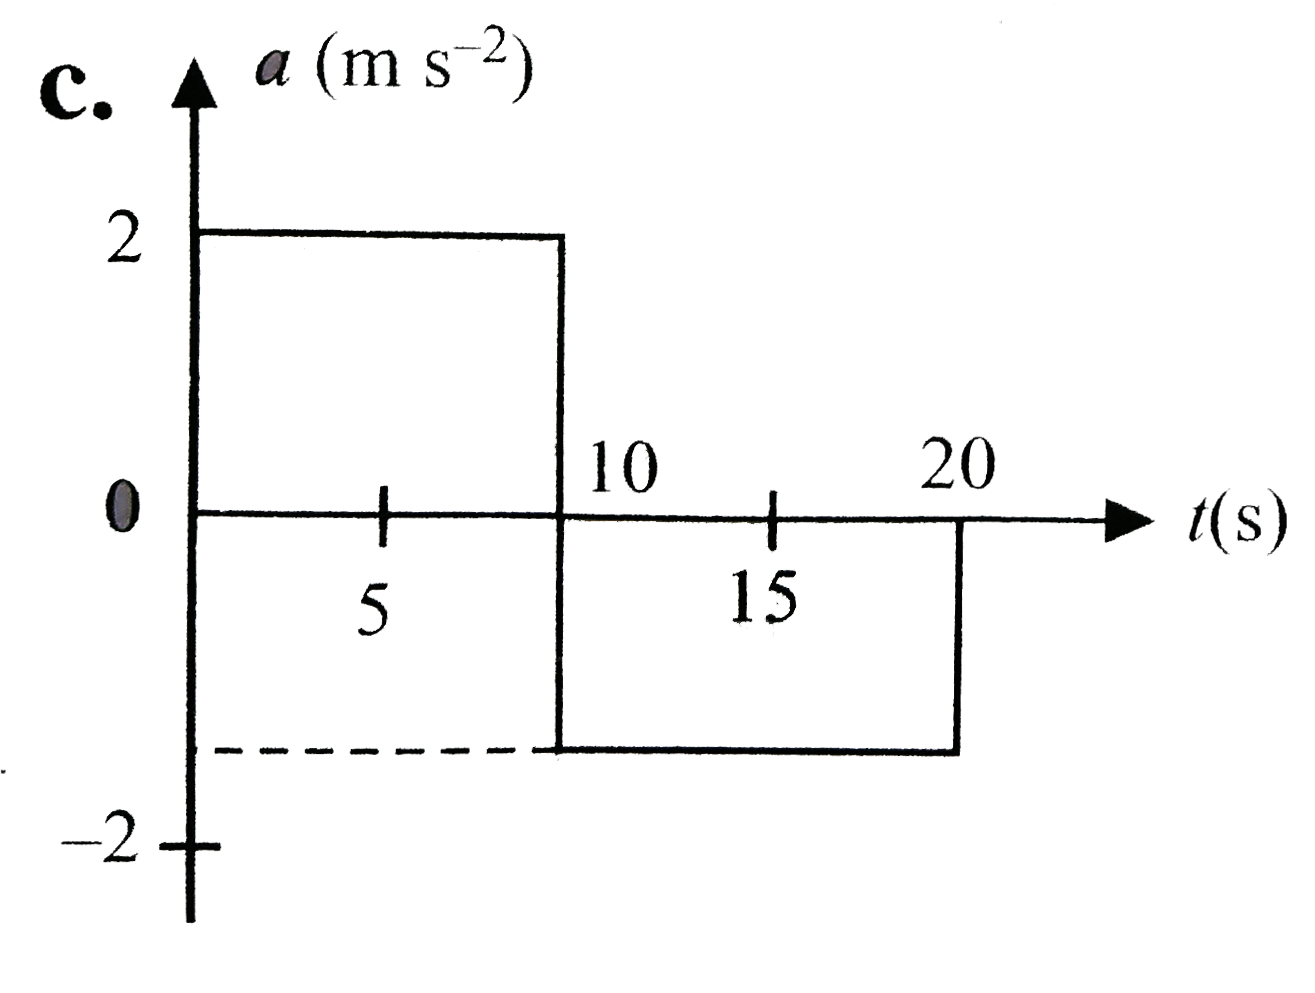
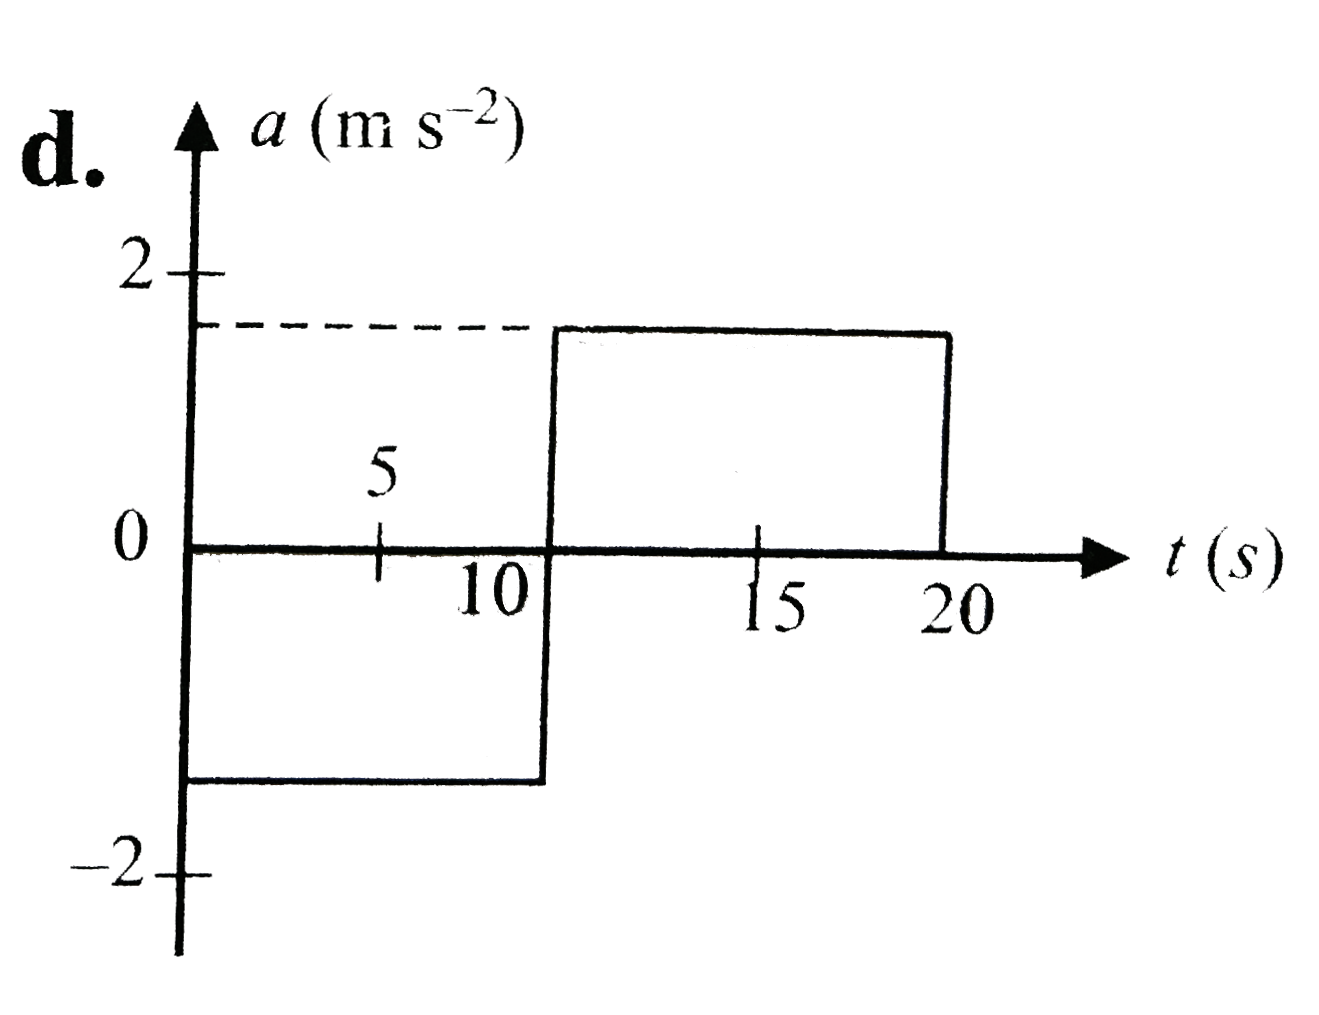
Plot the acceleration-time graph of the welocity-time graph given in.
 .
.
 .
.
 .
.
 .
.
 .
.
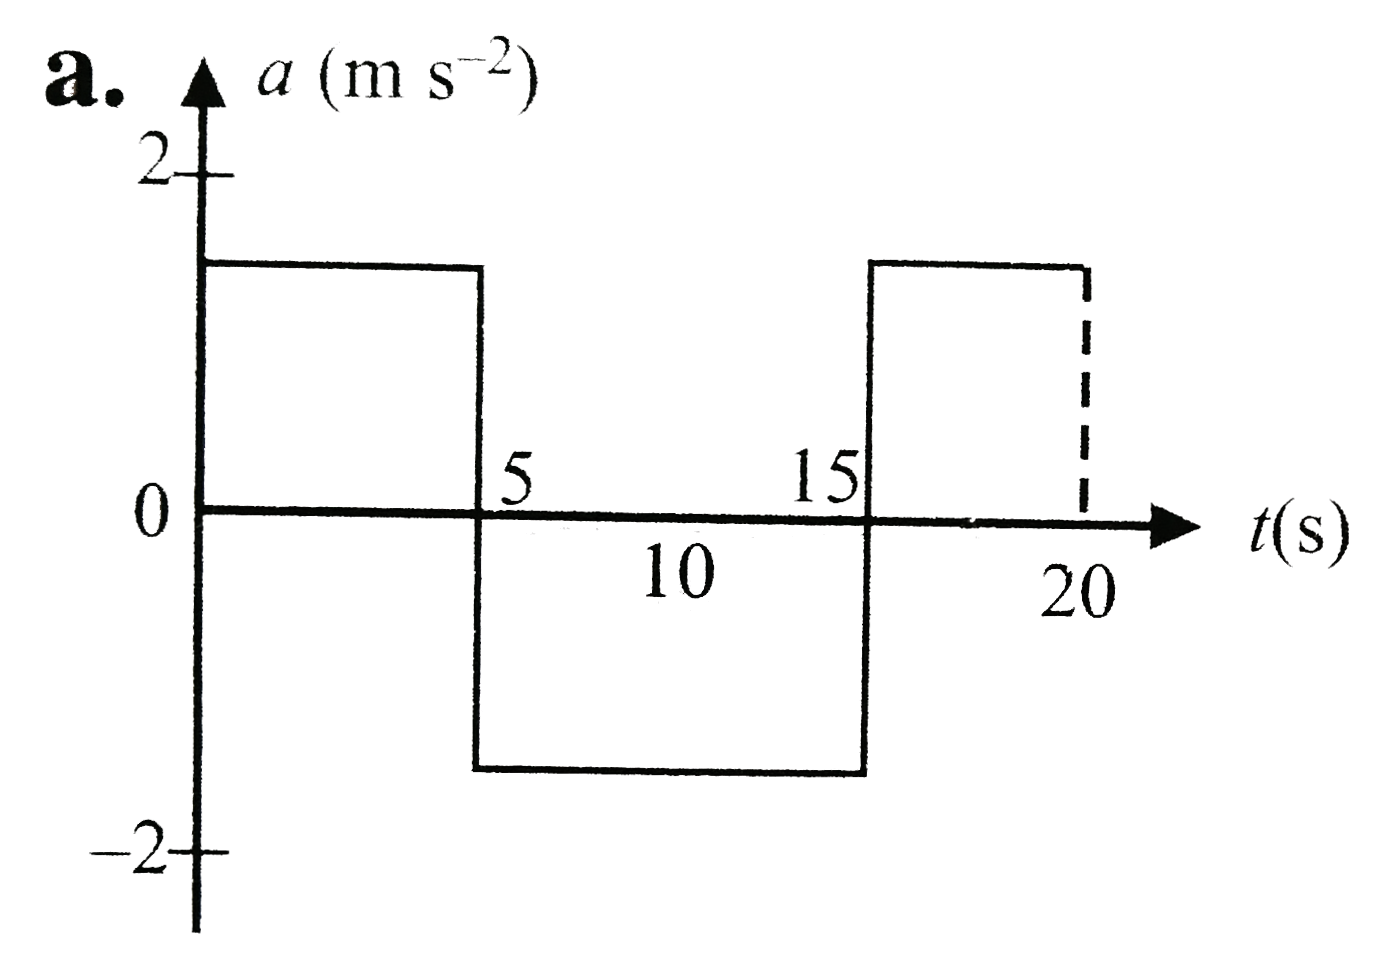
The correct Answer is:A
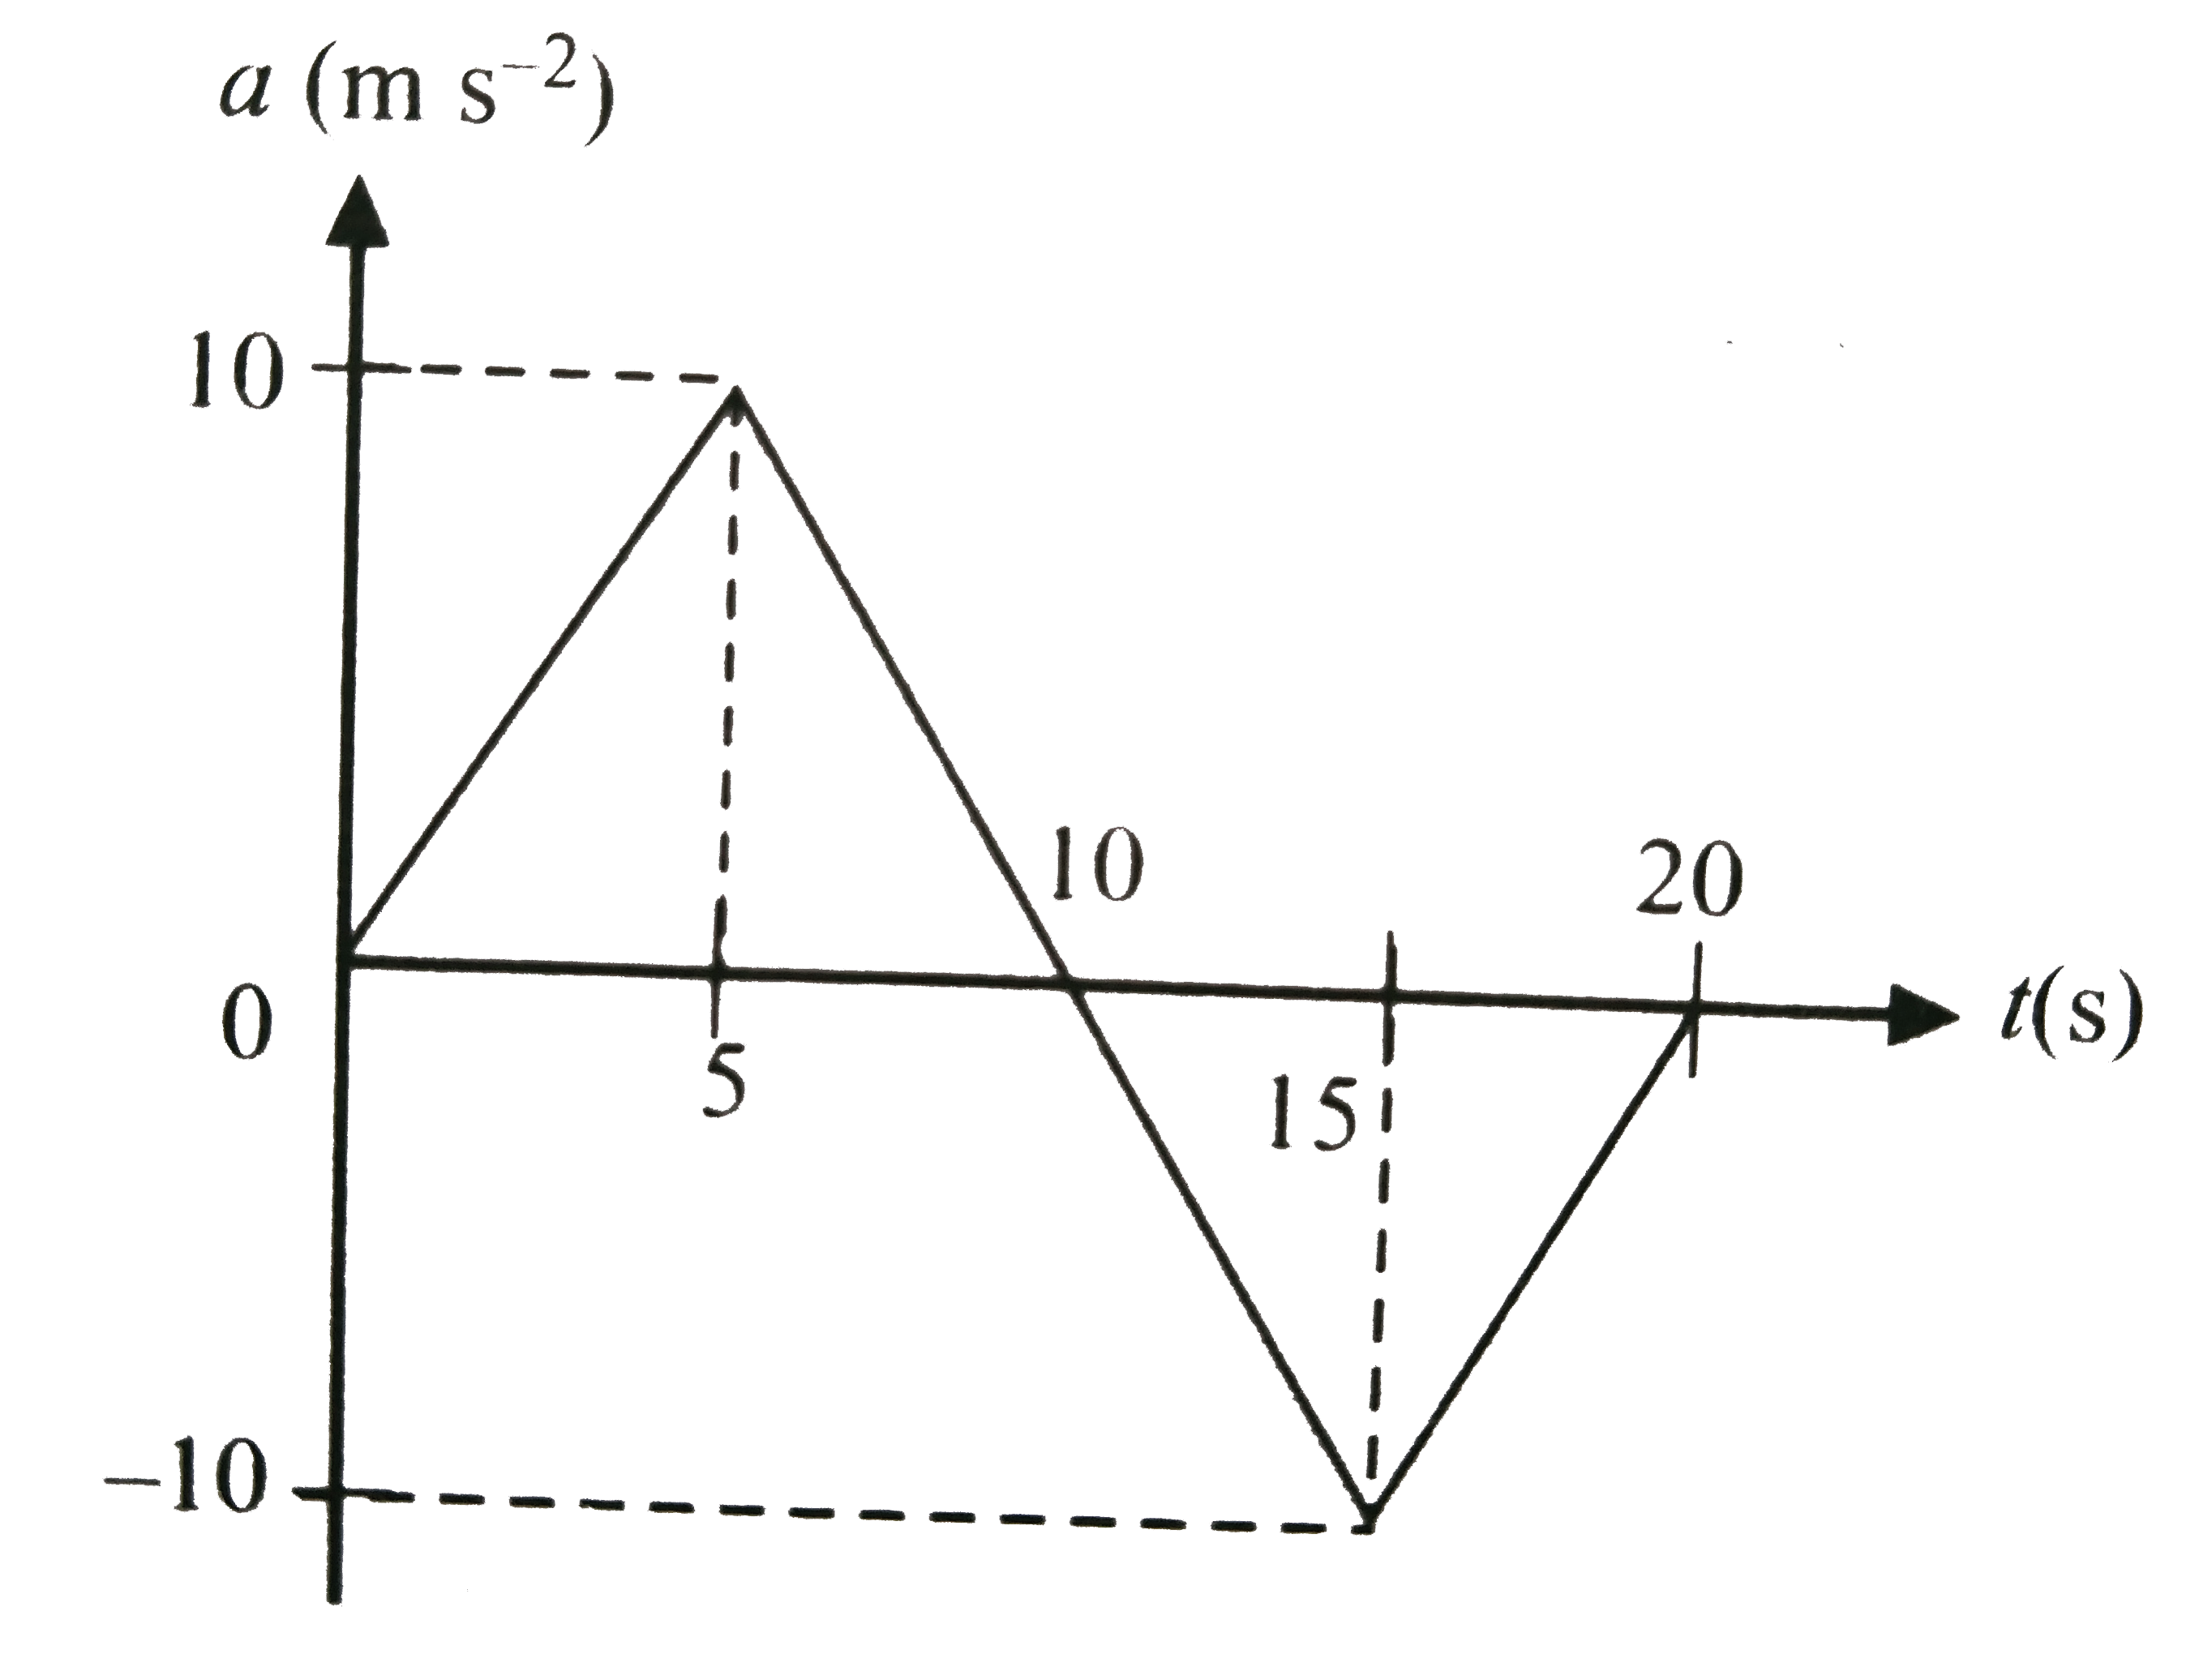
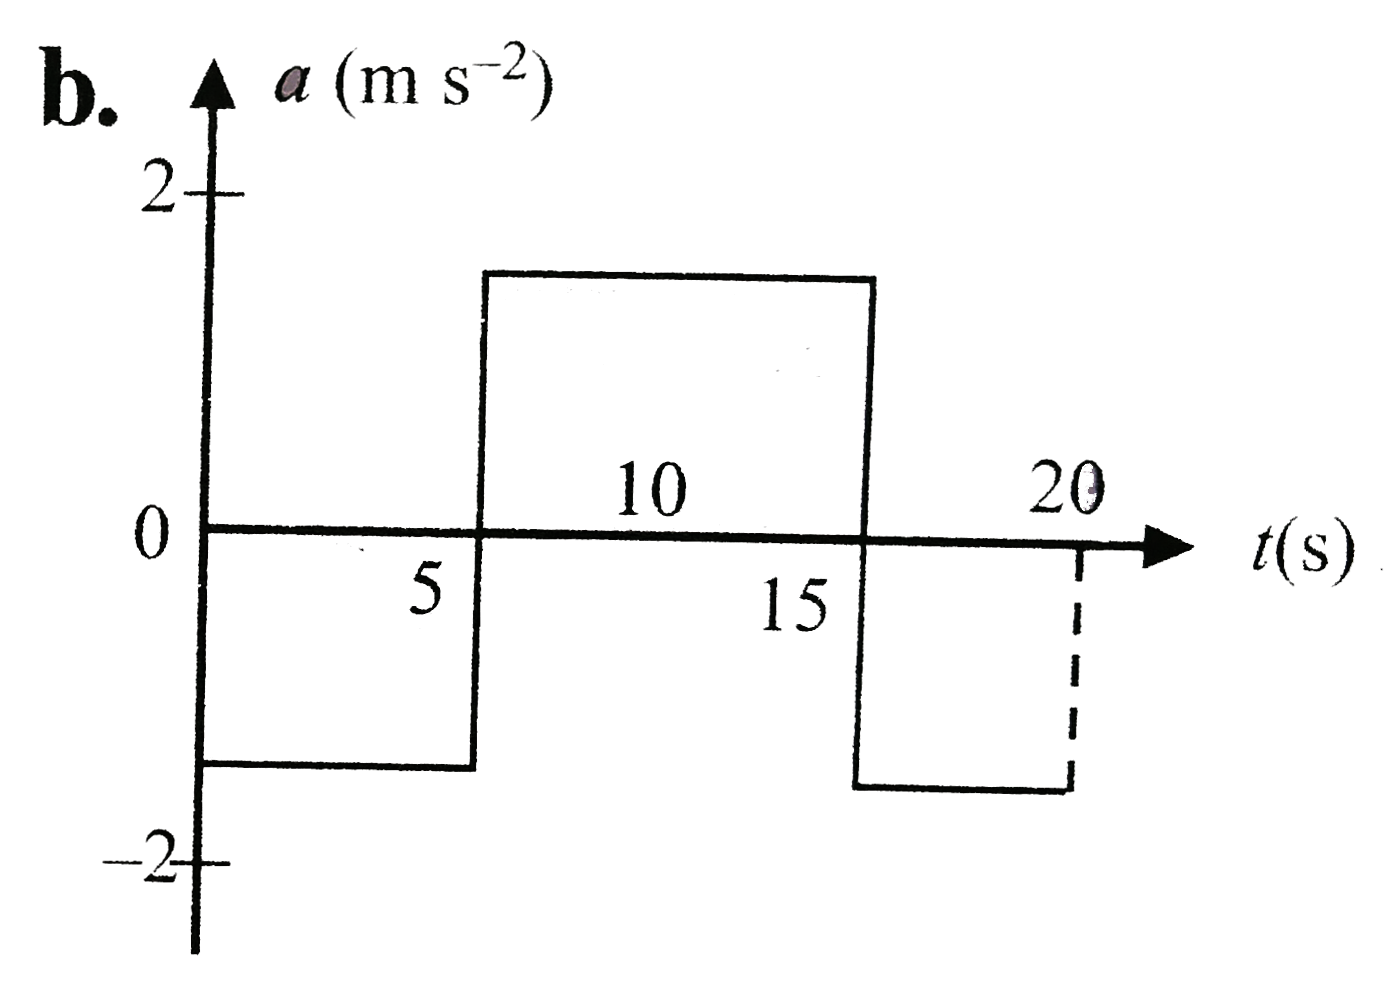
For 0 to 5s, acceleration is positive, for 5 to 15s acceleration is negative, for 15 to 20s acceleration is positive.
Topper's Solved these Questions
- KINEMATICS-1BOOK - CENGAGE PHYSICS ENGLISHCHAPTER - KINEMATICS-1EXERCISE - Graphical cancept
1 Videos
- KINEMATICS-1BOOK - CENGAGE PHYSICS ENGLISHCHAPTER - KINEMATICS-1EXERCISE - Multiple Correct
16 Videos
- KINEMATICS-1BOOK - CENGAGE PHYSICS ENGLISHCHAPTER - KINEMATICS-1EXERCISE - Single Correct
52 Videos
- GRAVITATIONBOOK - CENGAGE PHYSICS ENGLISHCHAPTER - GRAVITATIONEXERCISE - INTEGER_TYPE
1 Videos
- KINEMATICS-2BOOK - CENGAGE PHYSICS ENGLISHCHAPTER - KINEMATICS-2EXERCISE - Exercise Integer
9 Videos
Similar Questions
Knowledge Check
The area under acceleration-time graph gives
Aintial velocityBfinal velocityCchange in velocityDdistance travelledAssertion : For a particle, acceleration-time graph gives the velocity.
Reason : Rate of change of velocity is acceleration.AIf both assertion and reason are trure and reason is the correct explanation of assertion.BIf both assertion and reason are true but reason is not the correct explanations of assertion.CIf assertion is true but reason is false.DIf both assertion and reason is false
The velocity-time graph is given below
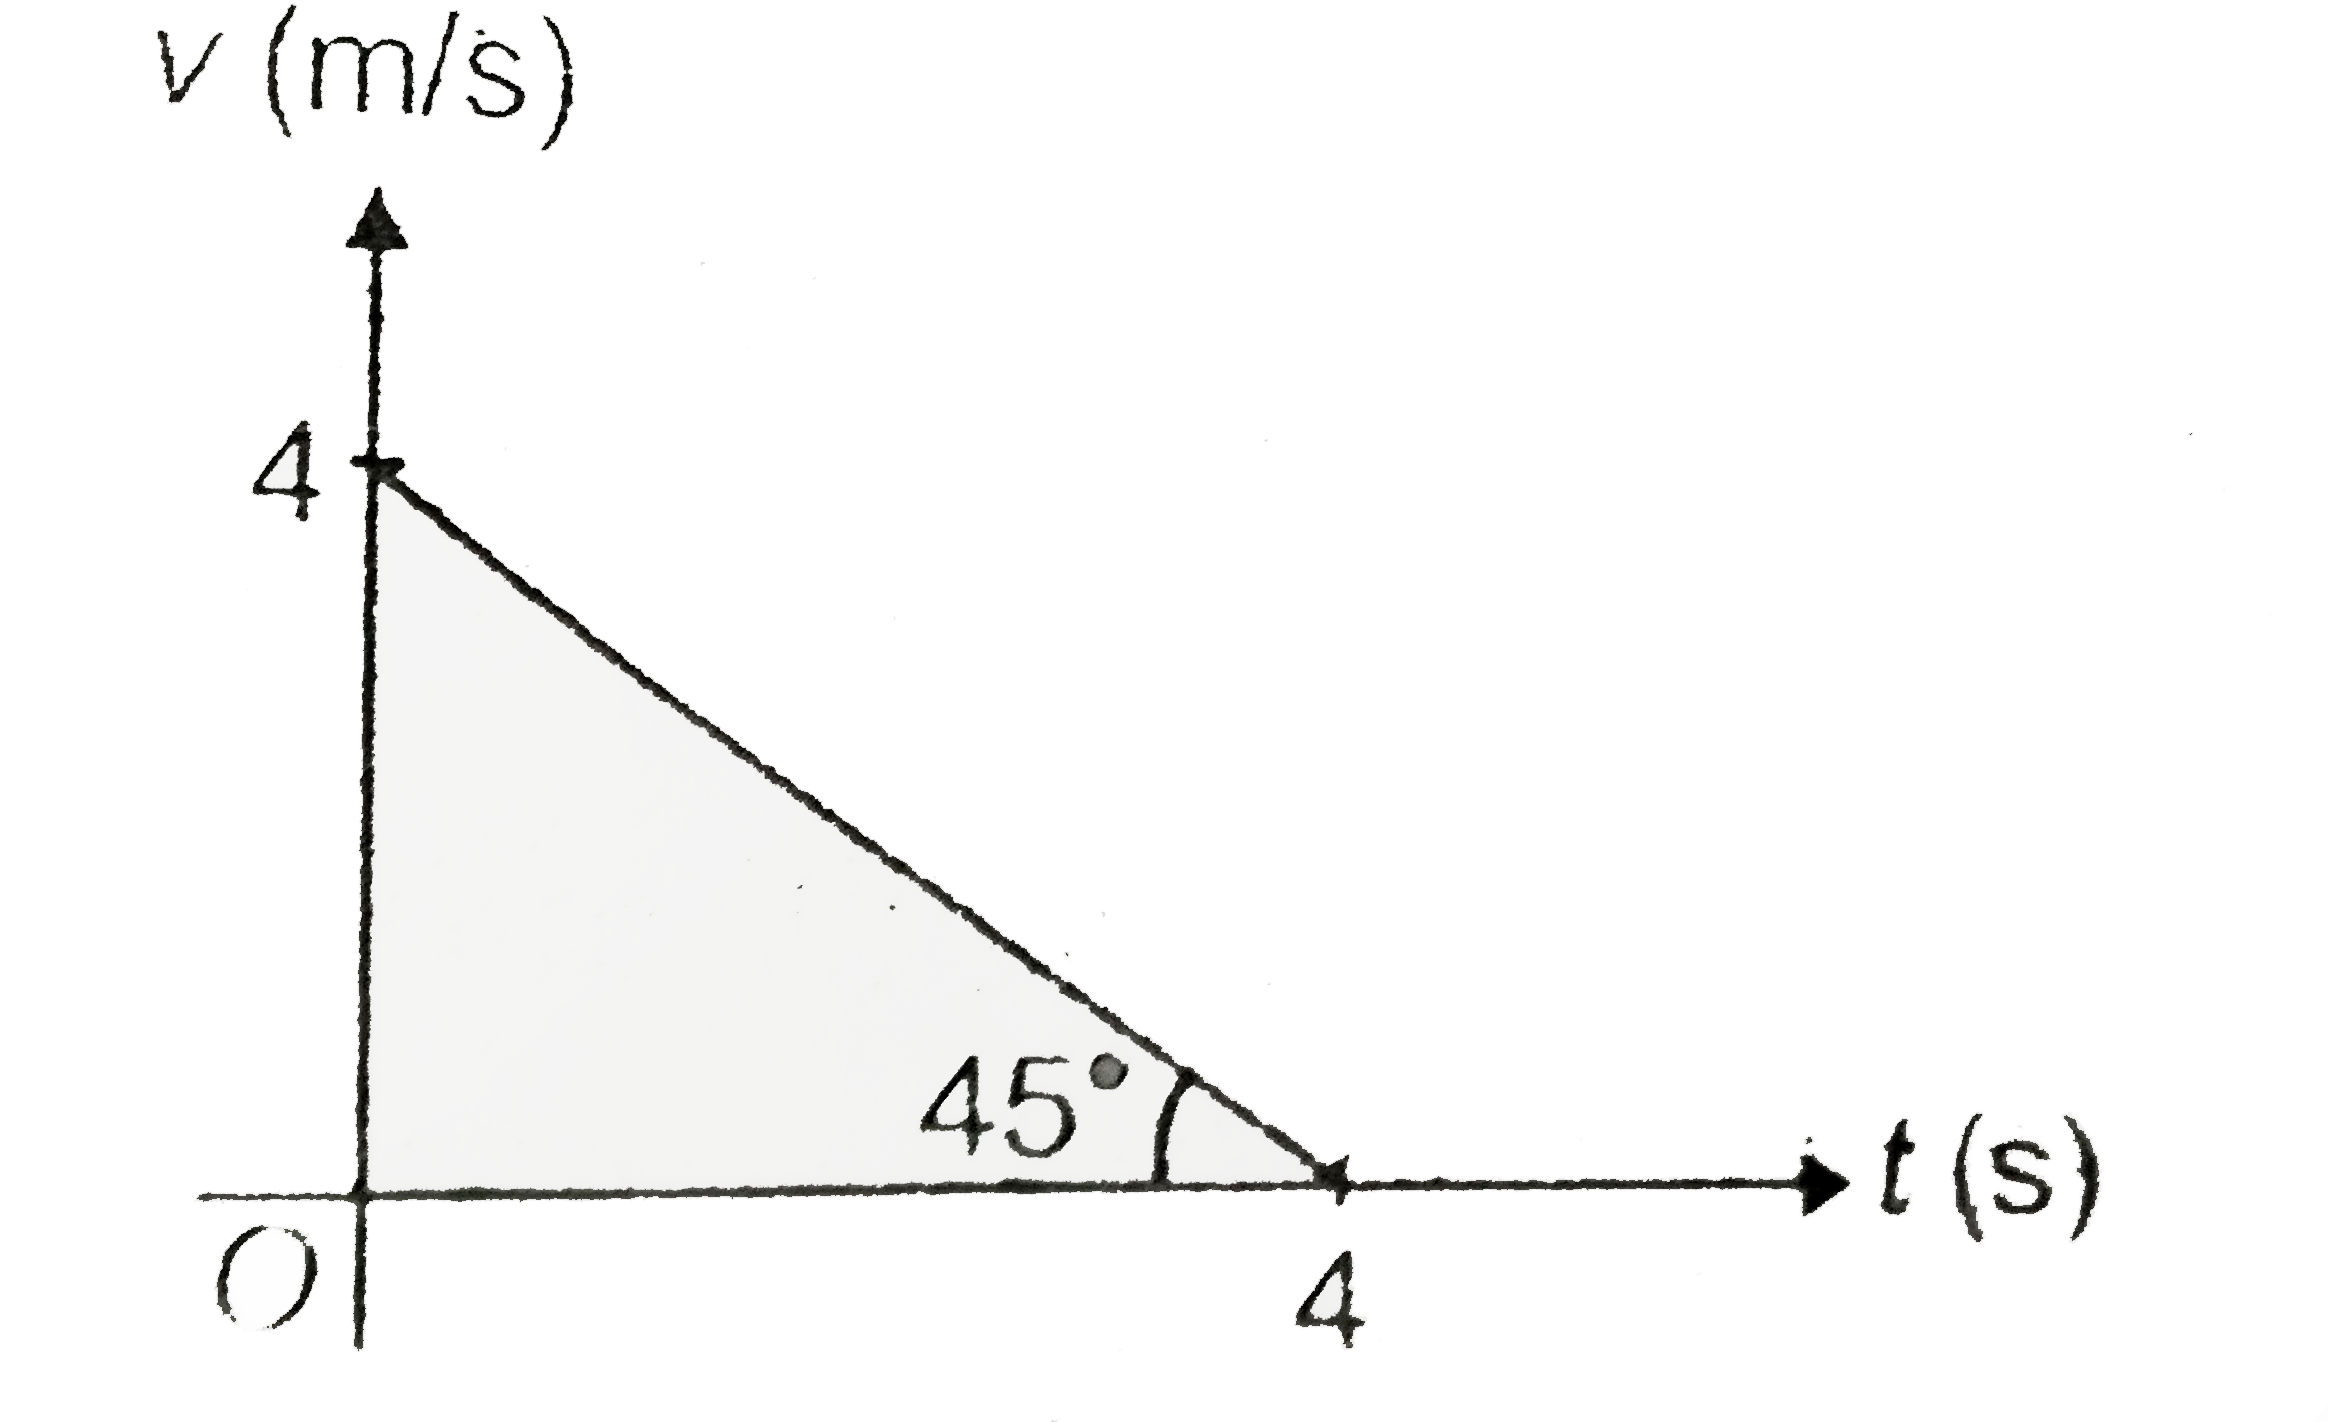
Draw the acceleration-time graph and position-time graph, given that at t = 0, particle is at origin.
View SolutionWhich of the following graph for a body moving along a straight line is possible ?
View SolutionA car starting from rest, accelerates at a rate of 2 m s−2 for 5 s. For this journey, (a) draw the velocity-time graph (b) draw the displacementtime graph using the velocity-time graph in part (a).
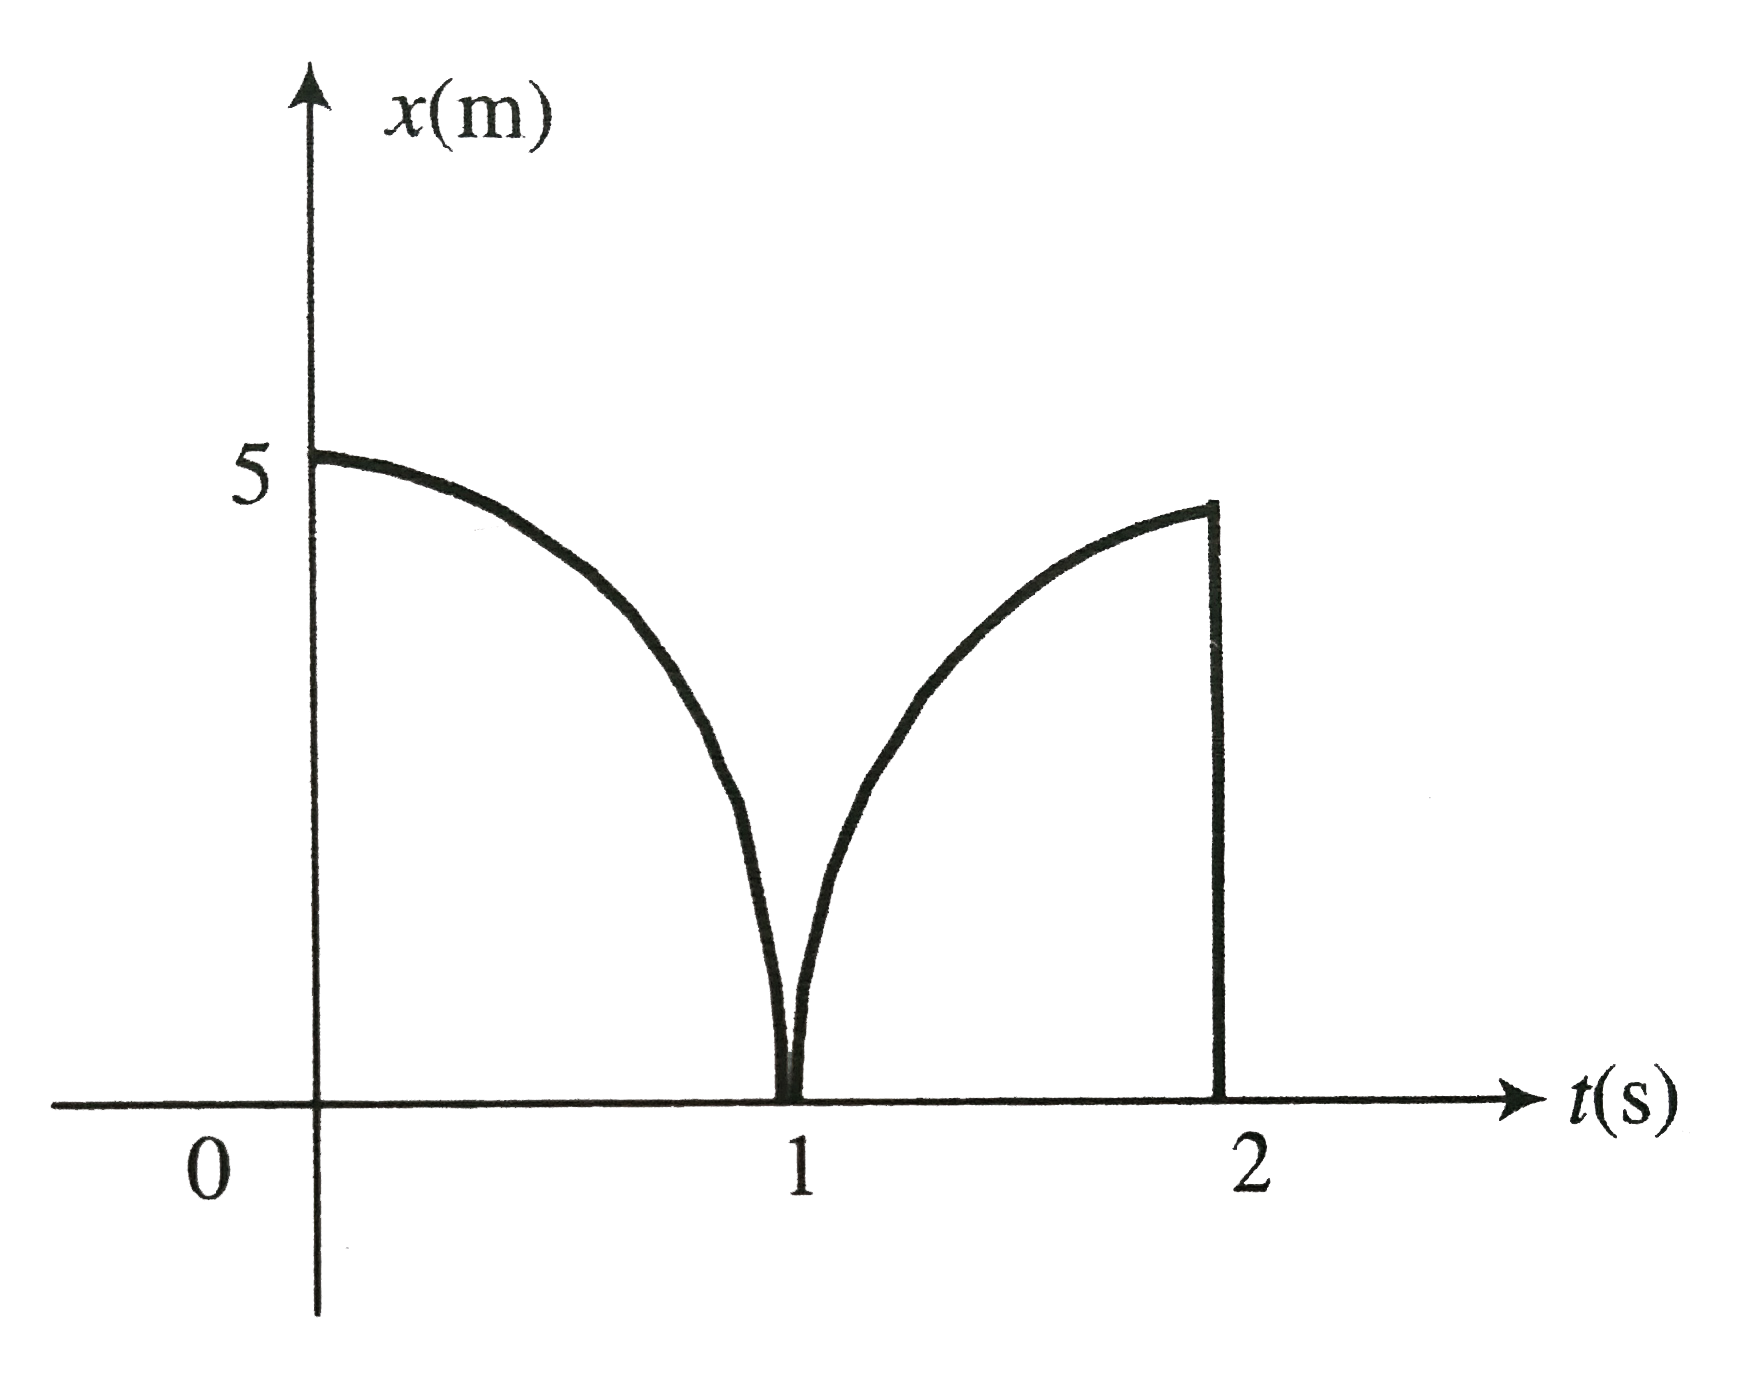
View SolutionThe displacement-time graph of a moving particle with constant acceleration is shown in. The velocit-time is given by
 .
.
View SolutionThe area under acceleration-time graph gives
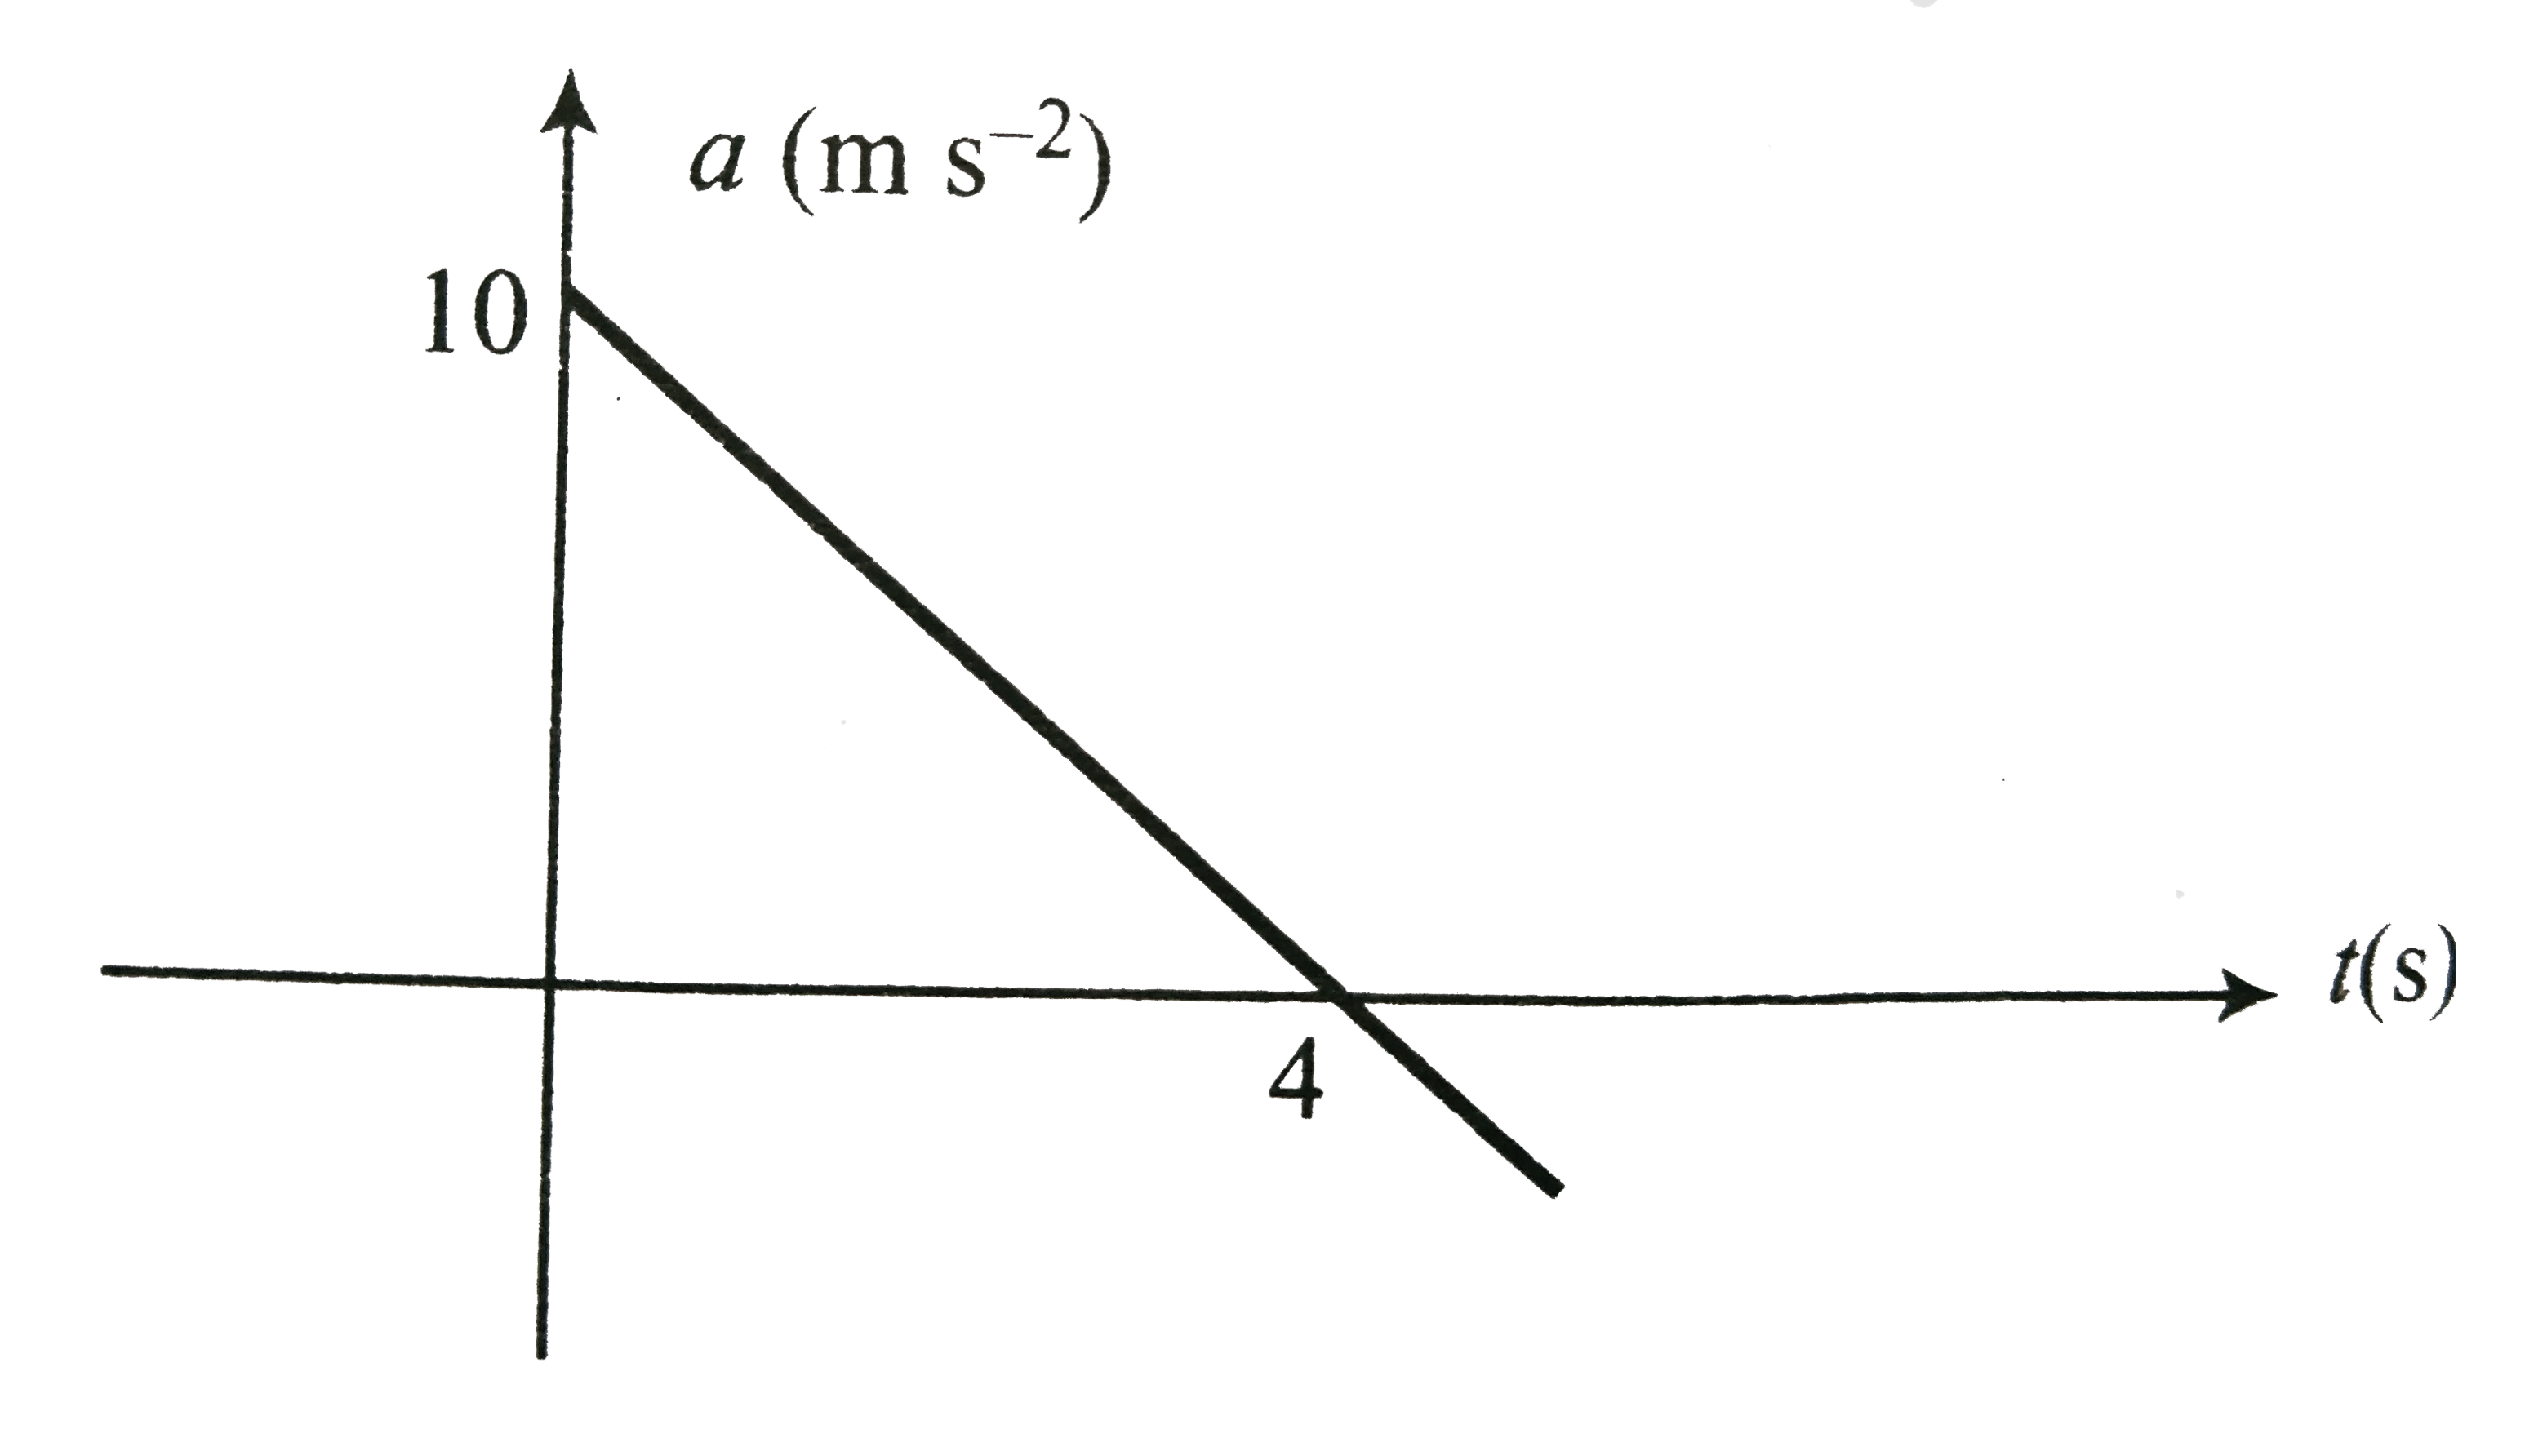
View SolutionThe acceleration-time graph of a particle moving along a straight line is as shown in. At what time the particle acquires its initial velocity?
 .
.
View Solution


