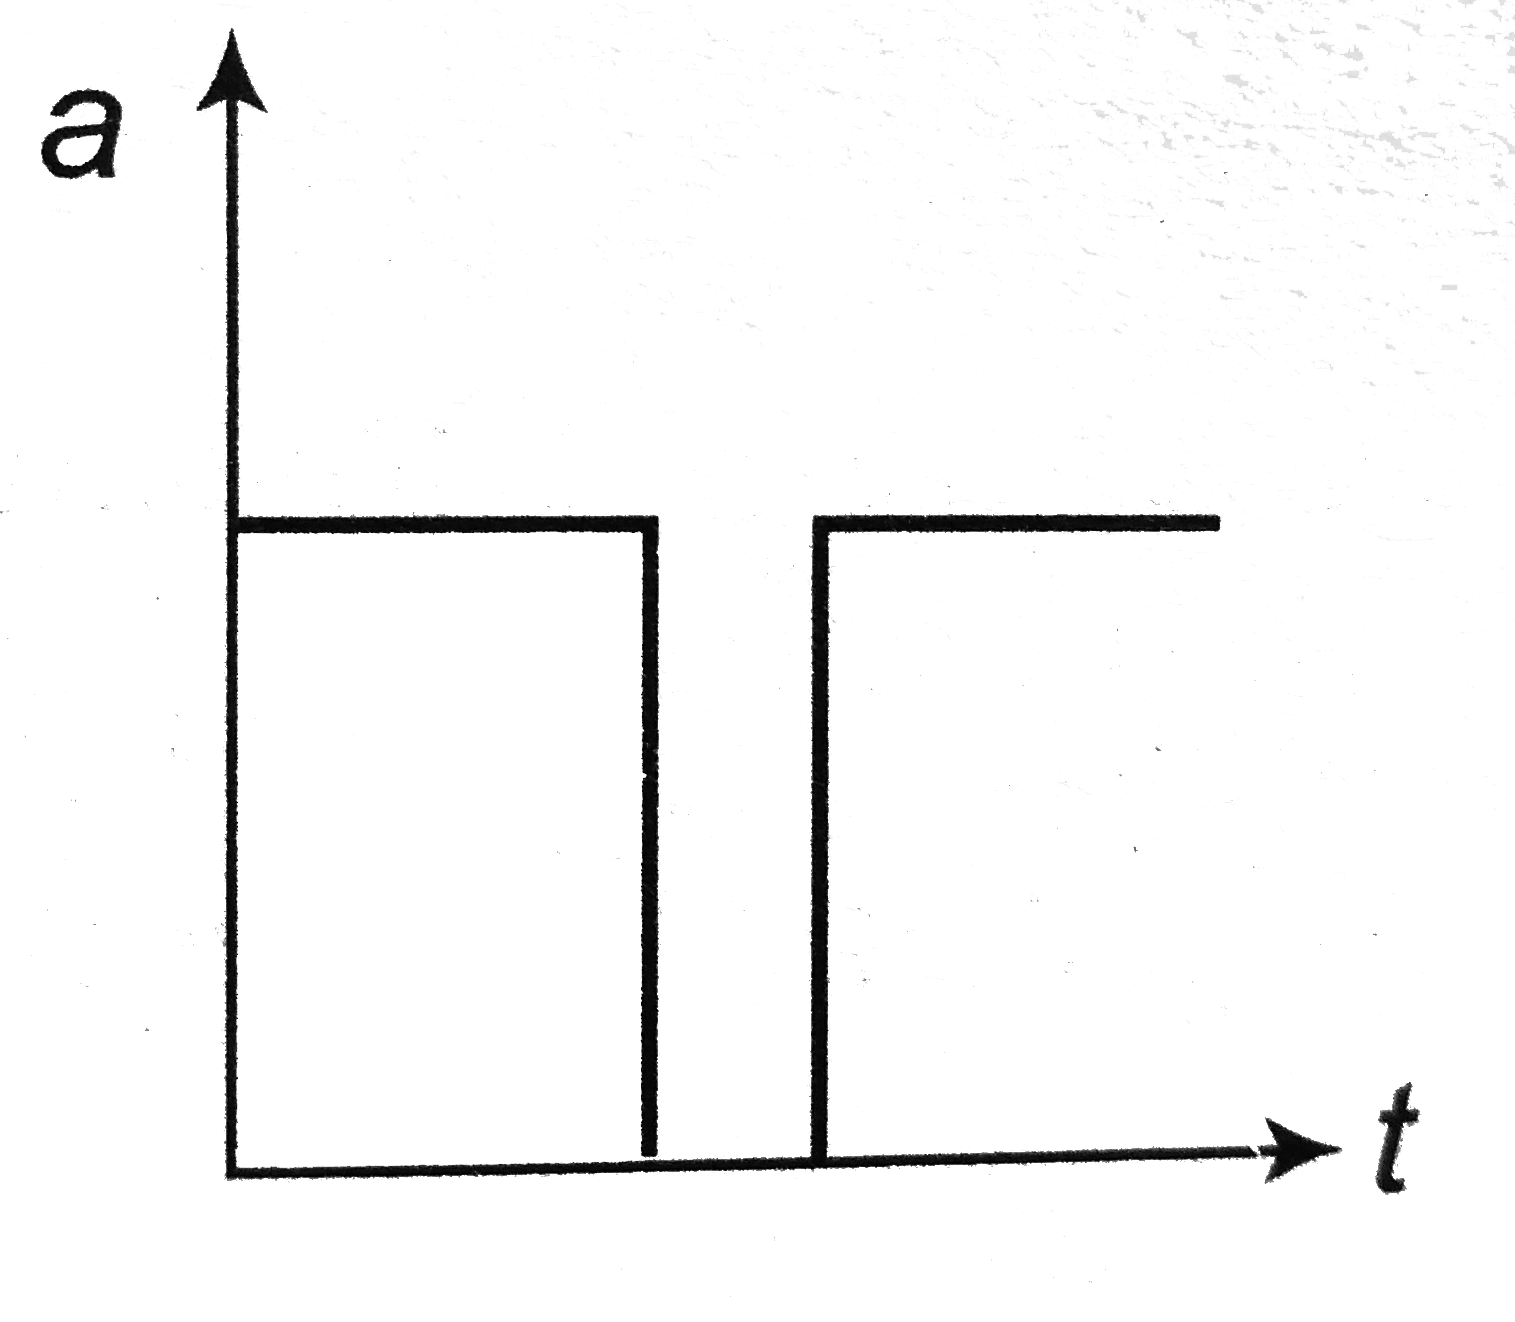
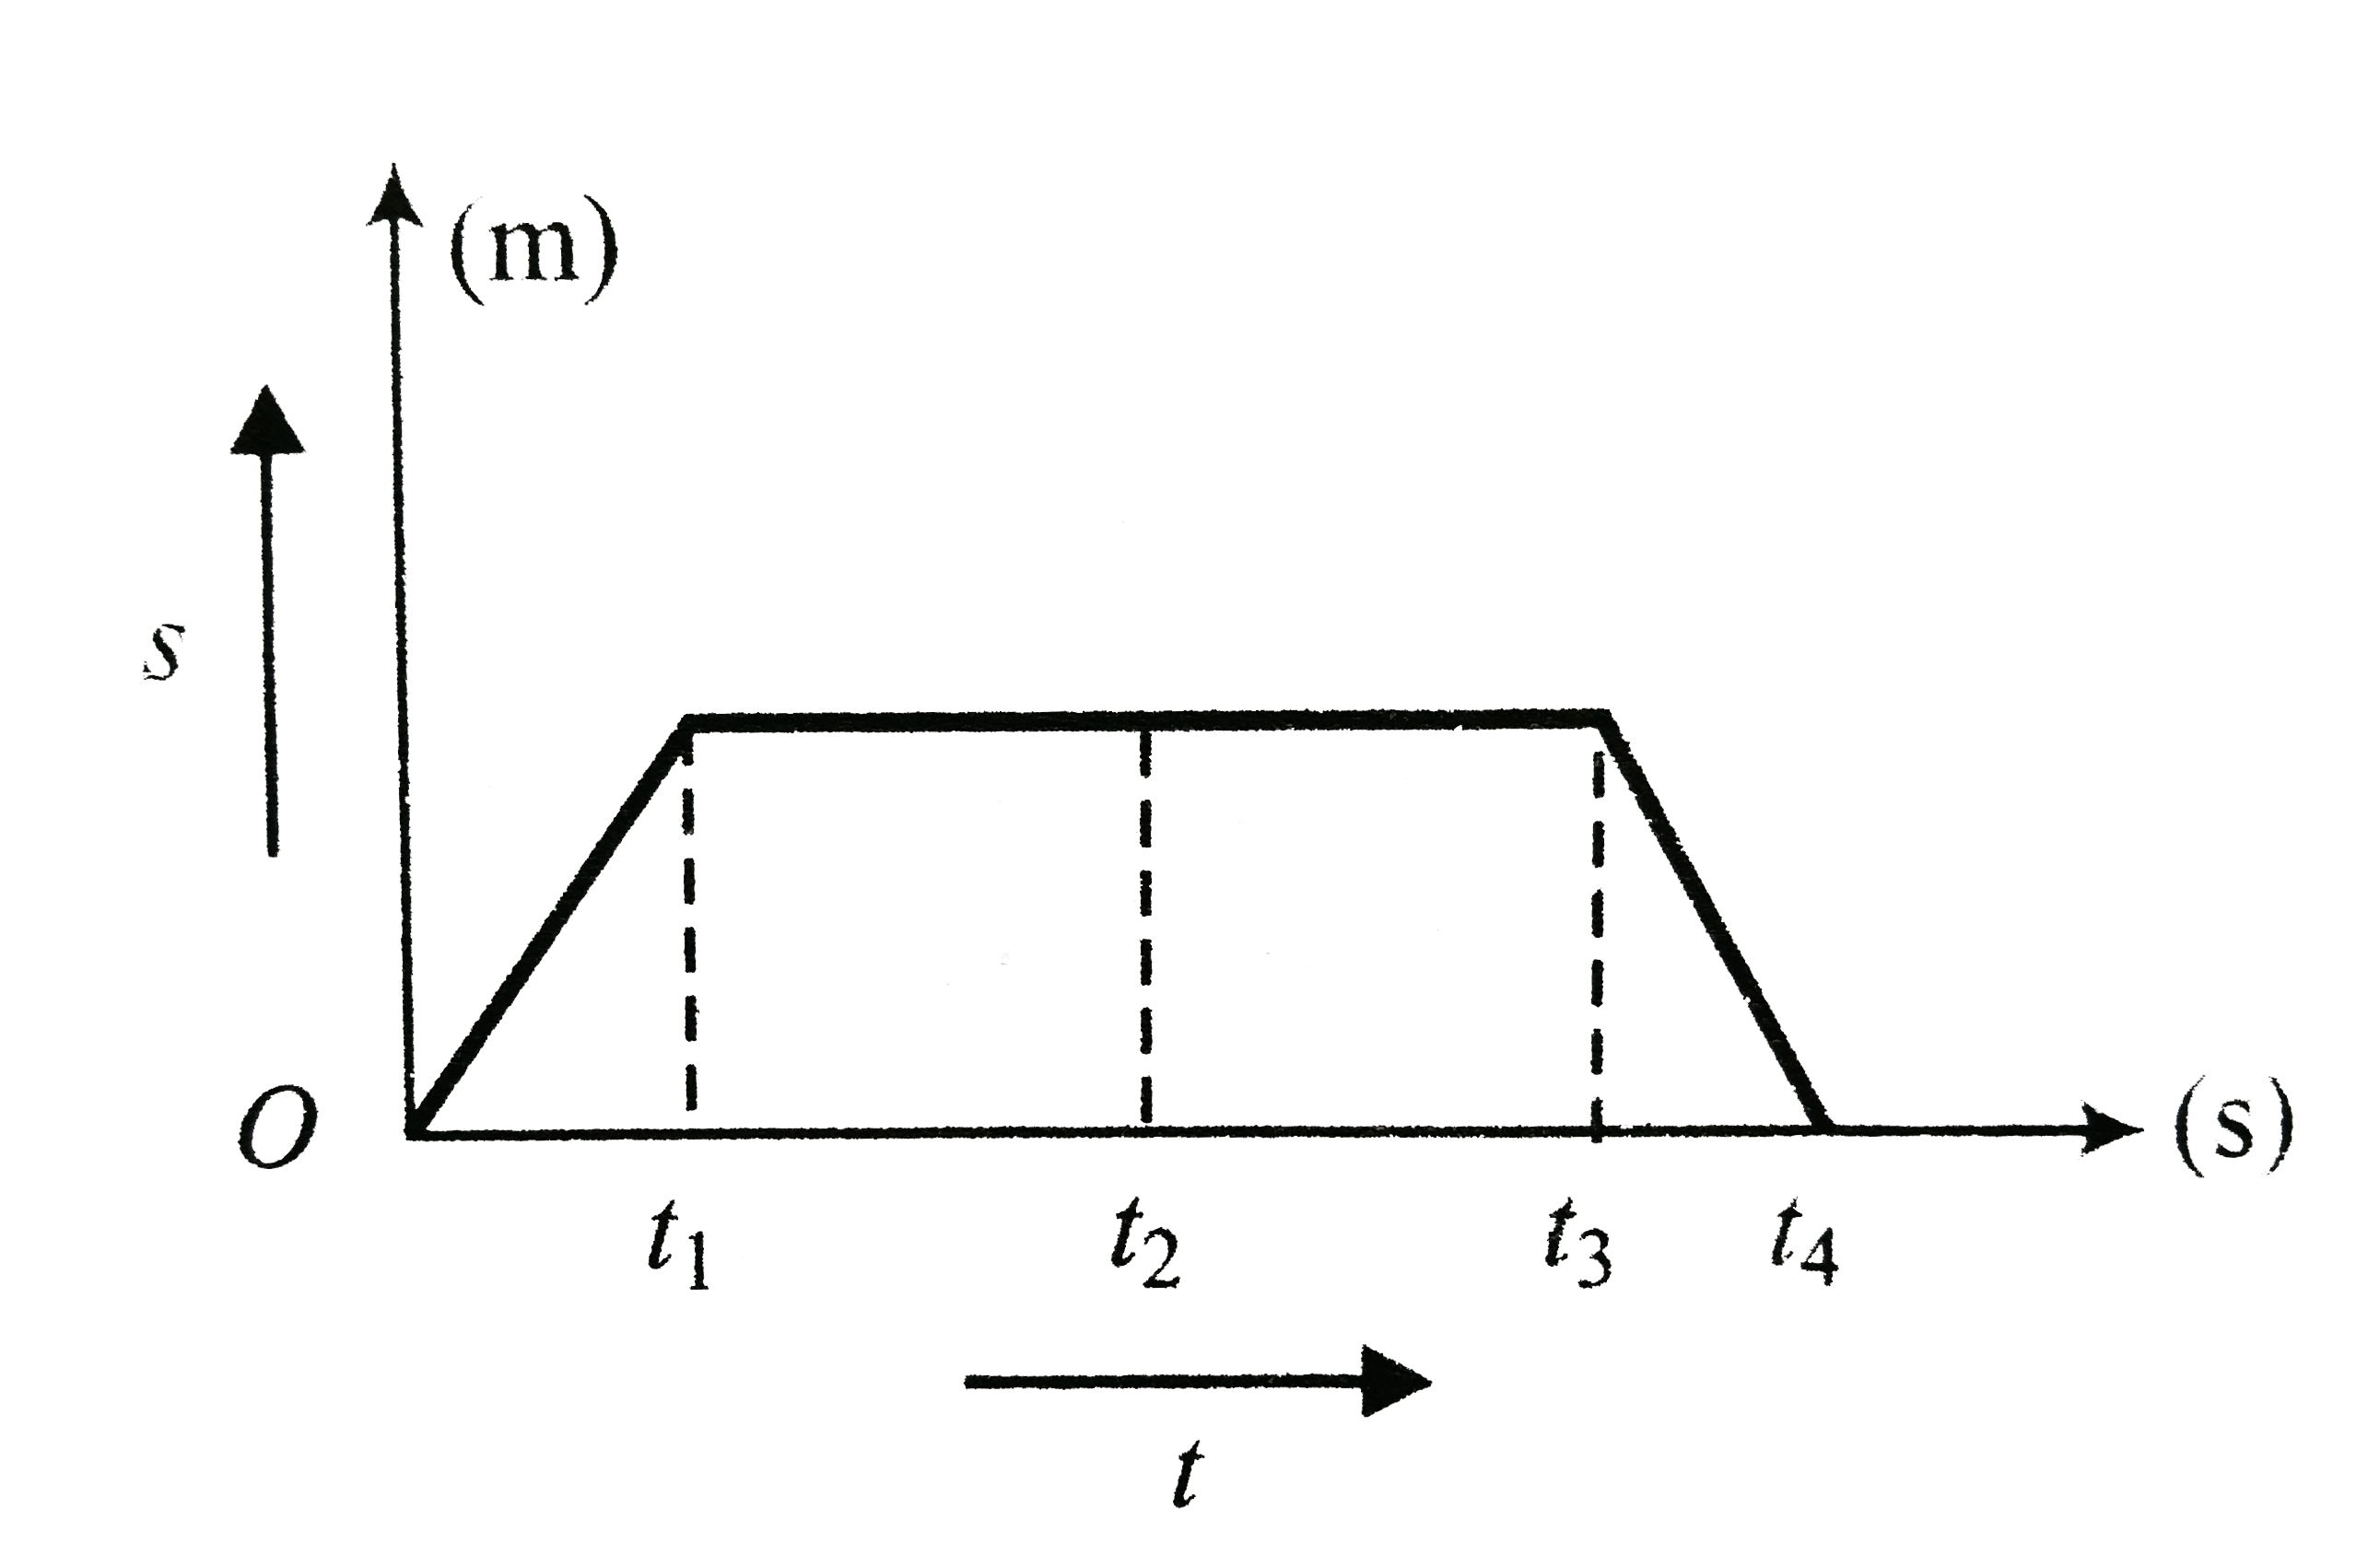
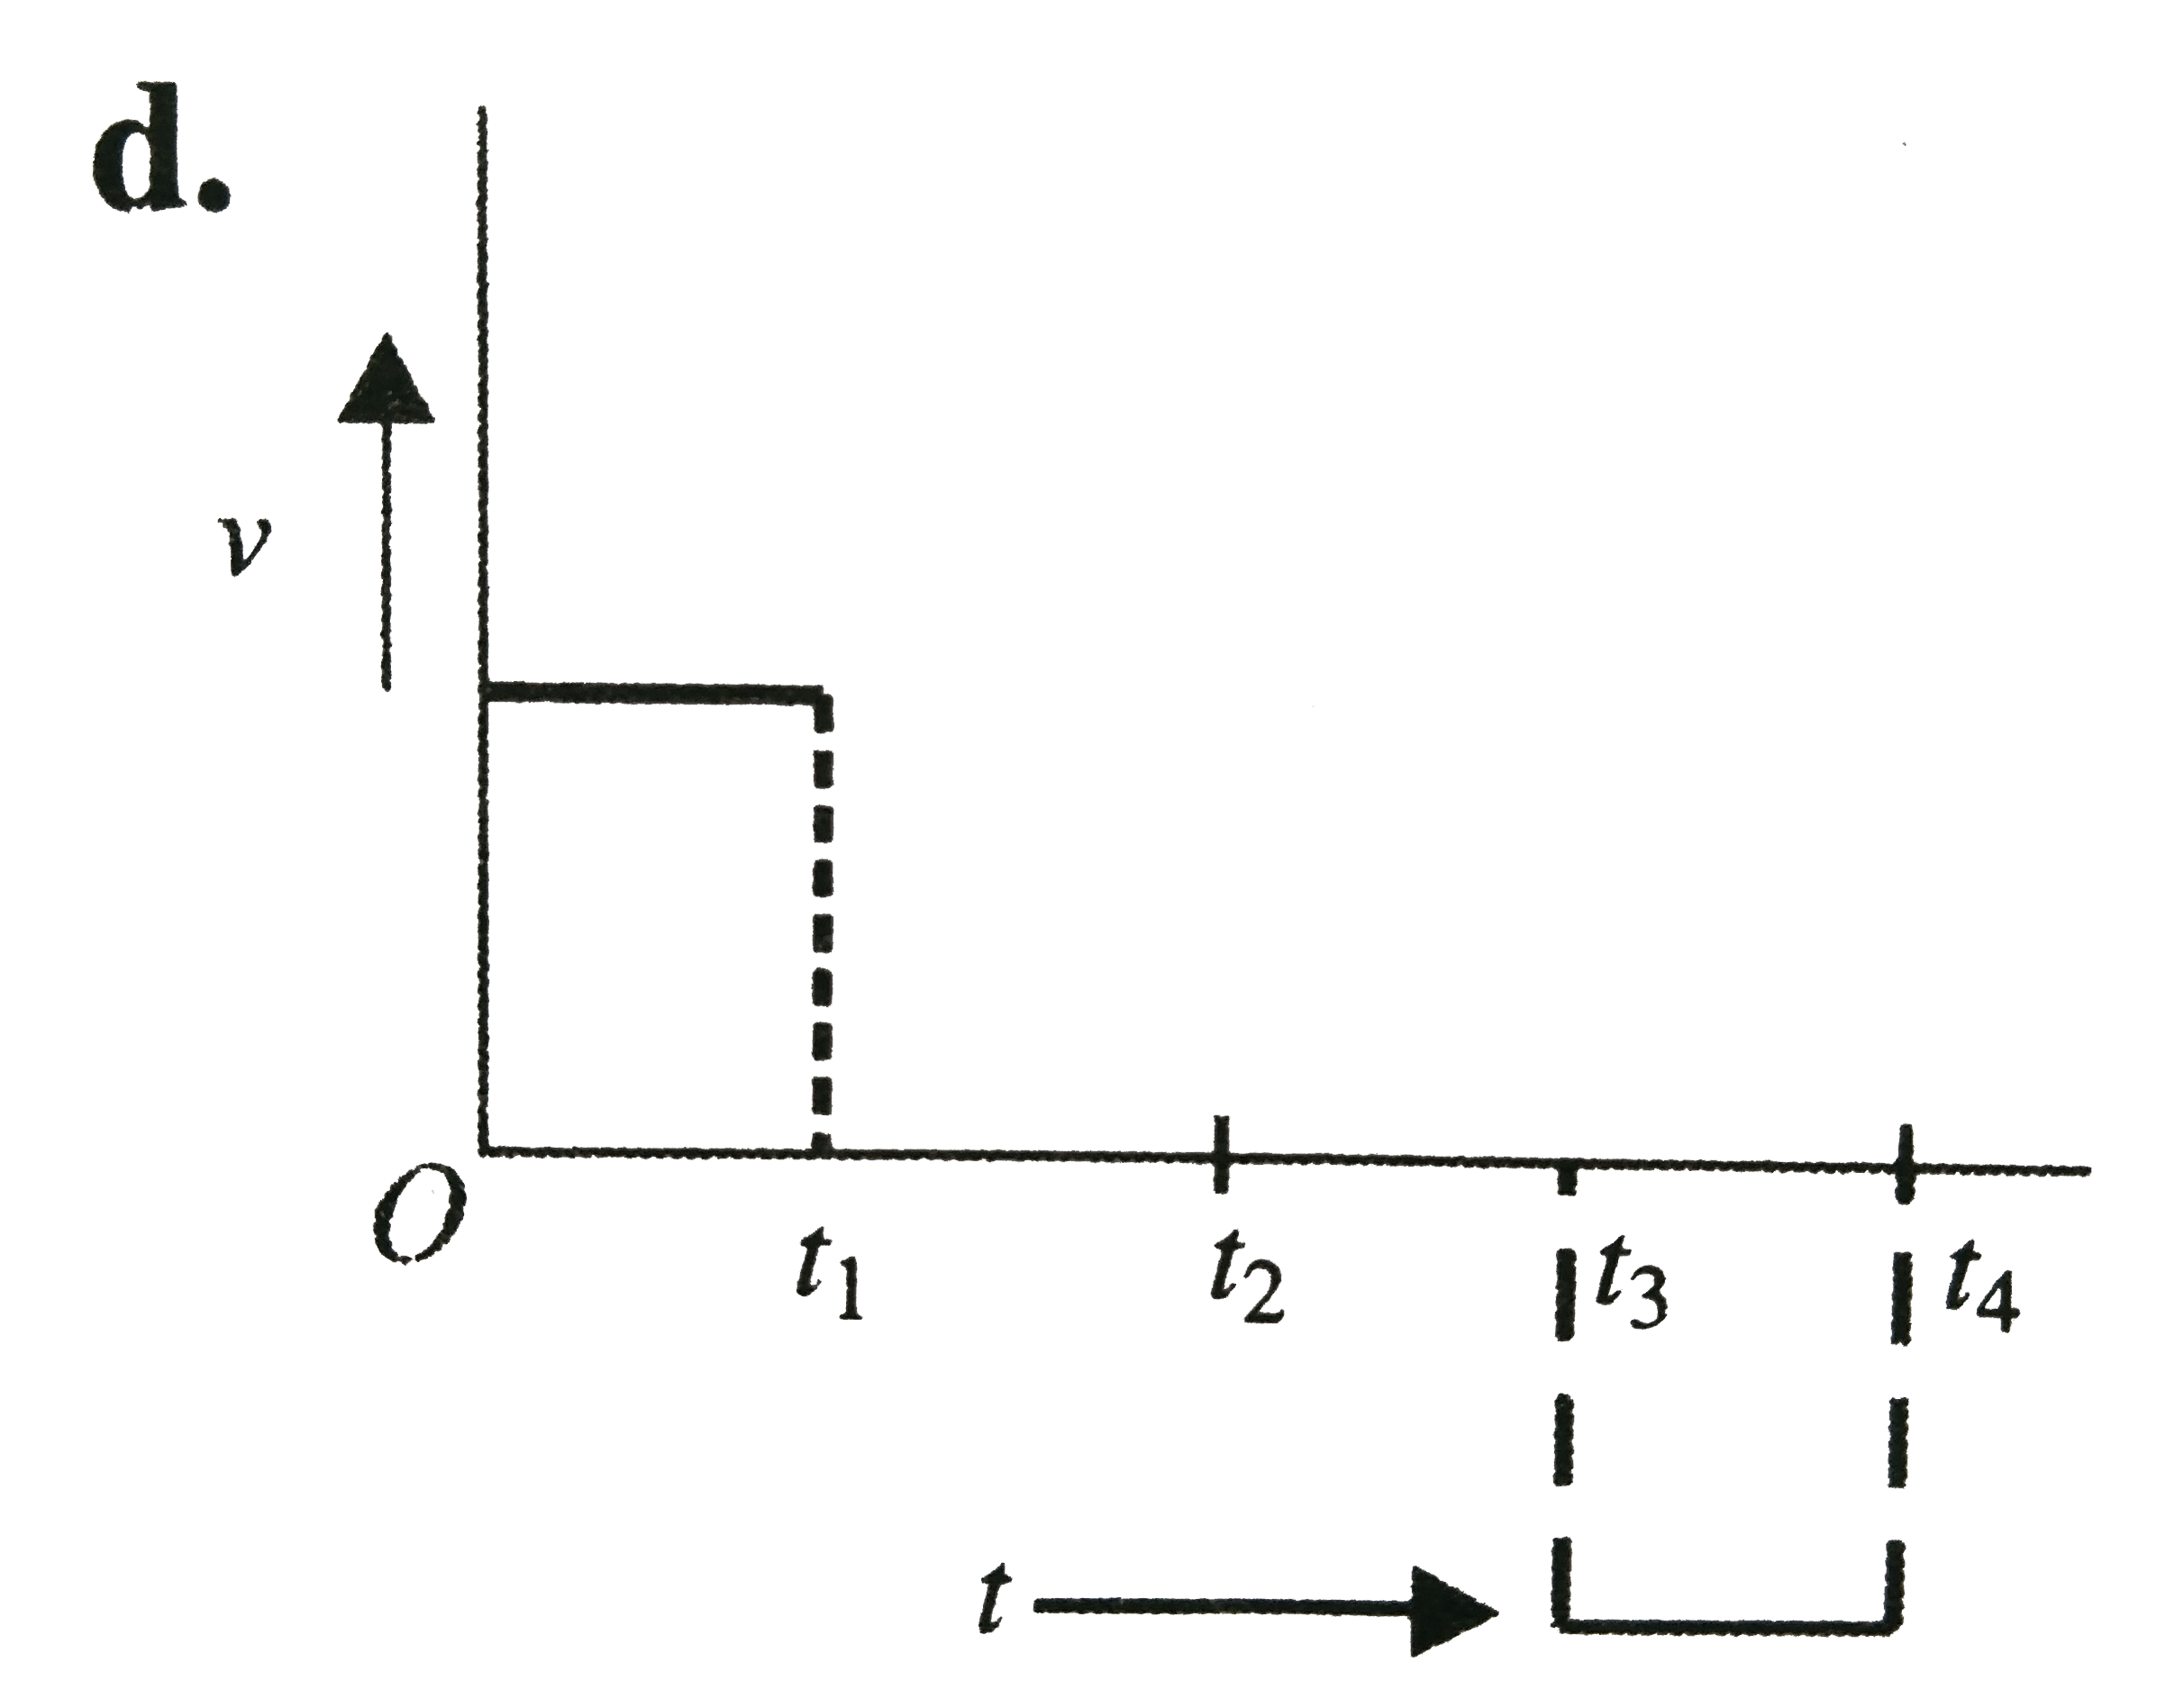
The displacement-time graph of a body is shown in.
 .
.
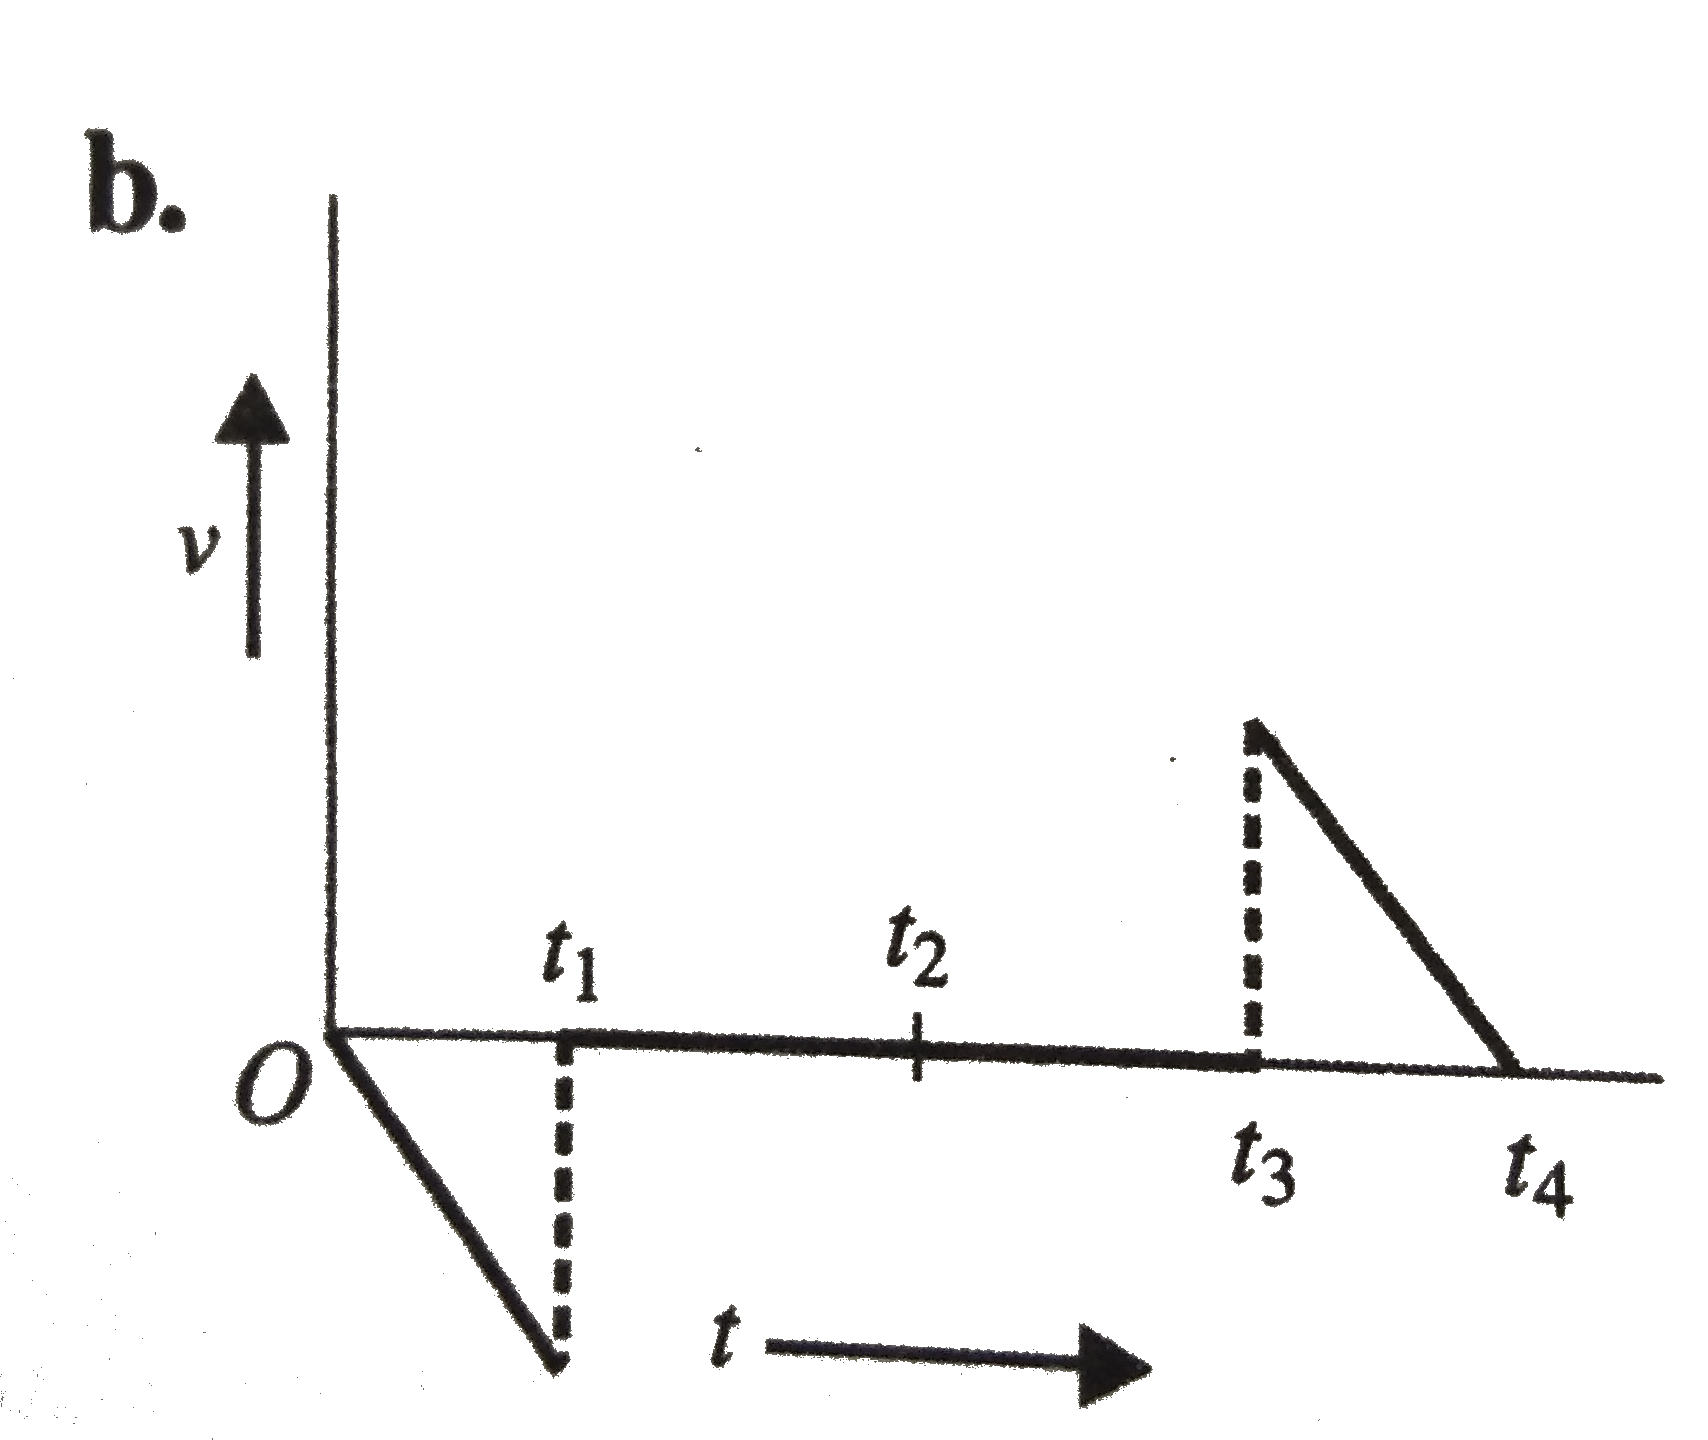
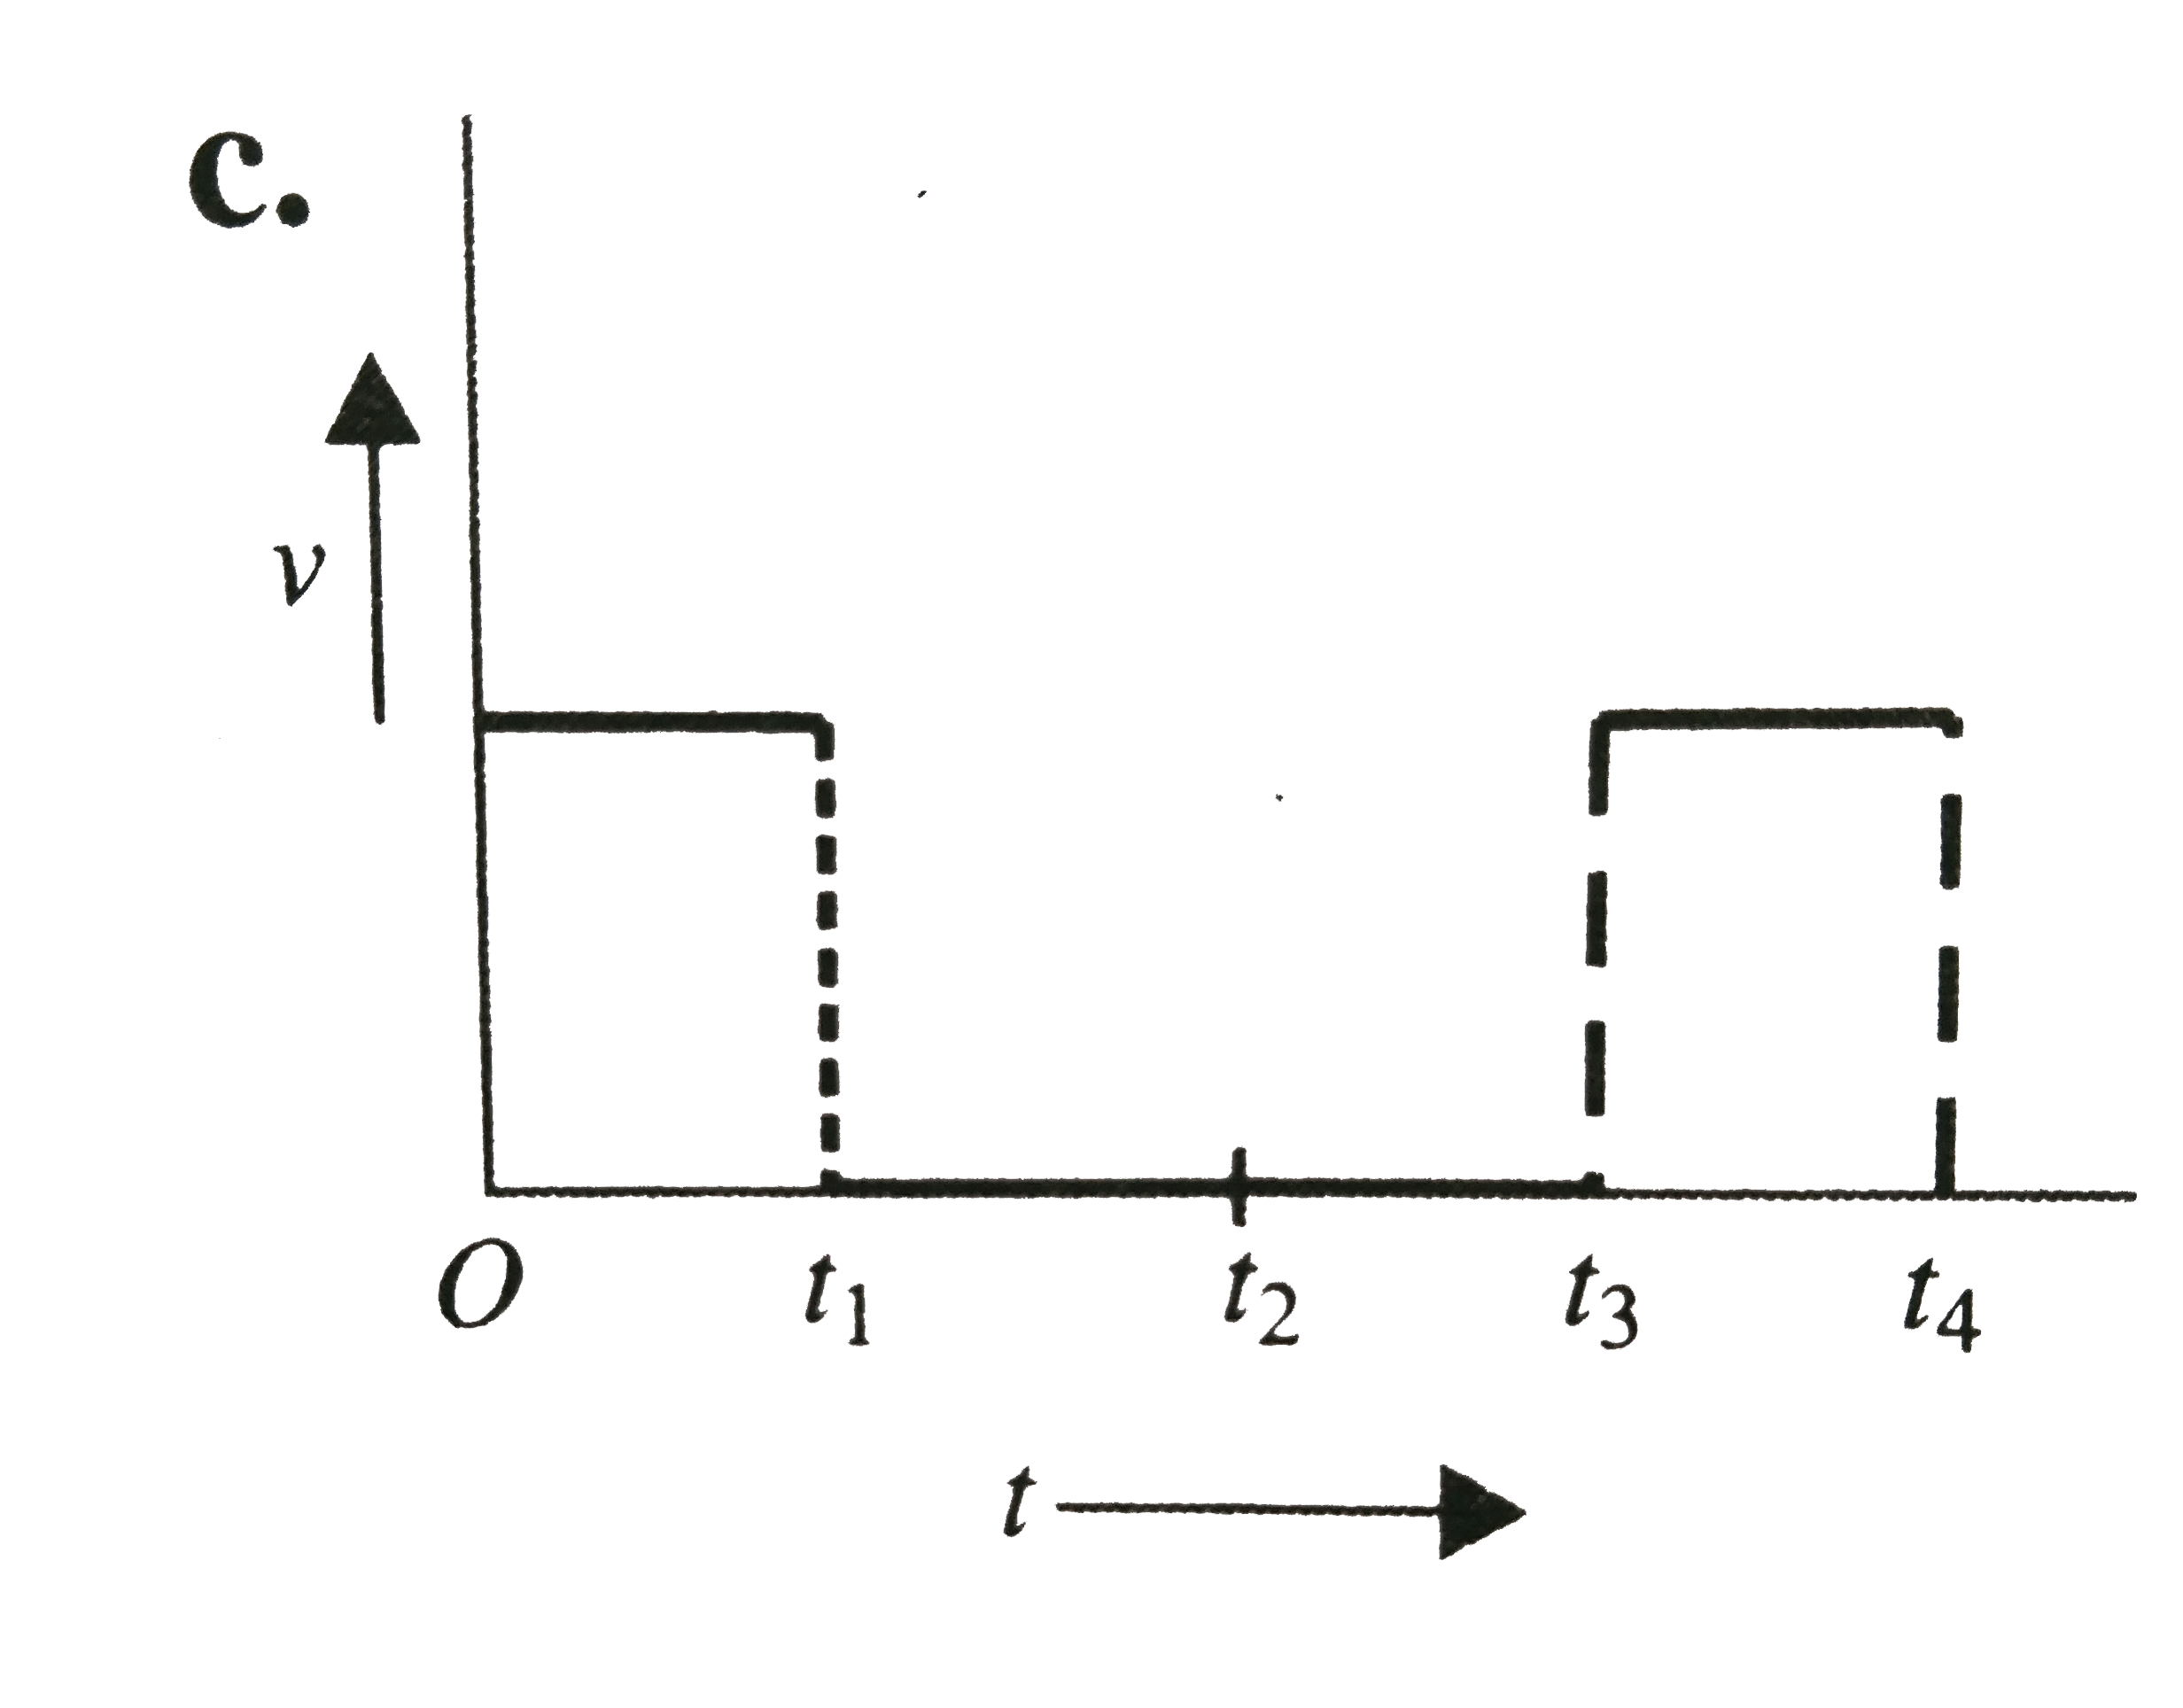
The velocity-time graph of the motion of the body will be .
A
 .
.
B
 .
.
C
 .
.
D
 .
.
Video Solution
Text Solution
The correct Answer is:D
From to , Verlocity id positive and constant as indicated by positive and constant slope.
From to t_(3)t_(4)d satisfies all these observations.
|
Topper's Solved these Questions
- KINEMATICS-1BOOK - CENGAGE PHYSICS ENGLISHCHAPTER - KINEMATICS-1EXERCISE - Graphical cancept
1 Videos
- KINEMATICS-1BOOK - CENGAGE PHYSICS ENGLISHCHAPTER - KINEMATICS-1EXERCISE - Multiple Correct
16 Videos
- KINEMATICS-1BOOK - CENGAGE PHYSICS ENGLISHCHAPTER - KINEMATICS-1EXERCISE - Single Correct
52 Videos
- GRAVITATIONBOOK - CENGAGE PHYSICS ENGLISHCHAPTER - GRAVITATIONEXERCISE - INTEGER_TYPE
1 Videos
- KINEMATICS-2BOOK - CENGAGE PHYSICS ENGLISHCHAPTER - KINEMATICS-2EXERCISE - Exercise Integer
9 Videos
Similar Questions
Knowledge Check
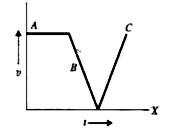
The velocity time graph of a body is shown in fig. 3.3. it implies that at point B
 Athe force is zeroBthere is a force towards motionCthere is force which oppose motionDnone of the above
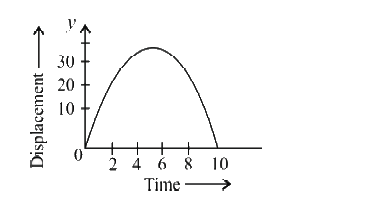
The displacement-time graph of a moving object is shown in figure. Which of the velocity-time graphs shown in figure could represent the motion of the same body ?
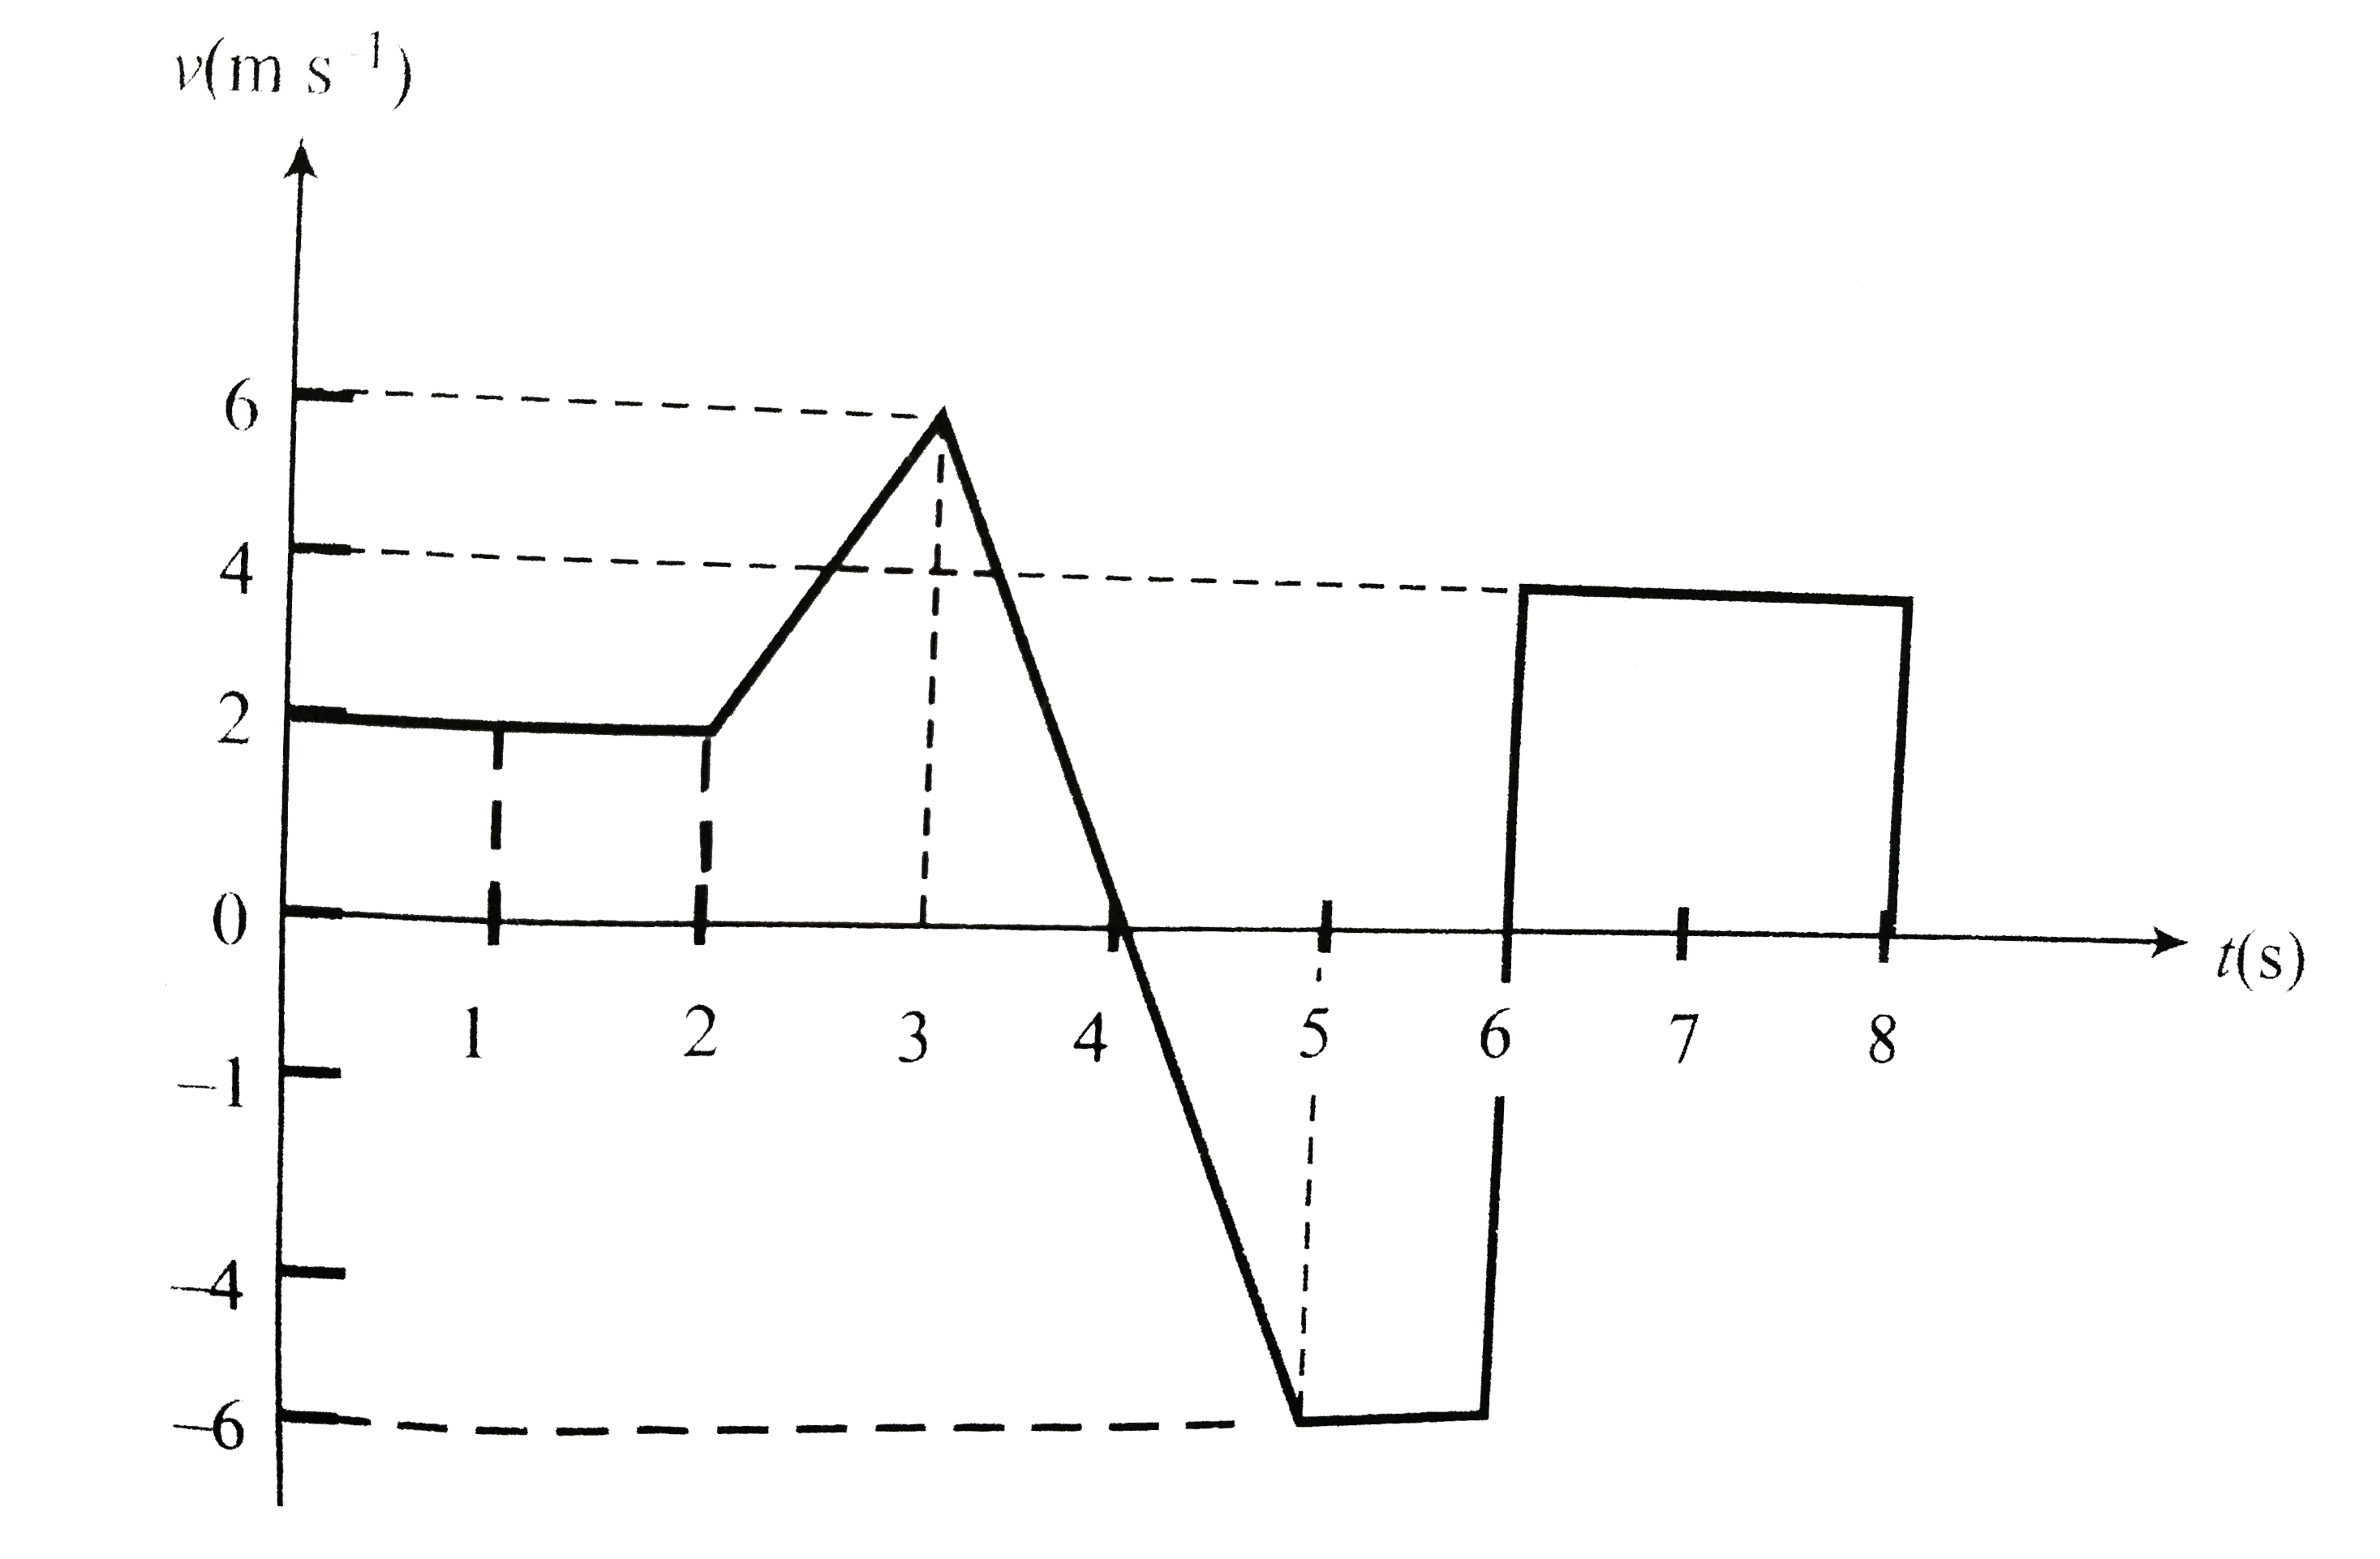
View SolutionThe velocity-time graph of a body is shown in .
The displacement of the body in 8s is.
 .
.
View SolutionThe displacement -time (x– t) graph of a body is given as
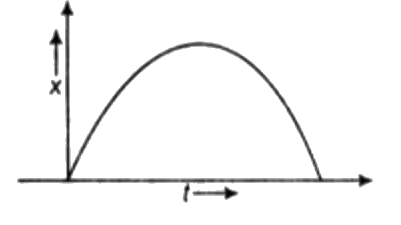
The corresponding velocity -time (v – t ) graph will be
View SolutionThe displacement-time (x - t) graph of a body is given as
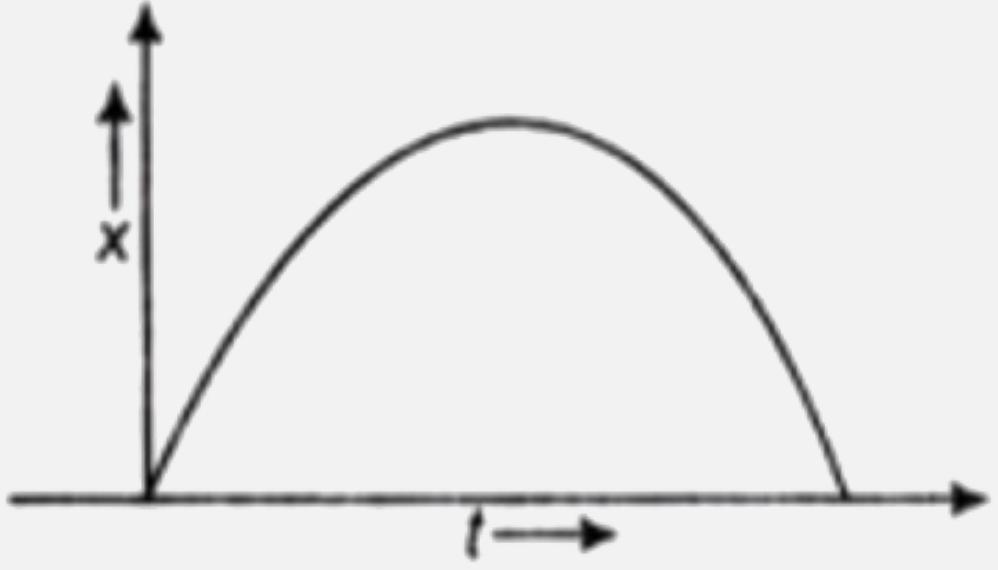
The corresponding velocity -time (v - t) graph will be
View SolutionThe velocity time graph of a body is shown in fig. it indicates that :
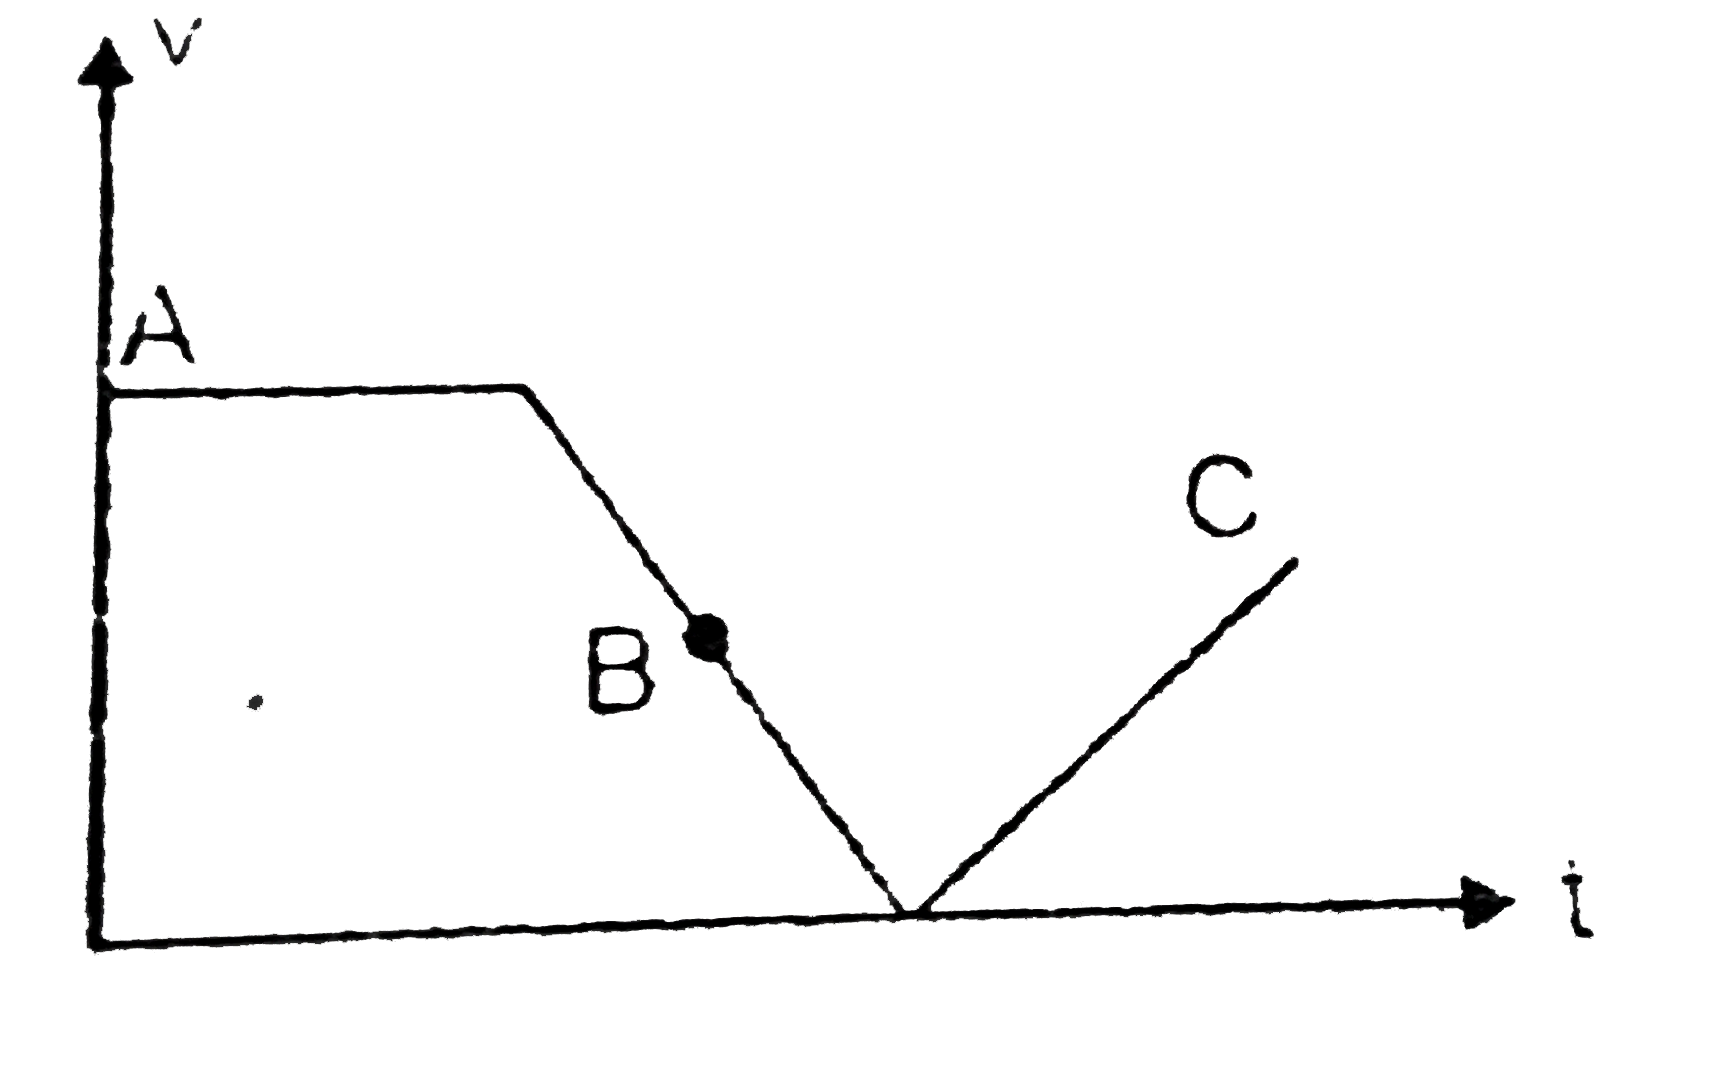
View SolutionGraph of a body is shown. It explains that

View SolutionThe displacement-time graph of a particle is as shown below. It indicates that
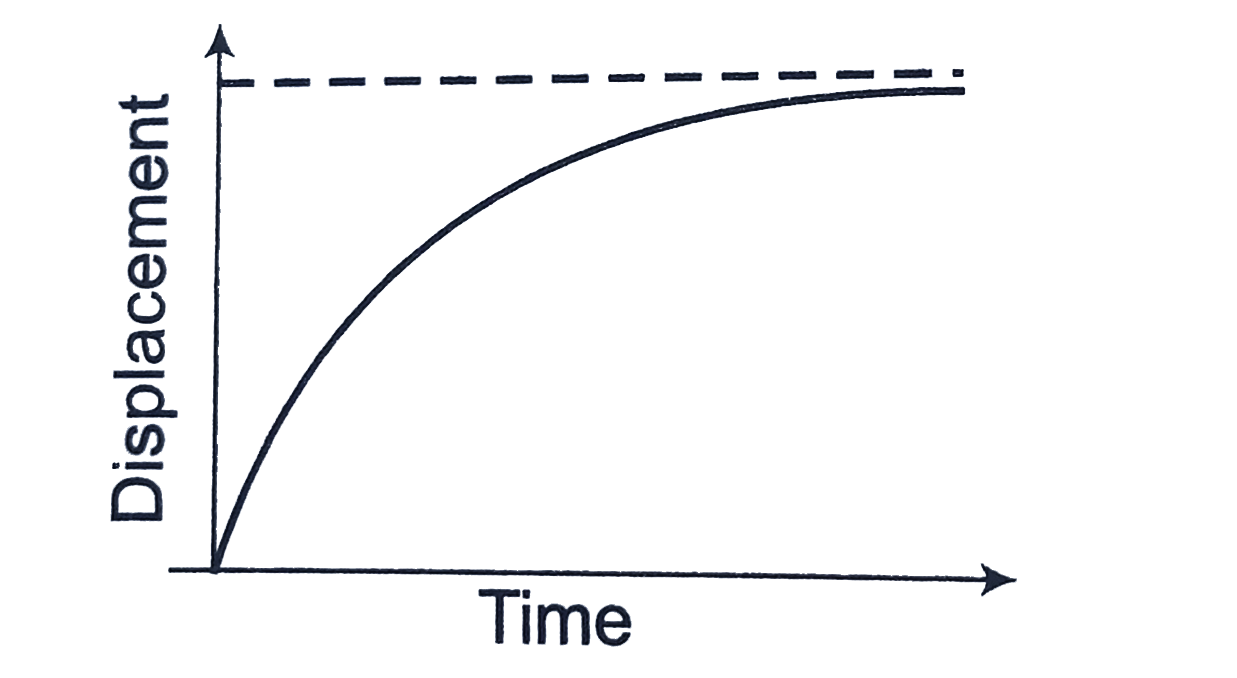
View Solution

