
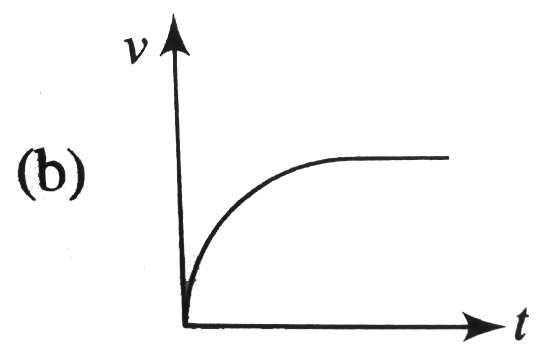
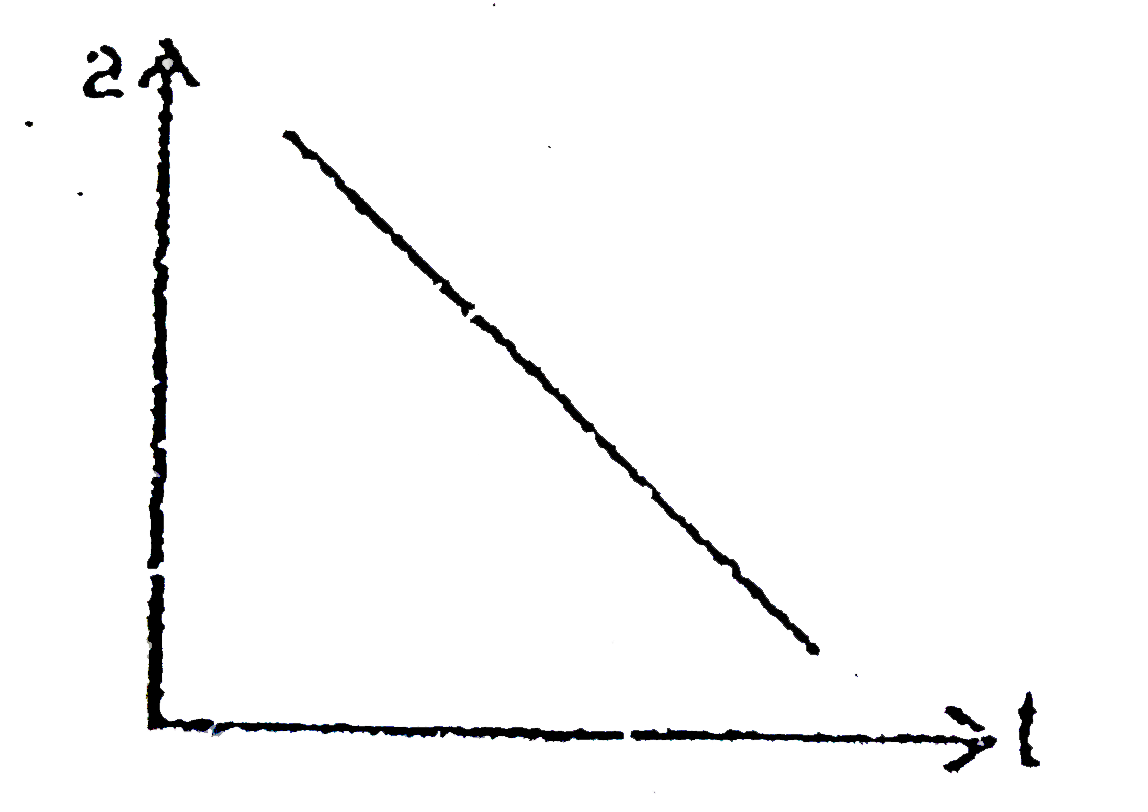
The acceleration time graph of a body is shown below the most probable velocity time graph of the body is



The correct Answer is:C
From given a-t graph it is clear that acceleration is increasing at constant rate
dadt=k (constant)⇒a=kt(by integration)
⇒dvdt=kt⇒dvktdt
⇒∫dv=k∫tdt⇒v=kt22
i.e., v is dependent on time parabolically and parabola is symmetric about v-axis. And suddenly acceleration becomes zero, i.e., velocity becomes constant.
Hence (c ) is most probable graph.
Similar Questions
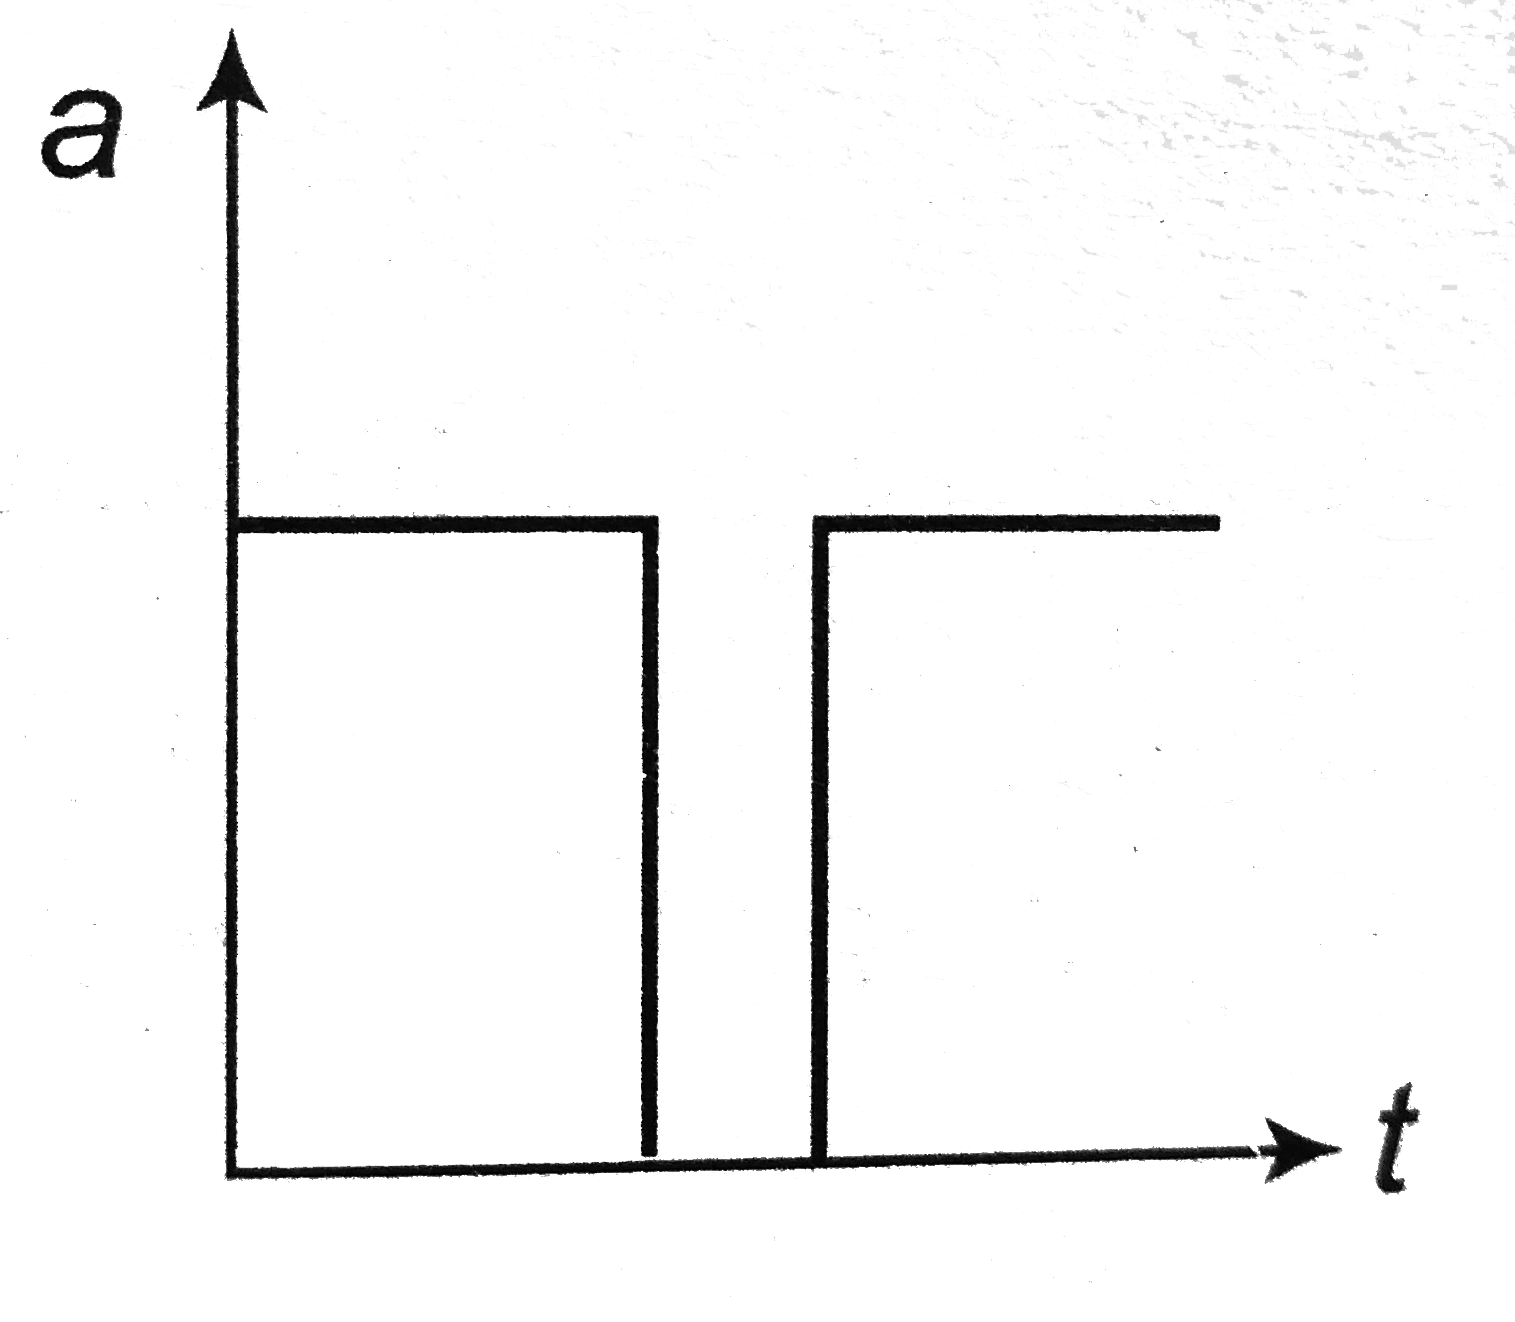
Acceleration-time graph of a body is shown. The corresponding velocity-time graph of the same body is.
View SolutionGraph of a body is shown. It explains that

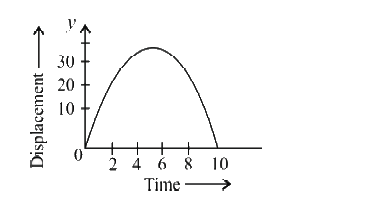
View SolutionThe displacement-time graph of a body is shown in.
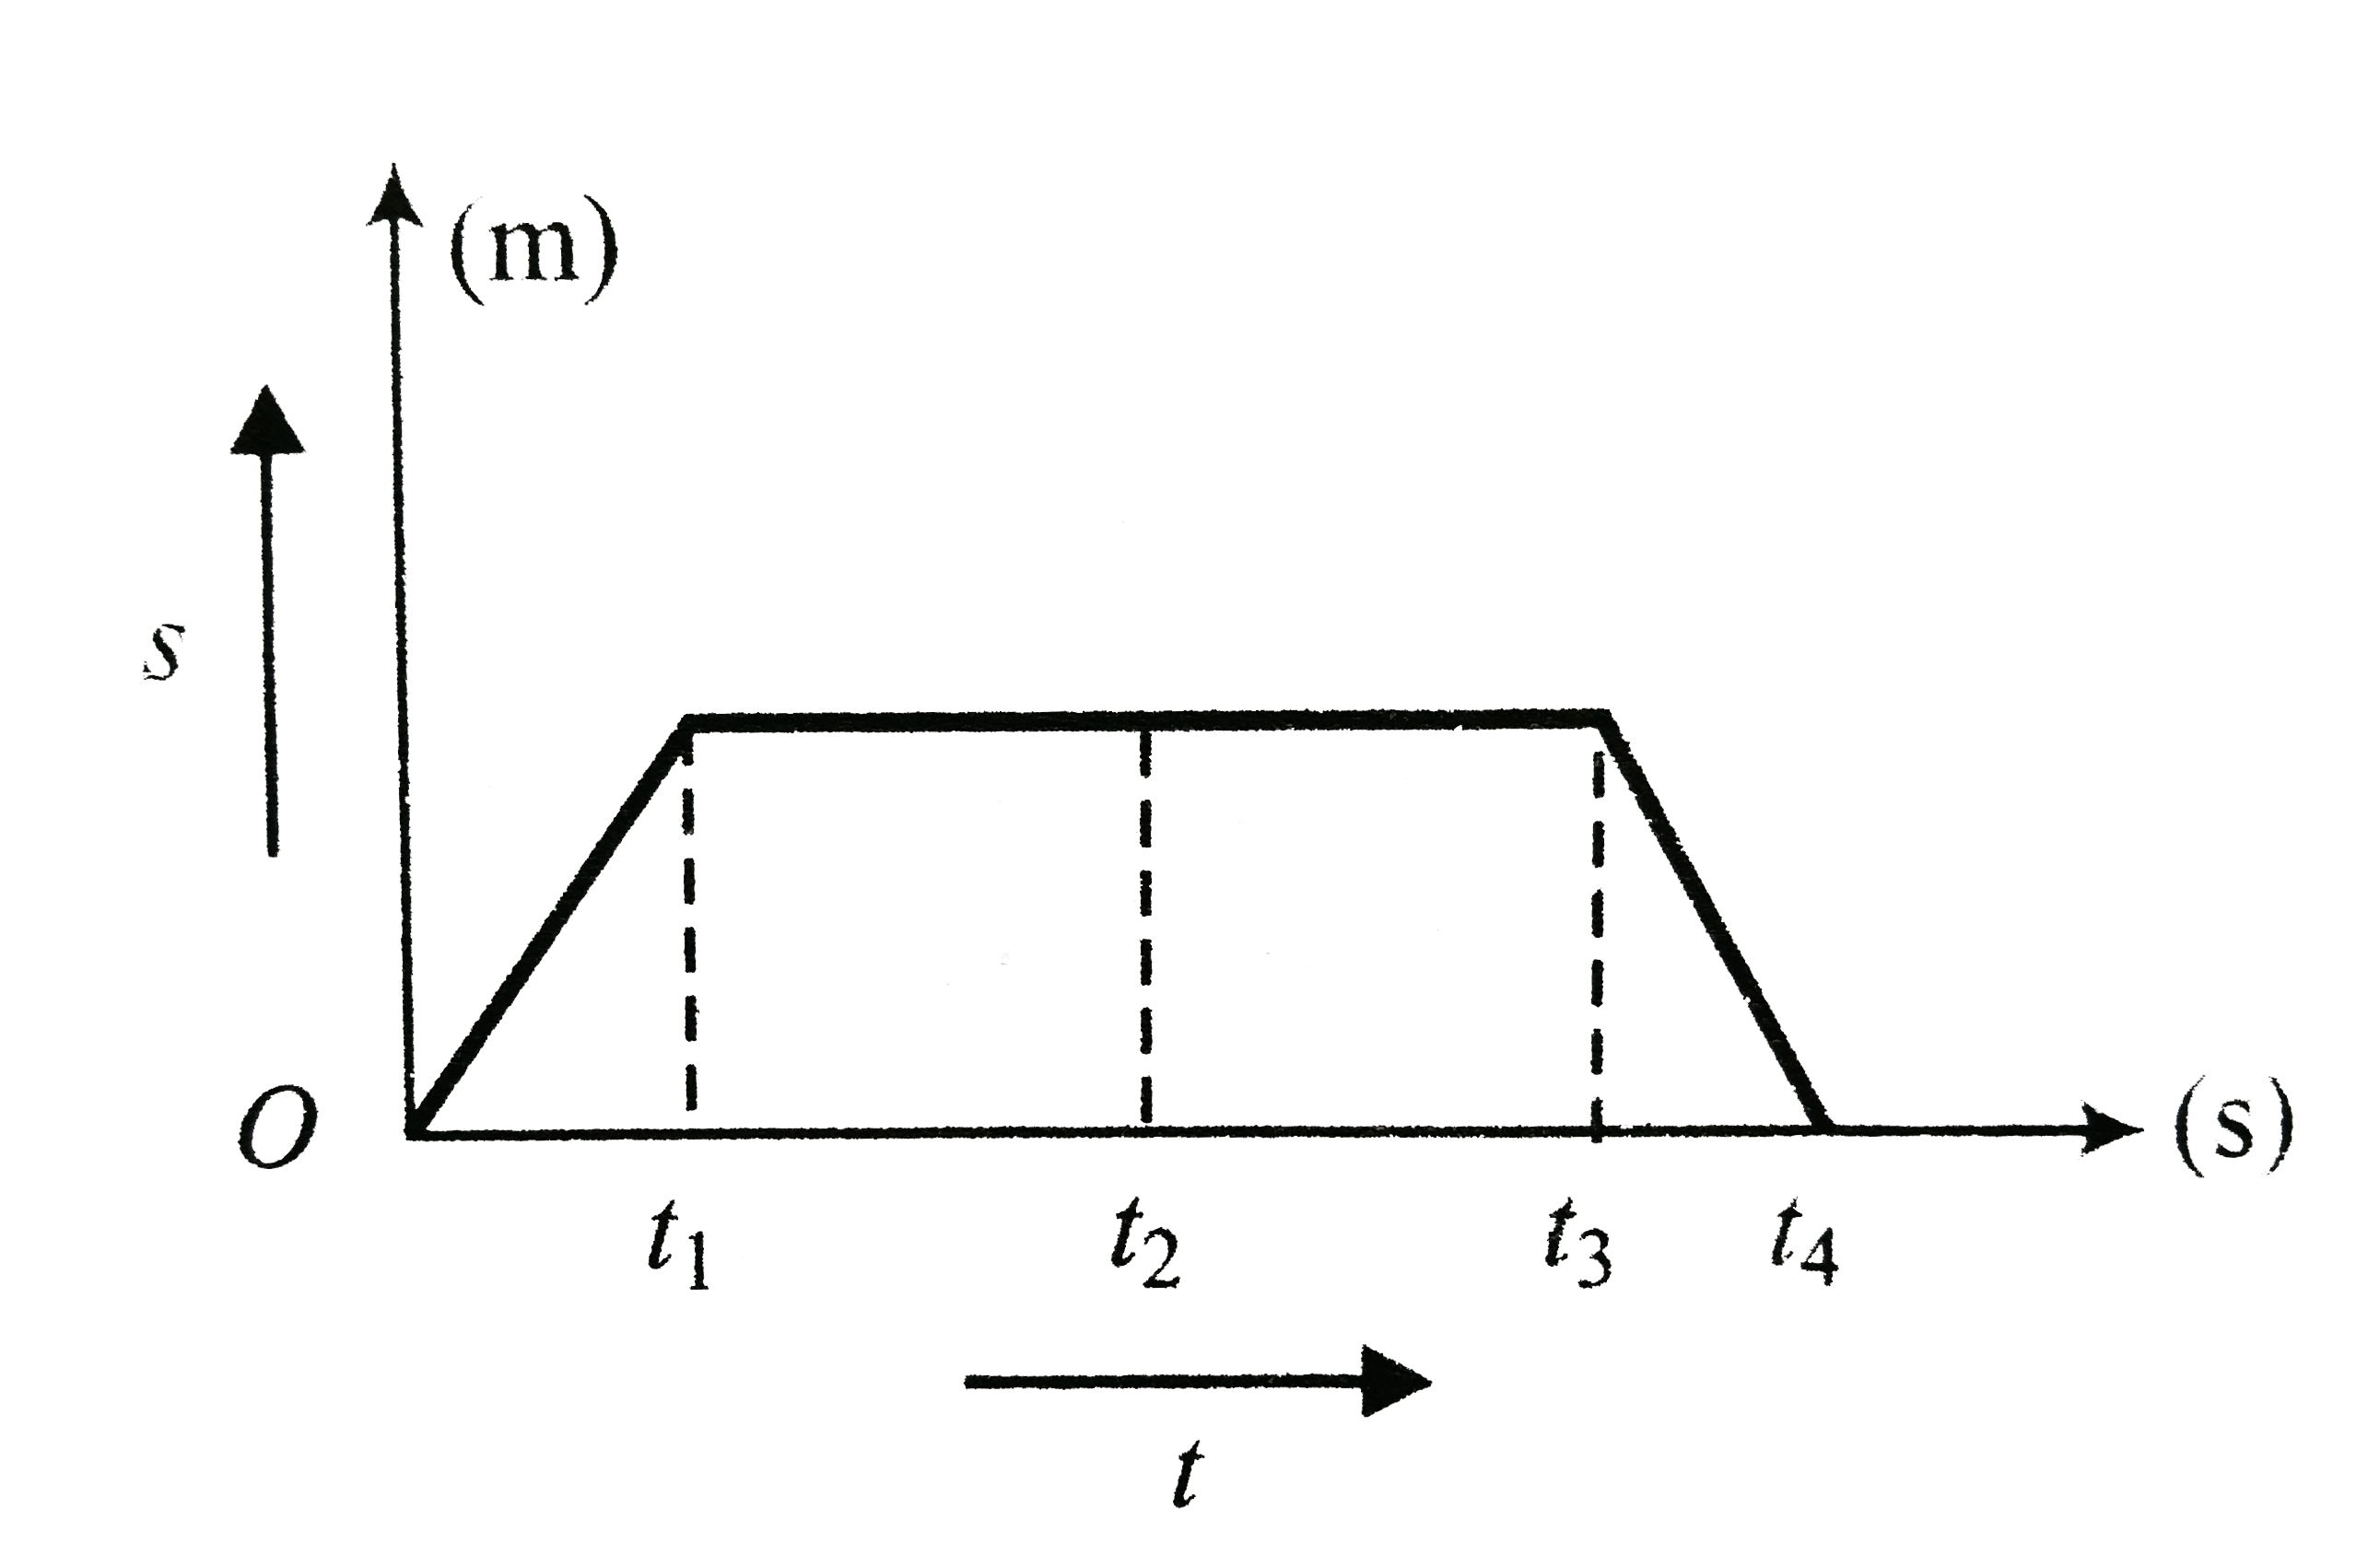 .
.
The velocity-time graph of the motion of the body will be .
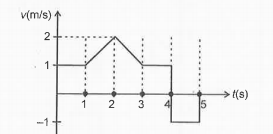
View SolutionThe velocity-time graph of a body is shown below. The displacement covered by body in 5 s is
View SolutionThe acceleration time graph of a body moving in a straight is shown in figure.
Assertion :− Velocity of the body is continously increasing over the time interval shown.
Reason :− Acceleration is positive for all shown value of t.
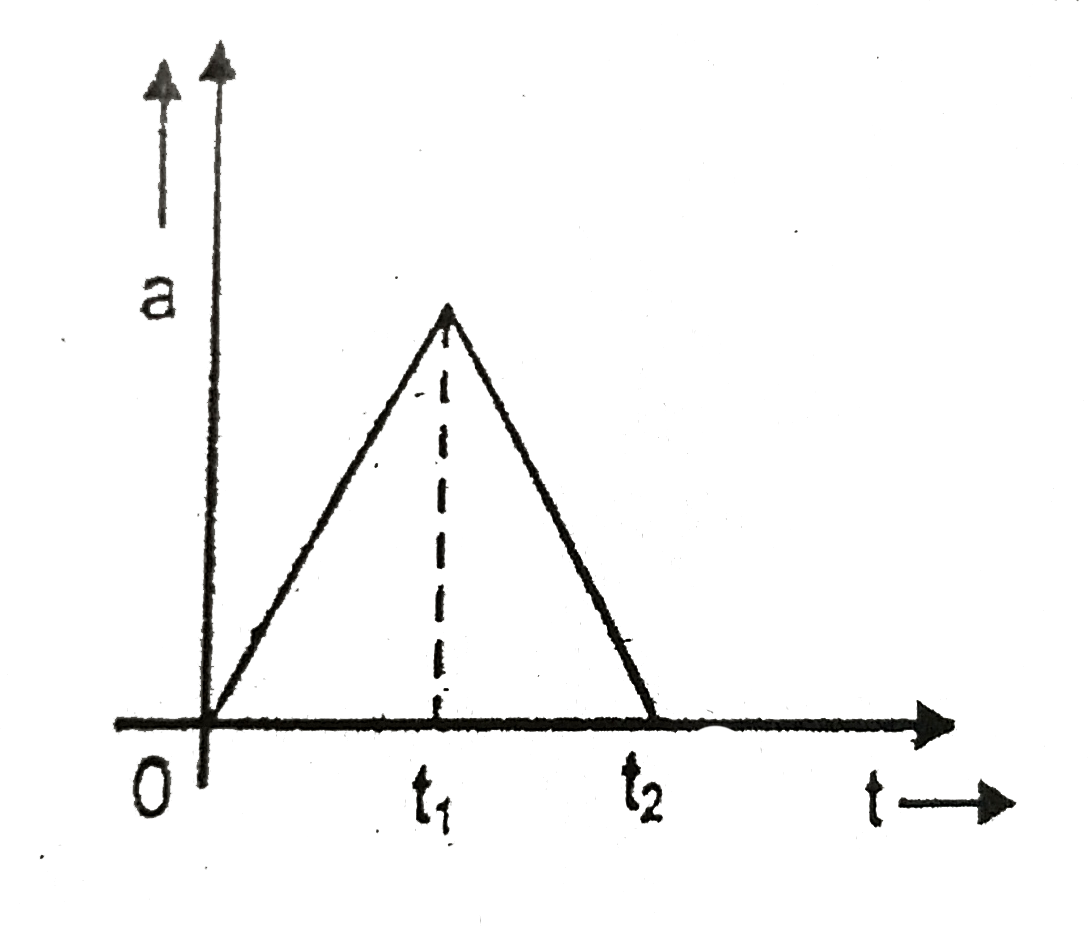
View SolutionA particle starts to move along a straight line. The acceleration versus time graph of particle is as shown in figure. The correct velocity versus time graph is :
View SolutionThe velocity time graph of a body is shown in fig. it indicates that :

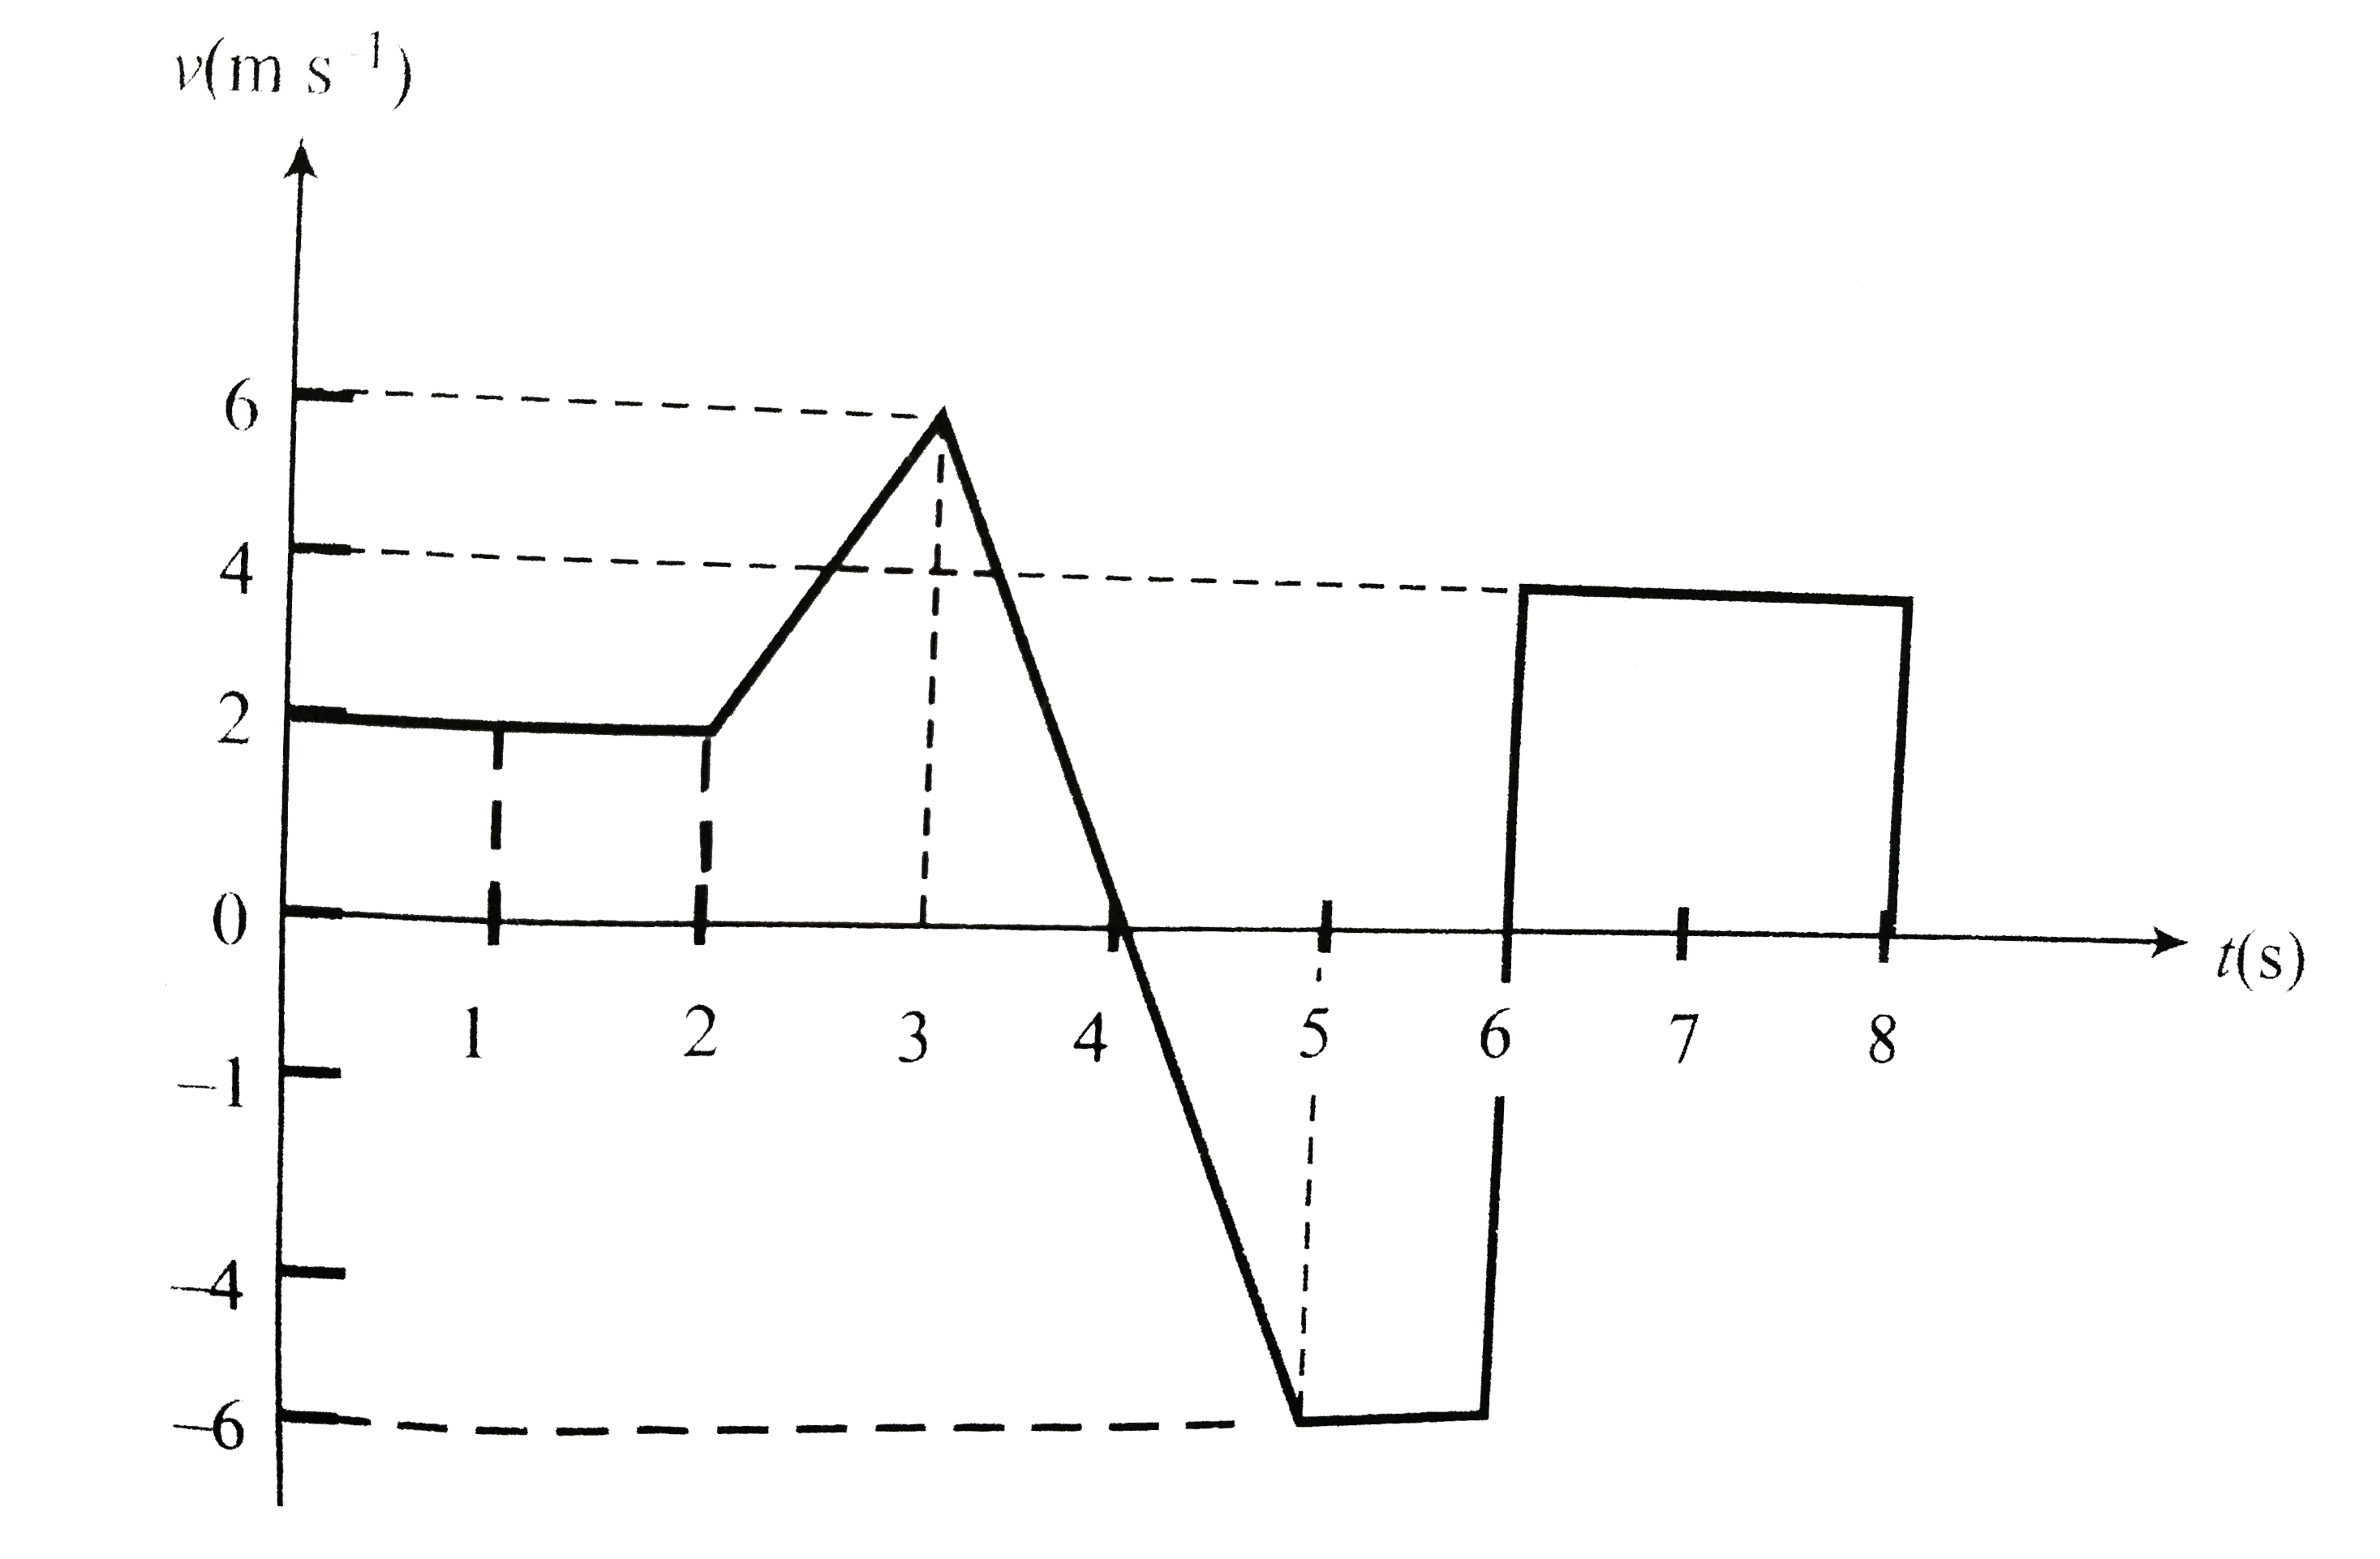
View SolutionThe velocity-time graph of a body is shown in .
The displacement of the body in 8s is.
 .
.
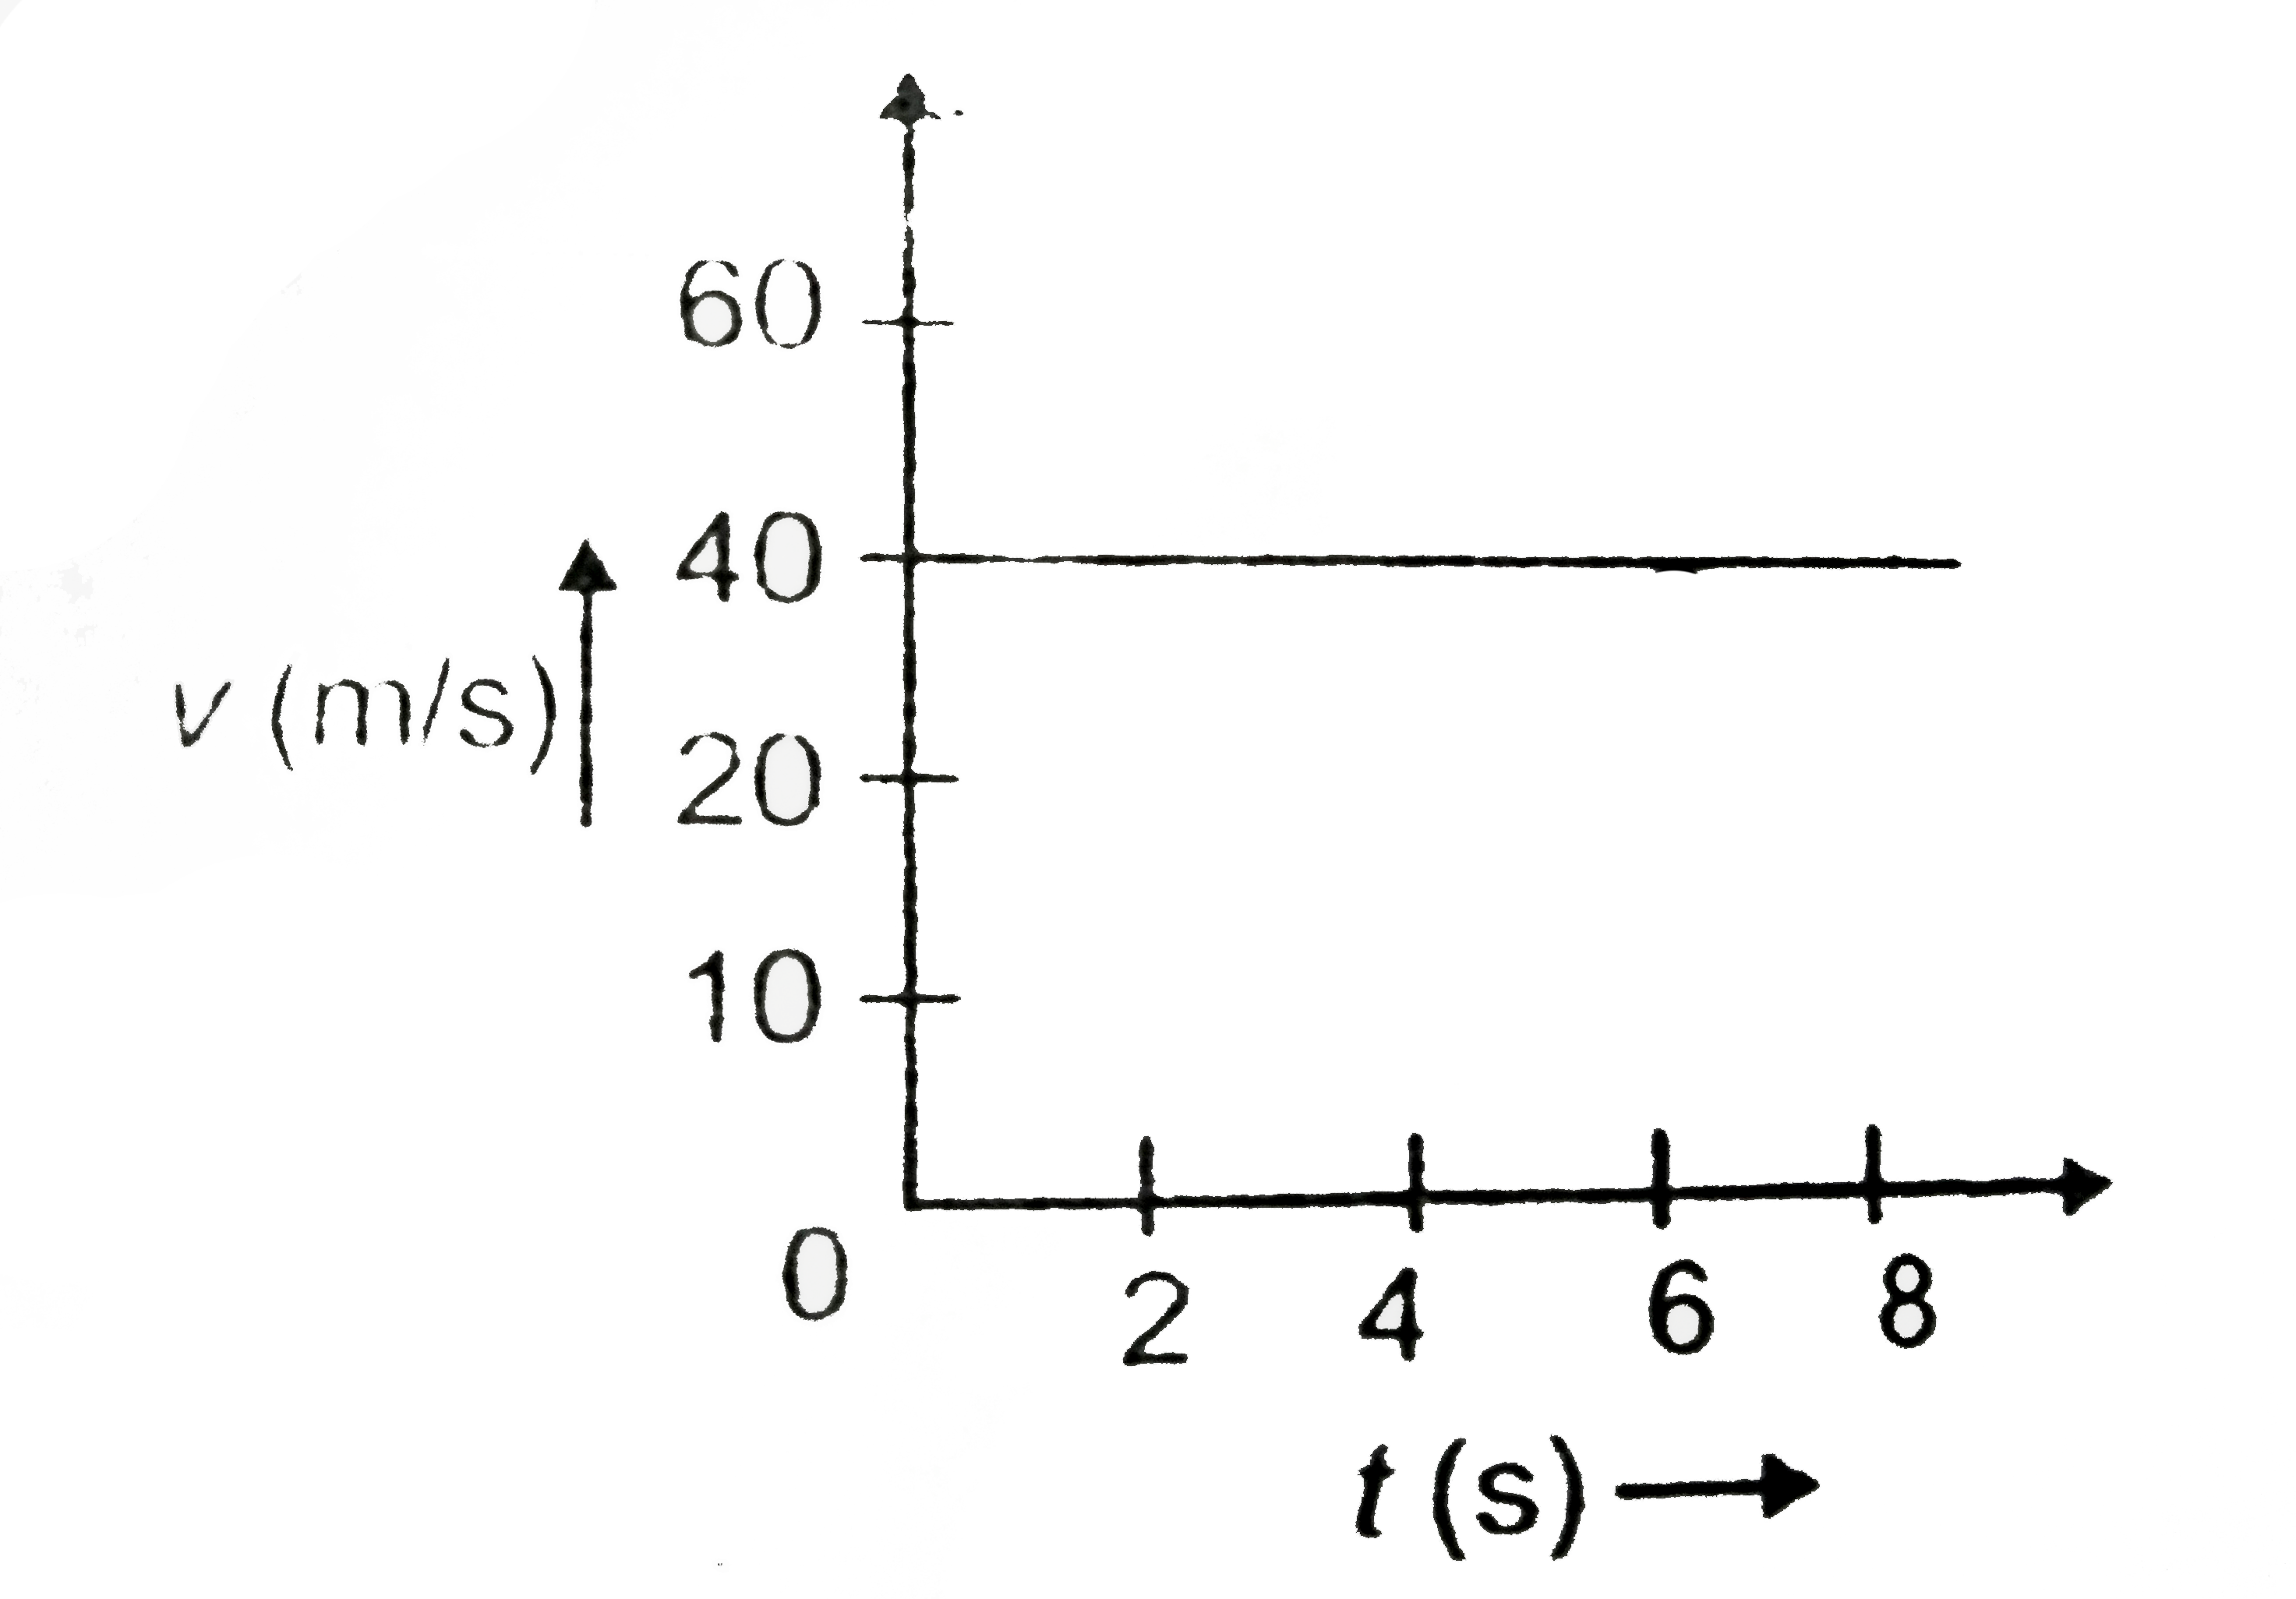
View SolutionThe velocity-time graph of an object is shown below. The acceleration of the object is
View SolutionThe displacement-time graph of a moving object is shown in figure. Which of the velocity-time graphs shown in figure could represent the motion of the same body ?
View Solution