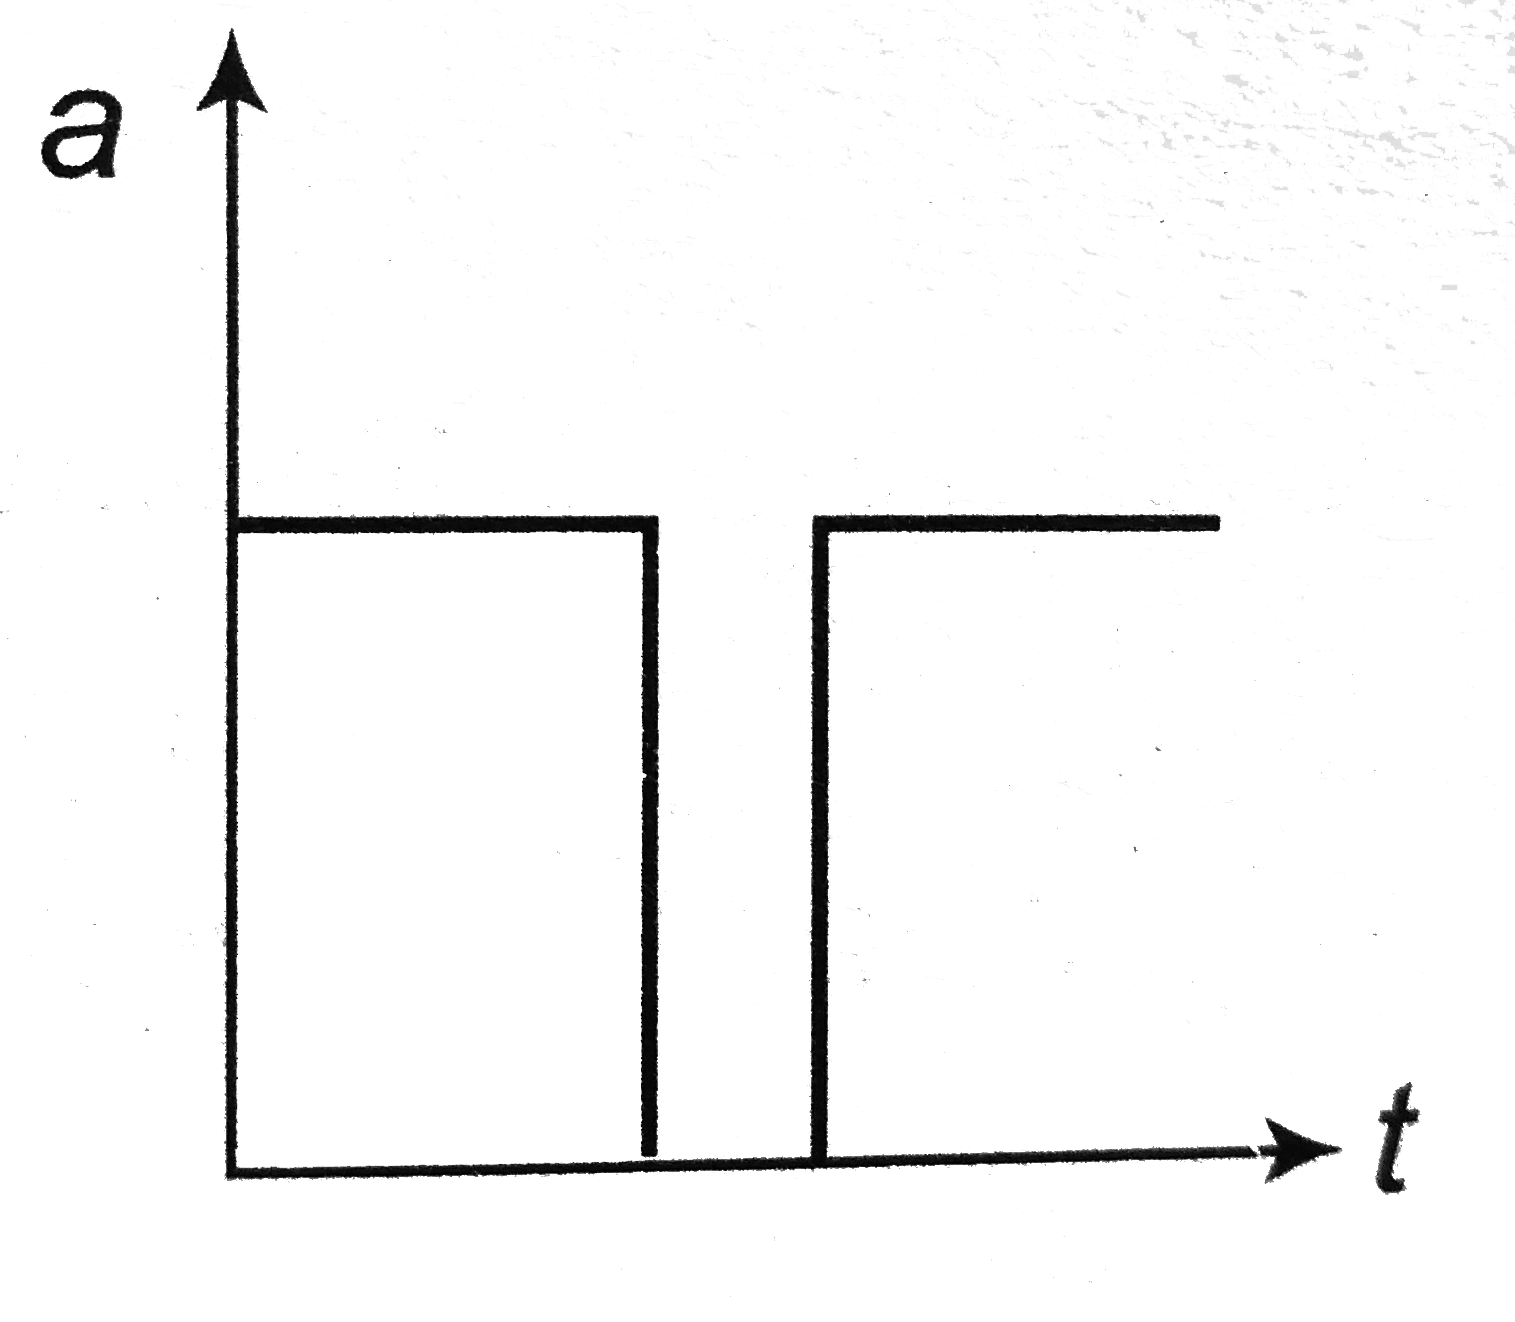
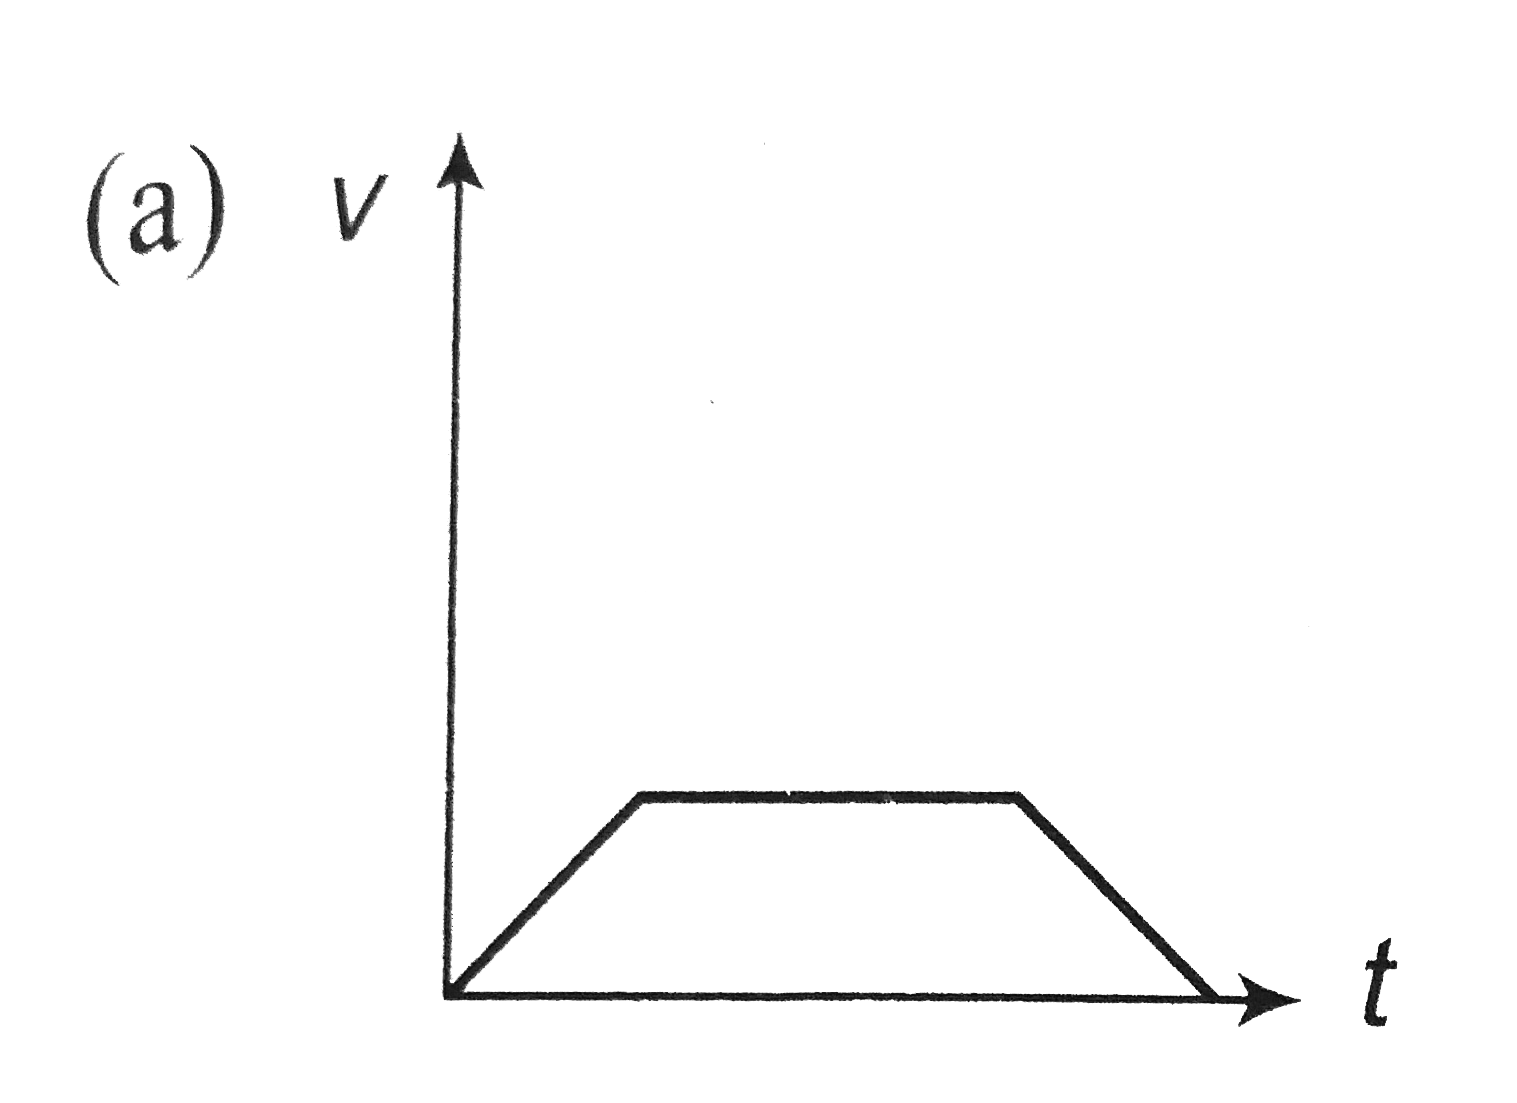
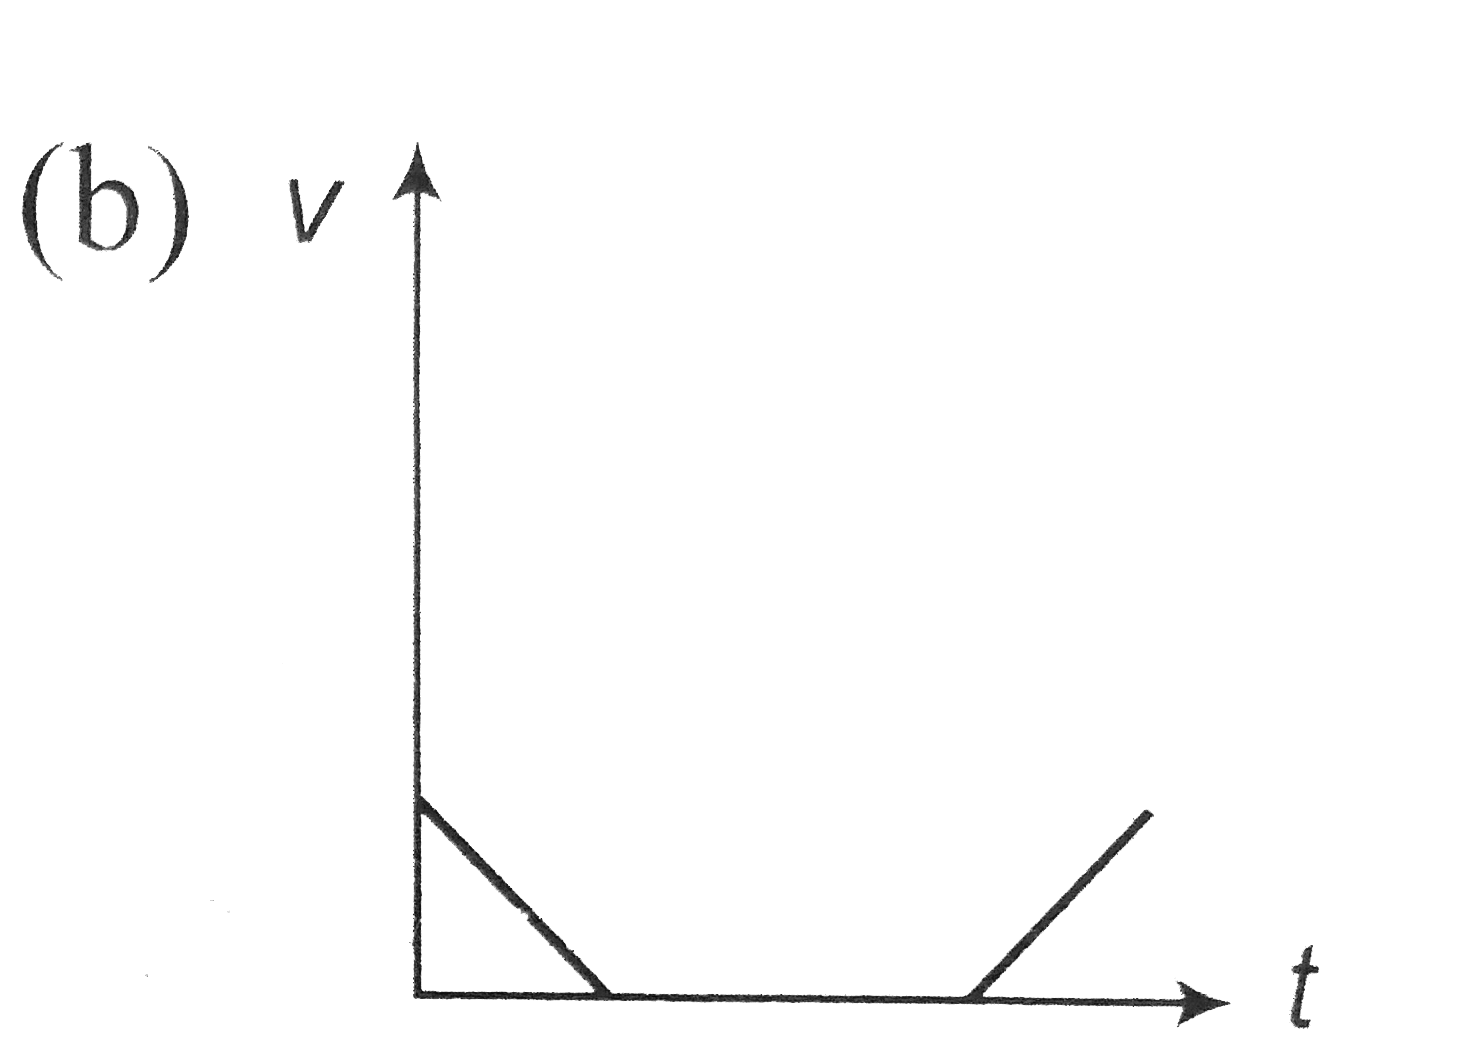
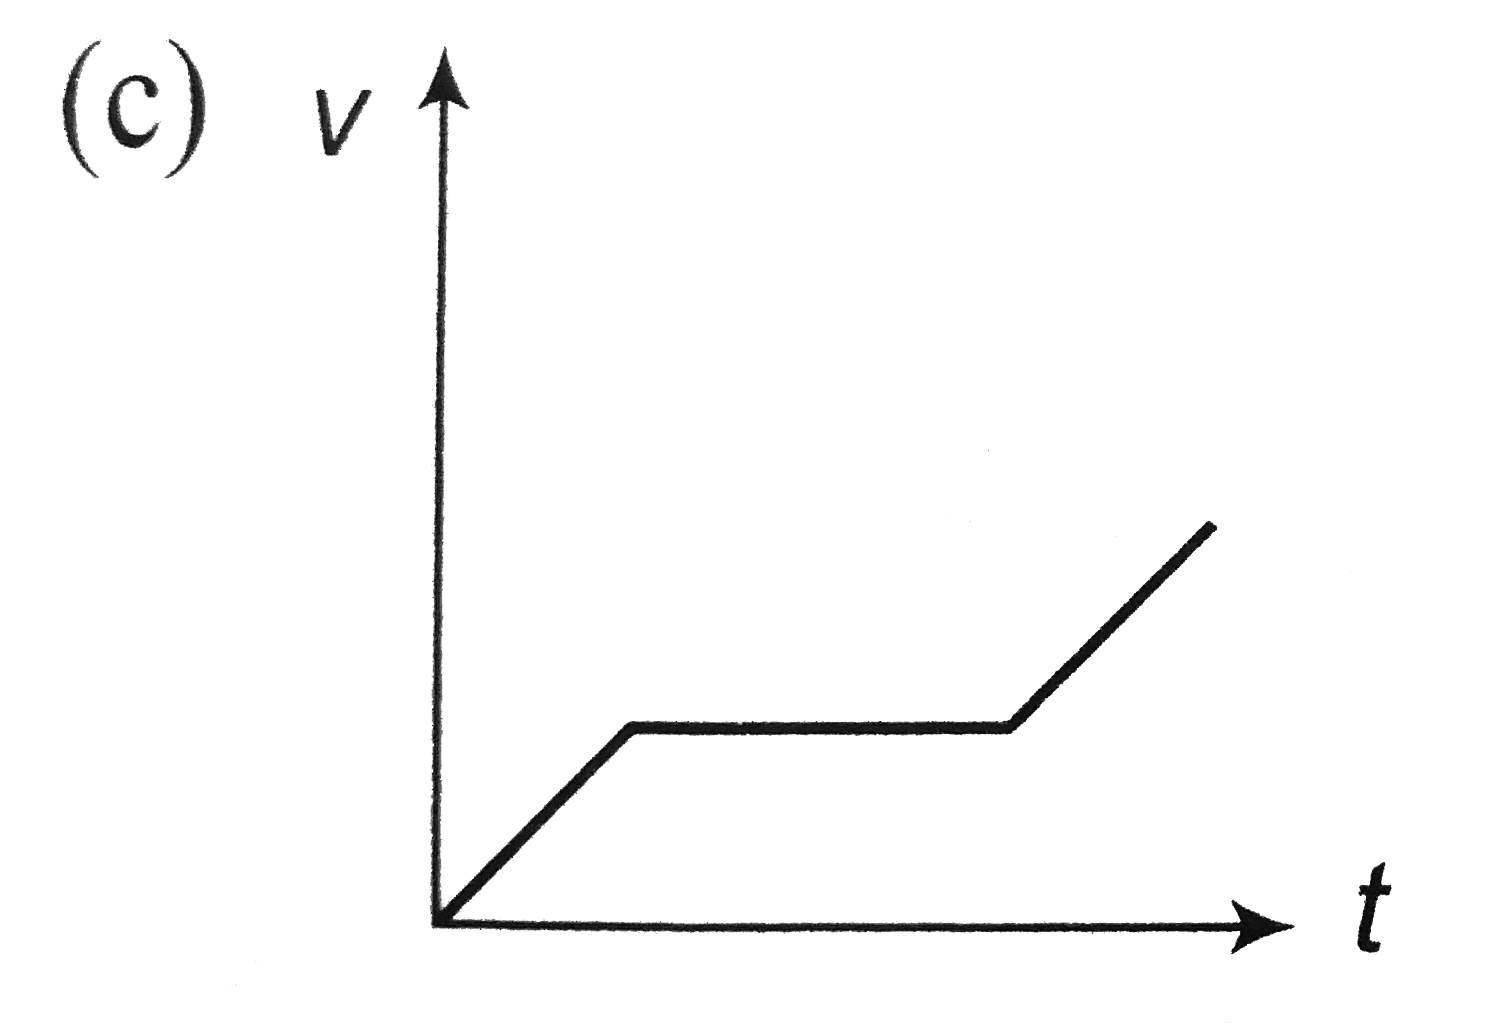
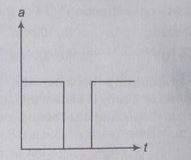
Acceleration-time graph of a body is shown. The corresponding velocity-time graph of the same body is.
A
B
C
D

Video Solution
Text Solution
The correct Answer is:C
From acceleration-time graph. Acceleration is constant for first part of motion so, for this part velocity of body increases uniformly with time and as then the velocity becomes constant. Then again increased because of constant acceleration.
|
Topper's Solved these Questions
- GENERAL KINEMATICS AND MOTION IN ONE DIMENSIONBook:A2ZChapter:GENERAL KINEMATICS AND MOTION IN ONE DIMENSIONExercise:Chapter Test
Explore 30 Videos
- GENERAL KINEMATICS AND MOTION IN ONE DIMENSIONBook:A2ZChapter:GENERAL KINEMATICS AND MOTION IN ONE DIMENSIONExercise:NEET Questions
Explore 37 Videos
- FLUID MECHANICSBook:A2ZChapter:FLUID MECHANICSExercise:Chapter Test
Explore 29 Videos
- GRAVITATIONBook:A2ZChapter:GRAVITATIONExercise:Chapter Test
Explore 29 Videos
Similar Questions
Knowledge Check
Acceleration time graph of a body is shown below the corresponding velocity time graph of the same body is
 A
A B
B C
C D
D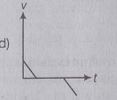
Acceleration time graph of a body is shown below the corresponding velocity time graph of the same body is
 A
A B
B C
C D
D

The acceleration time graph of a body is shown below the most probable velocity time graph of the body isA B
B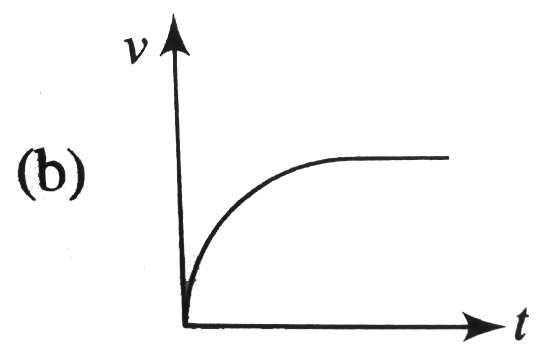 C
C D
D
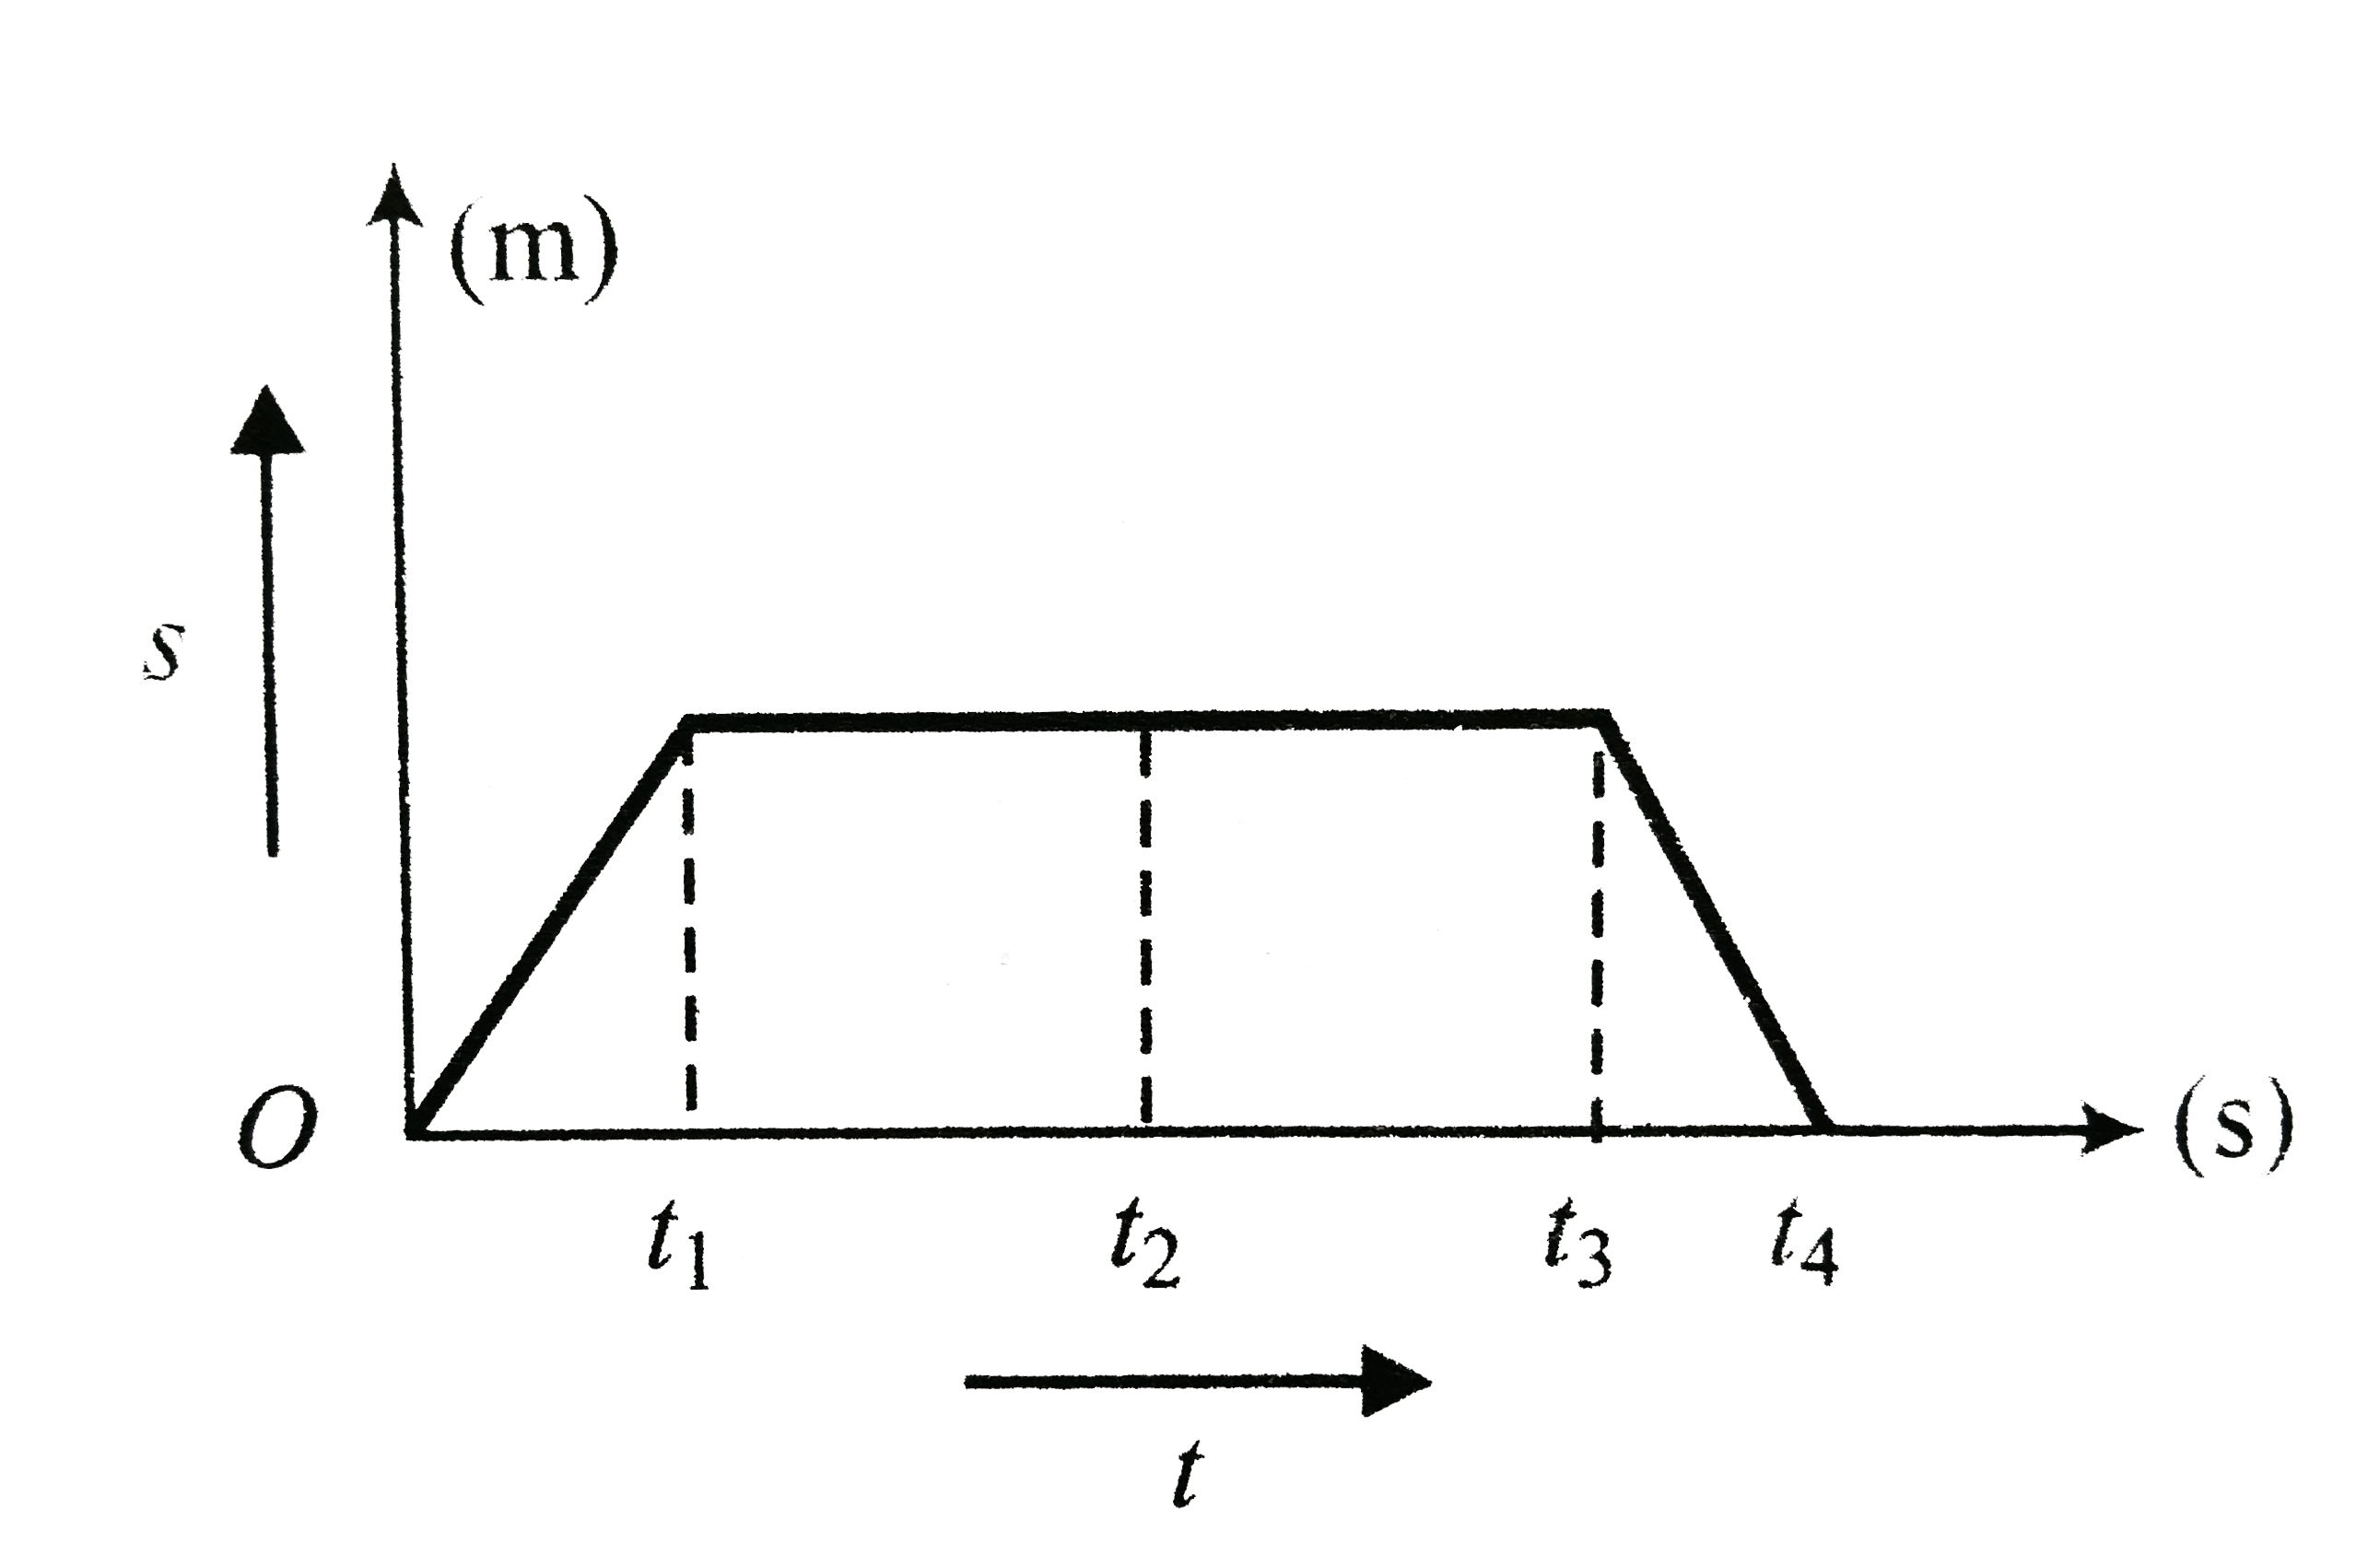
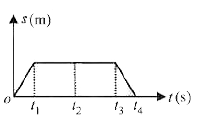
" Find corresponding velocity - time graph for given displacement-time graph "
View SolutionThe displacement-time graph of a body is shown in.
 .
.
The velocity-time graph of the motion of the body will be .
View SolutionThe displacement time graph of a body is shown in figure. The velocity-time graph of the motion of the body will be
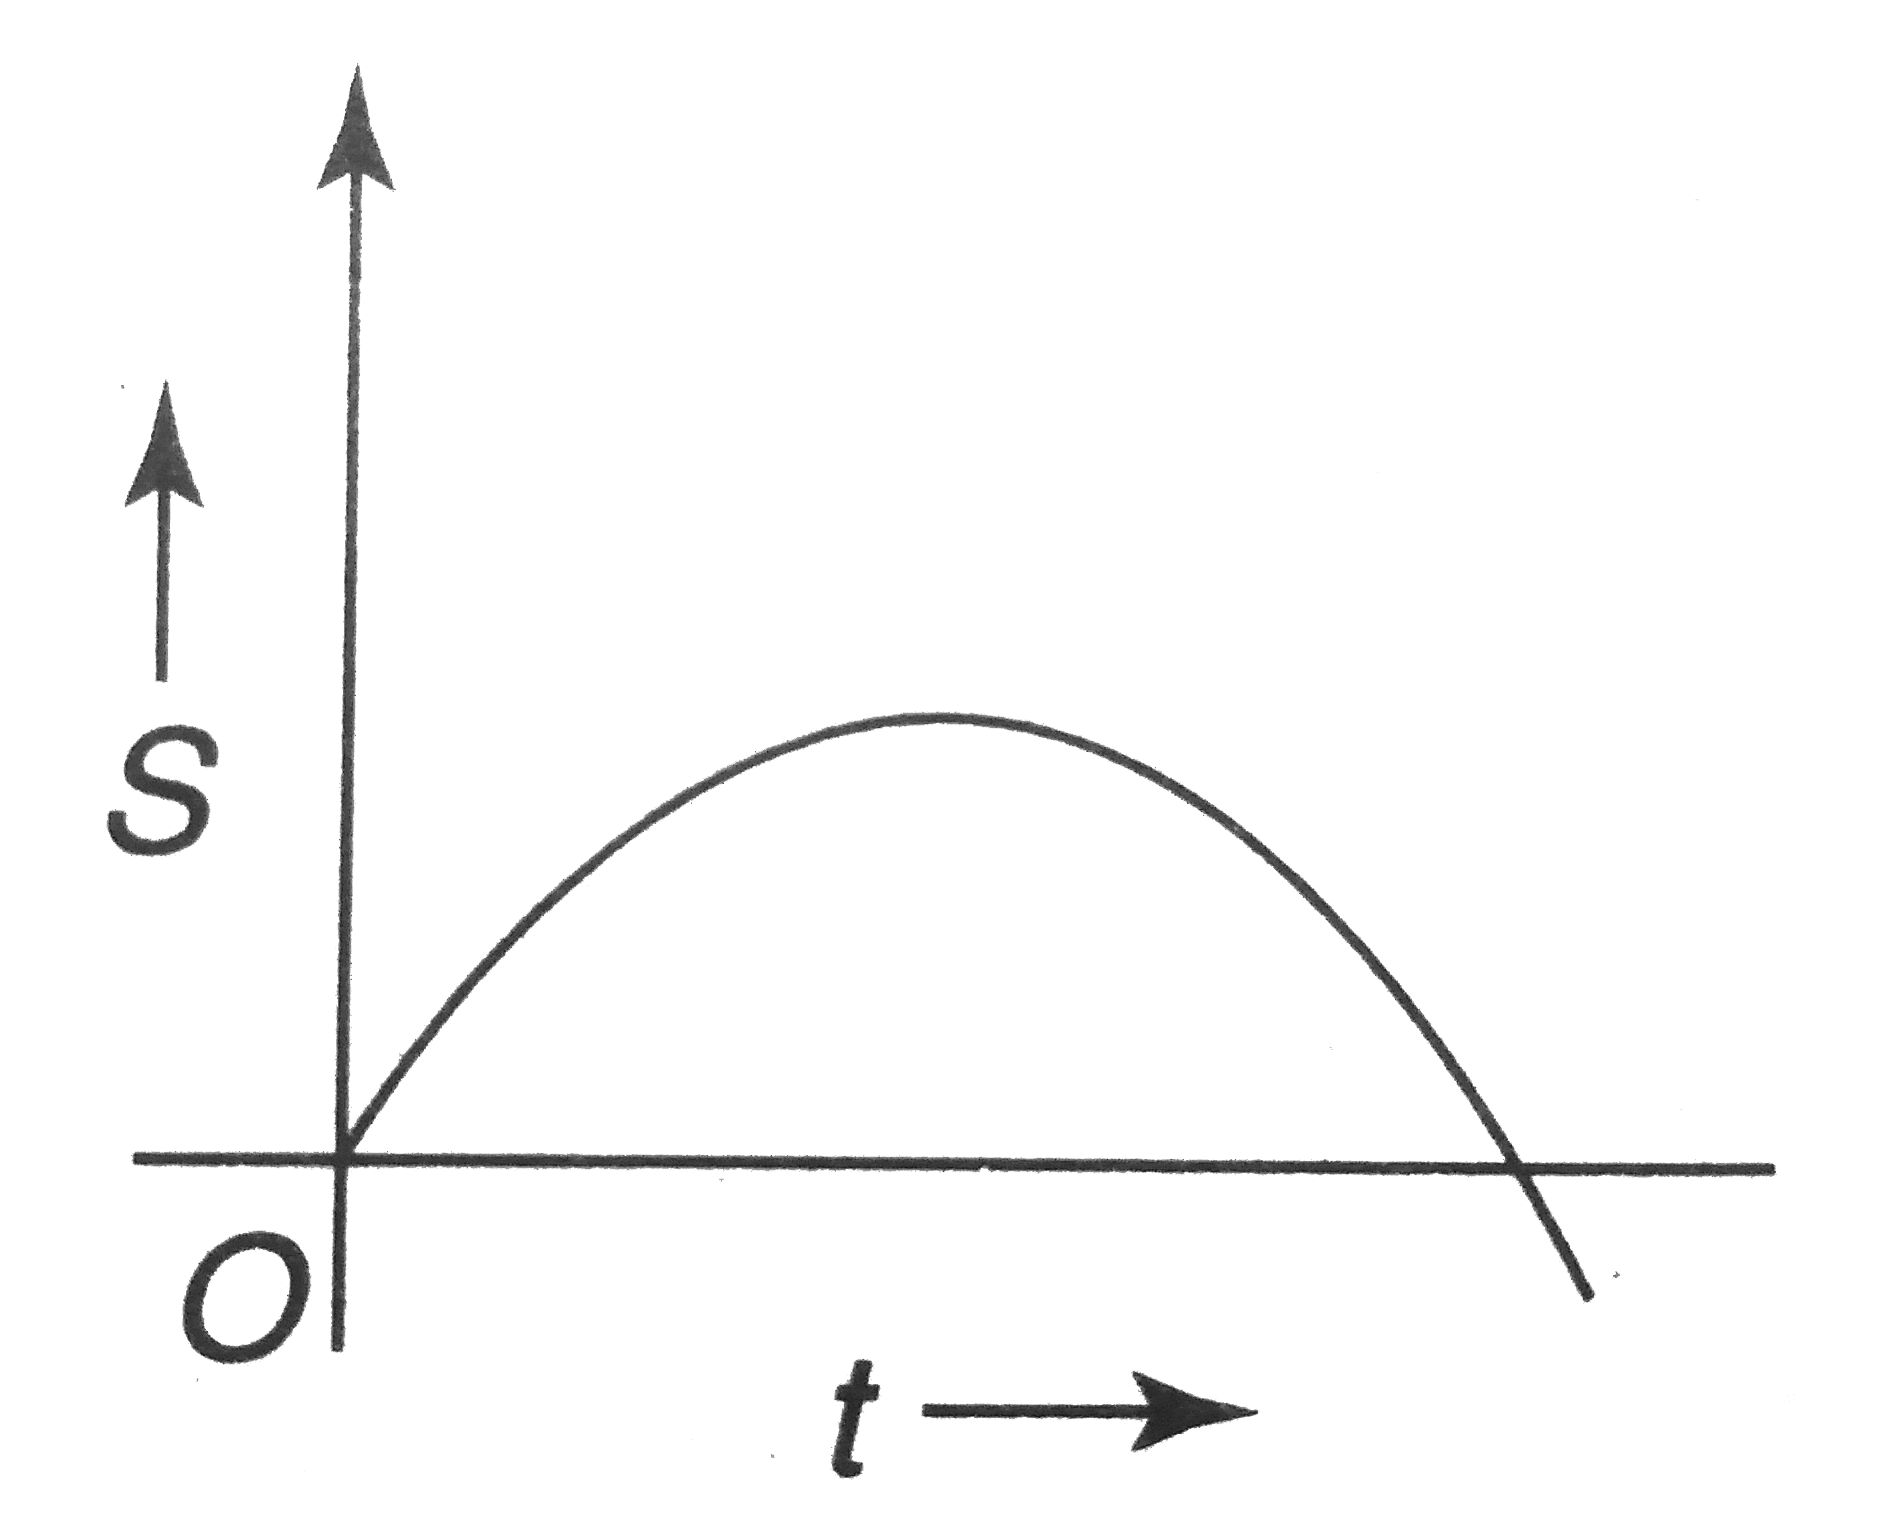
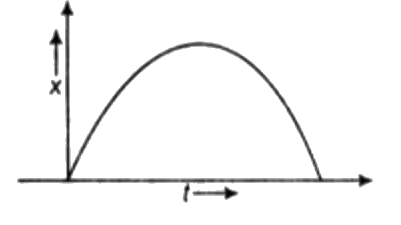
View SolutionThe graph of displacement versus time is shown. Its corresponding velocity-time graph will be.
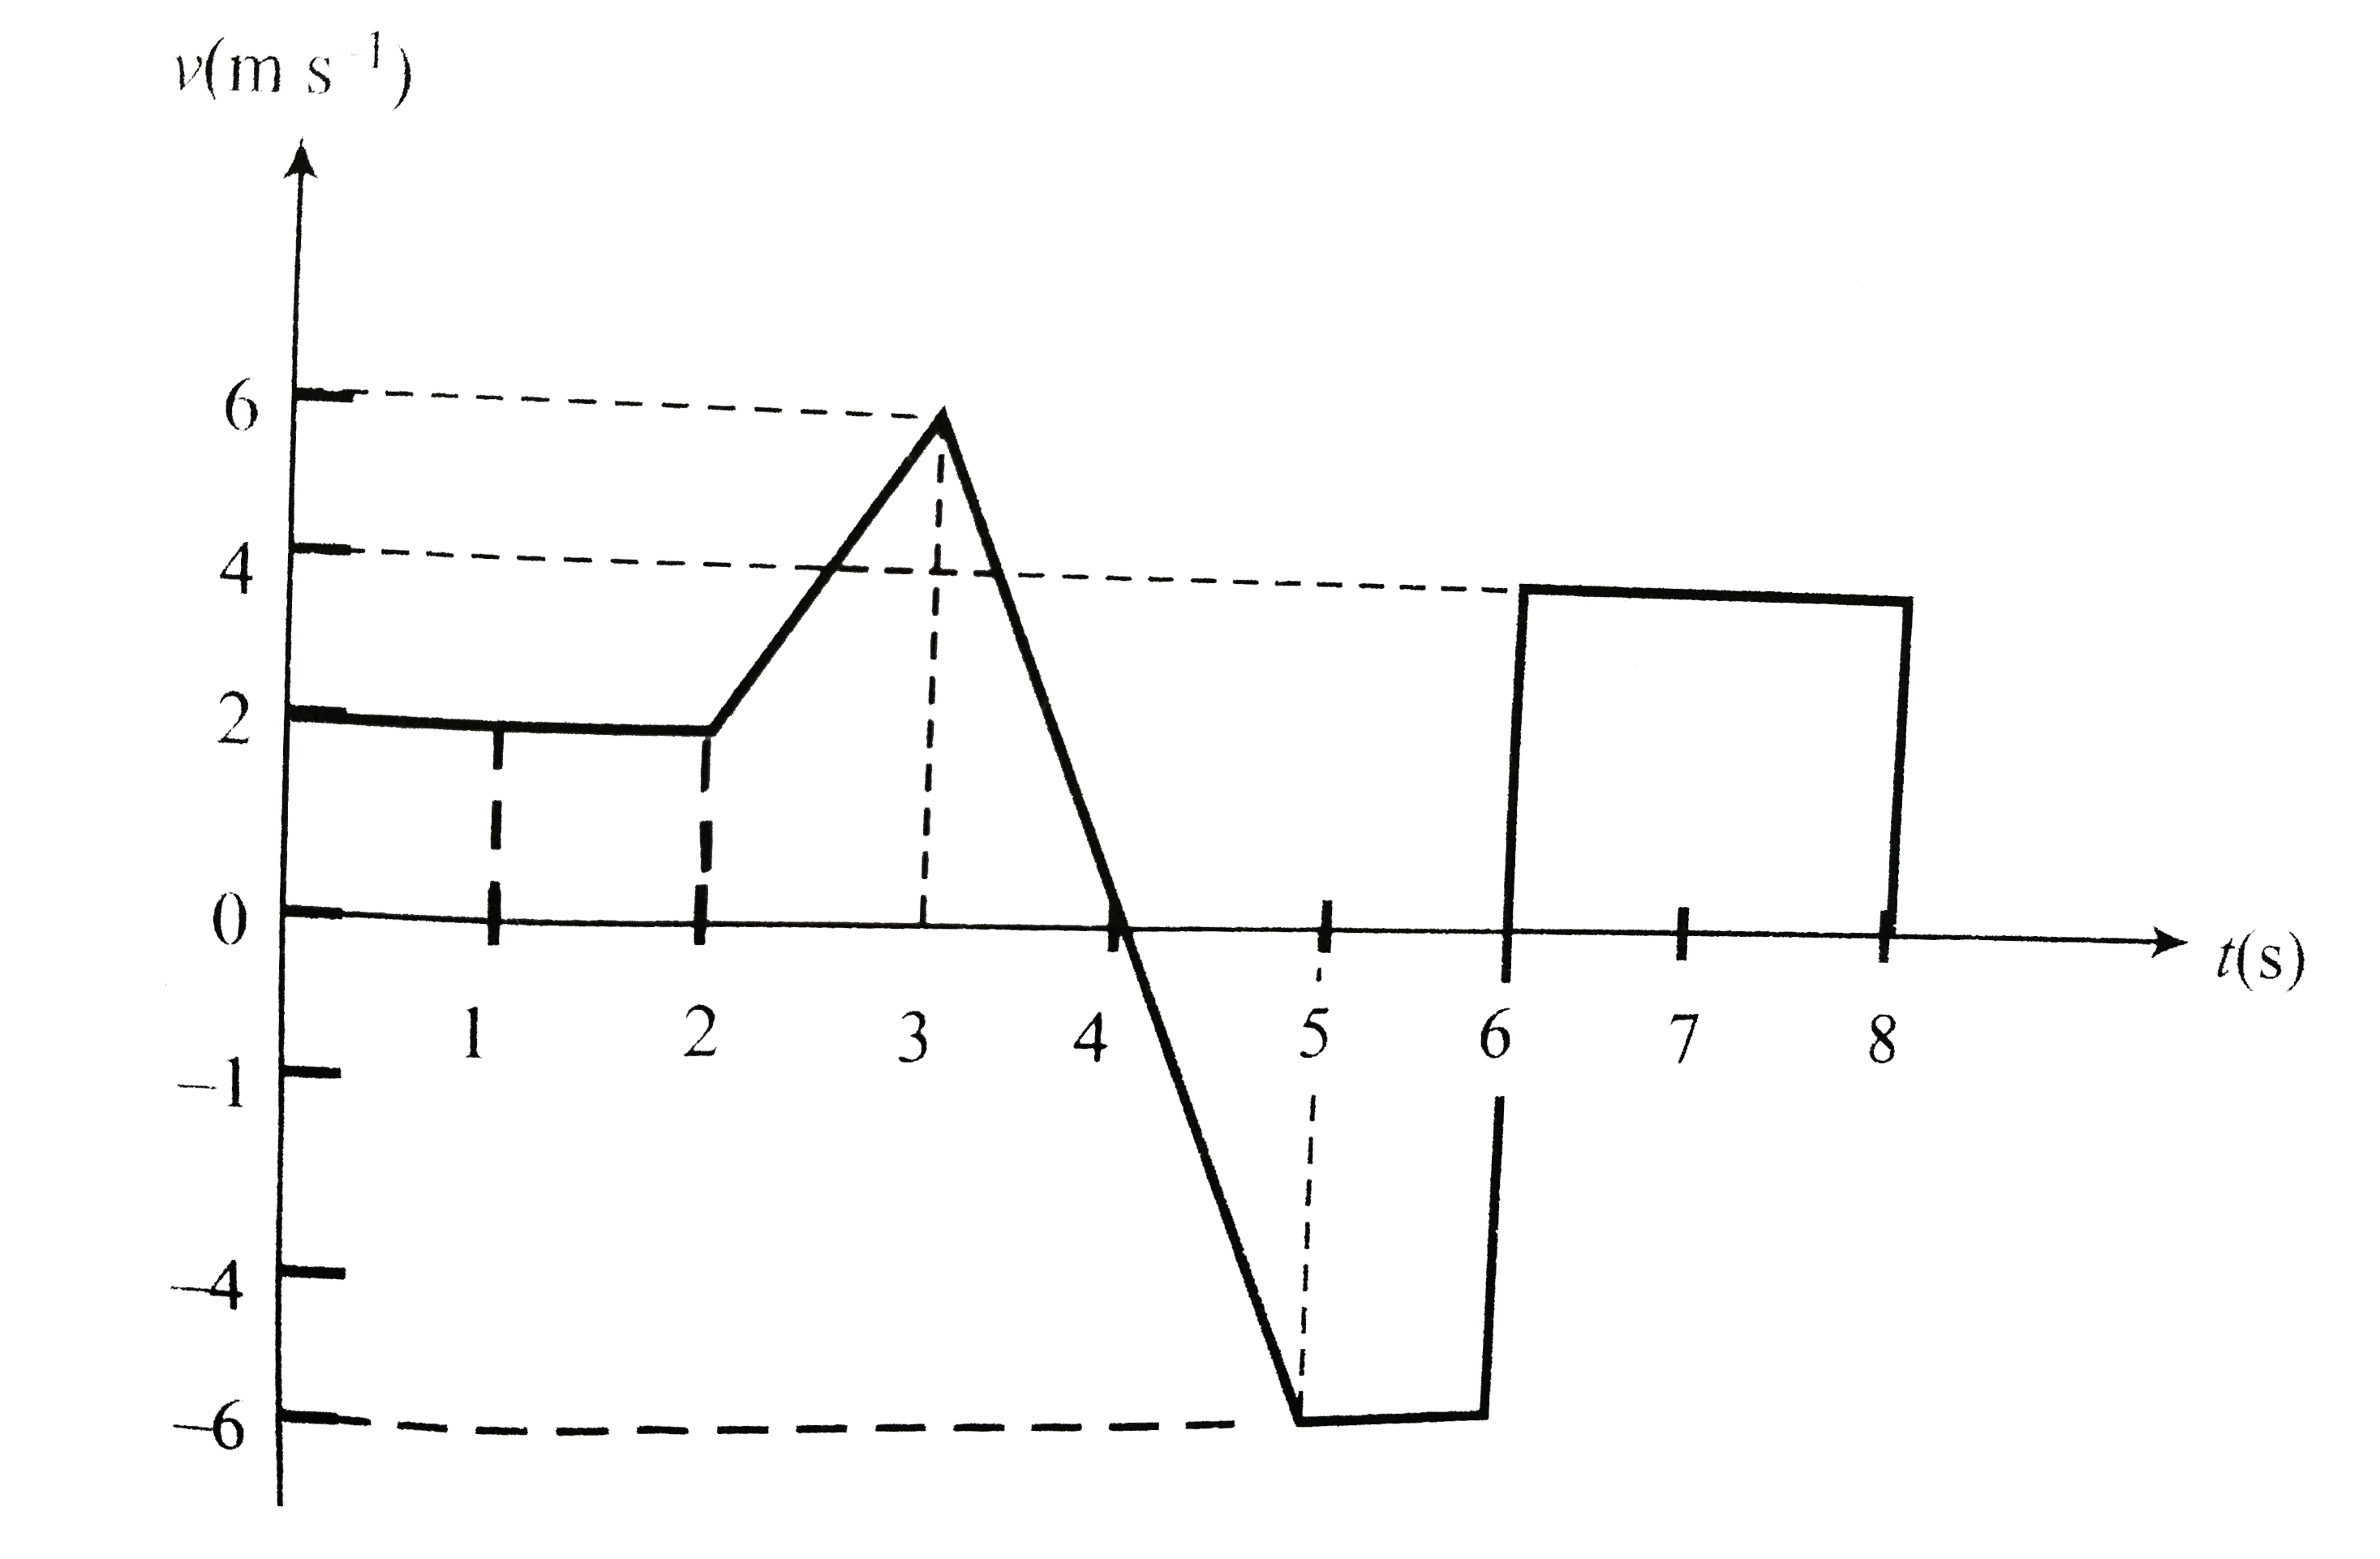
View SolutionThe velocity-time graph of a body is shown in .
The displacement of the body in 8s is.
 .
.
View Solution


 .
.