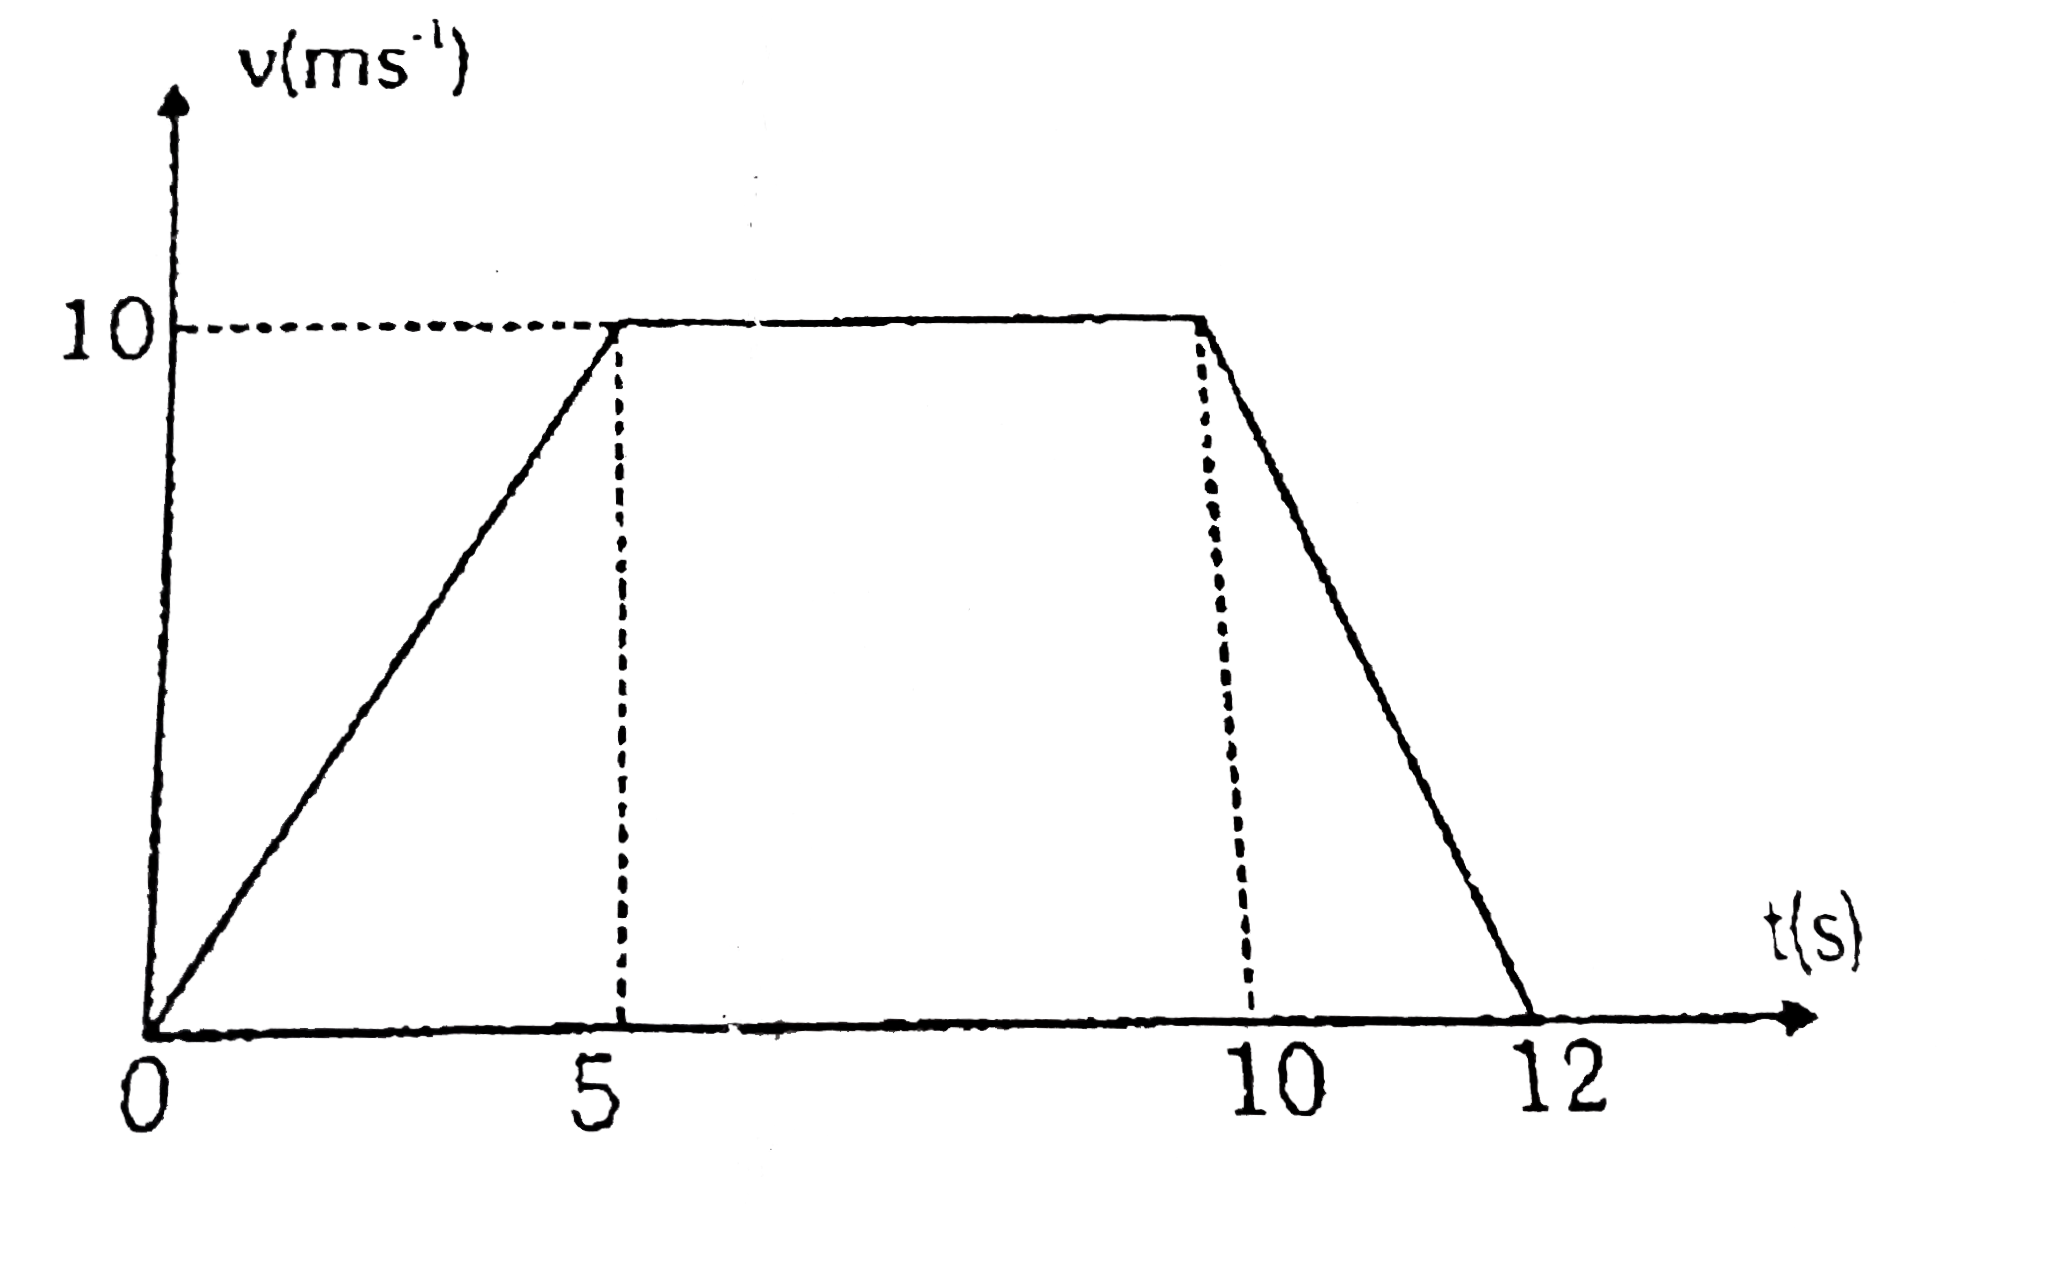
How can you determine the displacement and the acceleration of an object from its velocity-time graph?
To determine the displacement and acceleration of an object from its velocity-time graph, follow these steps:
Step 1: Understand the Axes of the Graph
- The velocity-time graph has time (t) on the x-axis and velocity (v) on the y-axis.
Step 2: Determine Displacement
- Displacement can be found by calculating the area under the velocity-time graph.
- If the graph consists of simple shapes (like rectangles or triangles), you can use geometric formulas to find the area.
- For example, if the graph is a rectangle, the area (displacement) can be calculated as:
Area=Base×Height=Time interval×Velocity
- If the graph is a triangle, the area can be calculated as:
Area=12×Base×Height
- The total area under the curve (taking care of the sign, as areas below the time axis represent negative displacement) gives the total displacement.
Step 3: Determine Acceleration
- Acceleration can be determined by finding the slope of the velocity-time graph.
- The slope is defined as the change in velocity (Δv) divided by the change in time (Δt):
Acceleration(a)=ΔvΔt
- To find the slope, select two points on the line of the graph, calculate the change in velocity and the change in time, and then apply the formula.
Summary
- Displacement is found by calculating the area under the velocity-time graph.
- Acceleration is found by calculating the slope of the velocity-time graph.
---
- The velocity-time graph has time (t) on the x-axis and velocity (v) on the y-axis.
- Displacement can be found by calculating the area under the velocity-time graph.
- If the graph consists of simple shapes (like rectangles or triangles), you can use geometric formulas to find the area.
- For example, if the graph is a rectangle, the area (displacement) can be calculated as:
Area=Base×Height=Time interval×Velocity
- If the graph is a triangle, the area can be calculated as:
Area=12×Base×Height
- The total area under the curve (taking care of the sign, as areas below the time axis represent negative displacement) gives the total displacement.
- Acceleration can be determined by finding the slope of the velocity-time graph.
- The slope is defined as the change in velocity (Δv) divided by the change in time (Δt):
Acceleration(a)=ΔvΔt
- To find the slope, select two points on the line of the graph, calculate the change in velocity and the change in time, and then apply the formula.
- Displacement is found by calculating the area under the velocity-time graph.
- Acceleration is found by calculating the slope of the velocity-time graph.
Topper's Solved these Questions
- MOTION IN STRAIGHT LINEBOOK - AAKASH INSTITUTE ENGLISHCHAPTER - MOTION IN STRAIGHT LINEEXERCISE - Assignment (SECTION - A)
50 Videos
- MOTION IN STRAIGHT LINEBOOK - AAKASH INSTITUTE ENGLISHCHAPTER - MOTION IN STRAIGHT LINEEXERCISE - Assignment (SECTION - B)
19 Videos
- MOTION IN STRAIGHT LINEBOOK - AAKASH INSTITUTE ENGLISHCHAPTER - MOTION IN STRAIGHT LINEEXERCISE - Assignment (SECTION - J)
2 Videos
- MOTION IN A STRAIGHT LINEBOOK - AAKASH INSTITUTE ENGLISHCHAPTER - MOTION IN A STRAIGHT LINEEXERCISE - ASSIGNMENT (SECTION - D)
15 Videos
- MOVING CHARGE AND MAGNESIUMBOOK - AAKASH INSTITUTE ENGLISHCHAPTER - MOVING CHARGE AND MAGNESIUMEXERCISE - SECTION D
16 Videos
Similar Questions
Knowledge Check
Asserion : The acceleration of an object at a particular time is the slope of the velocity-time graph at that instant of time.
Reason : For uniform motion acceleration is zero.AIf both assertion and reason are trure and reason is the correct explanation of assertion.BIf both assertion and reason are true but reason is not the correct explanations of assertion.CIf assertion is true but reason is false.DIf both assertion and reason is false
Which graph corresponds to an object moving with a constant negative acceleration and a positive velocity ?
View SolutionCan an object accelerate If its velocity is constant?
View SolutionHow can you decrease the average density of an object?
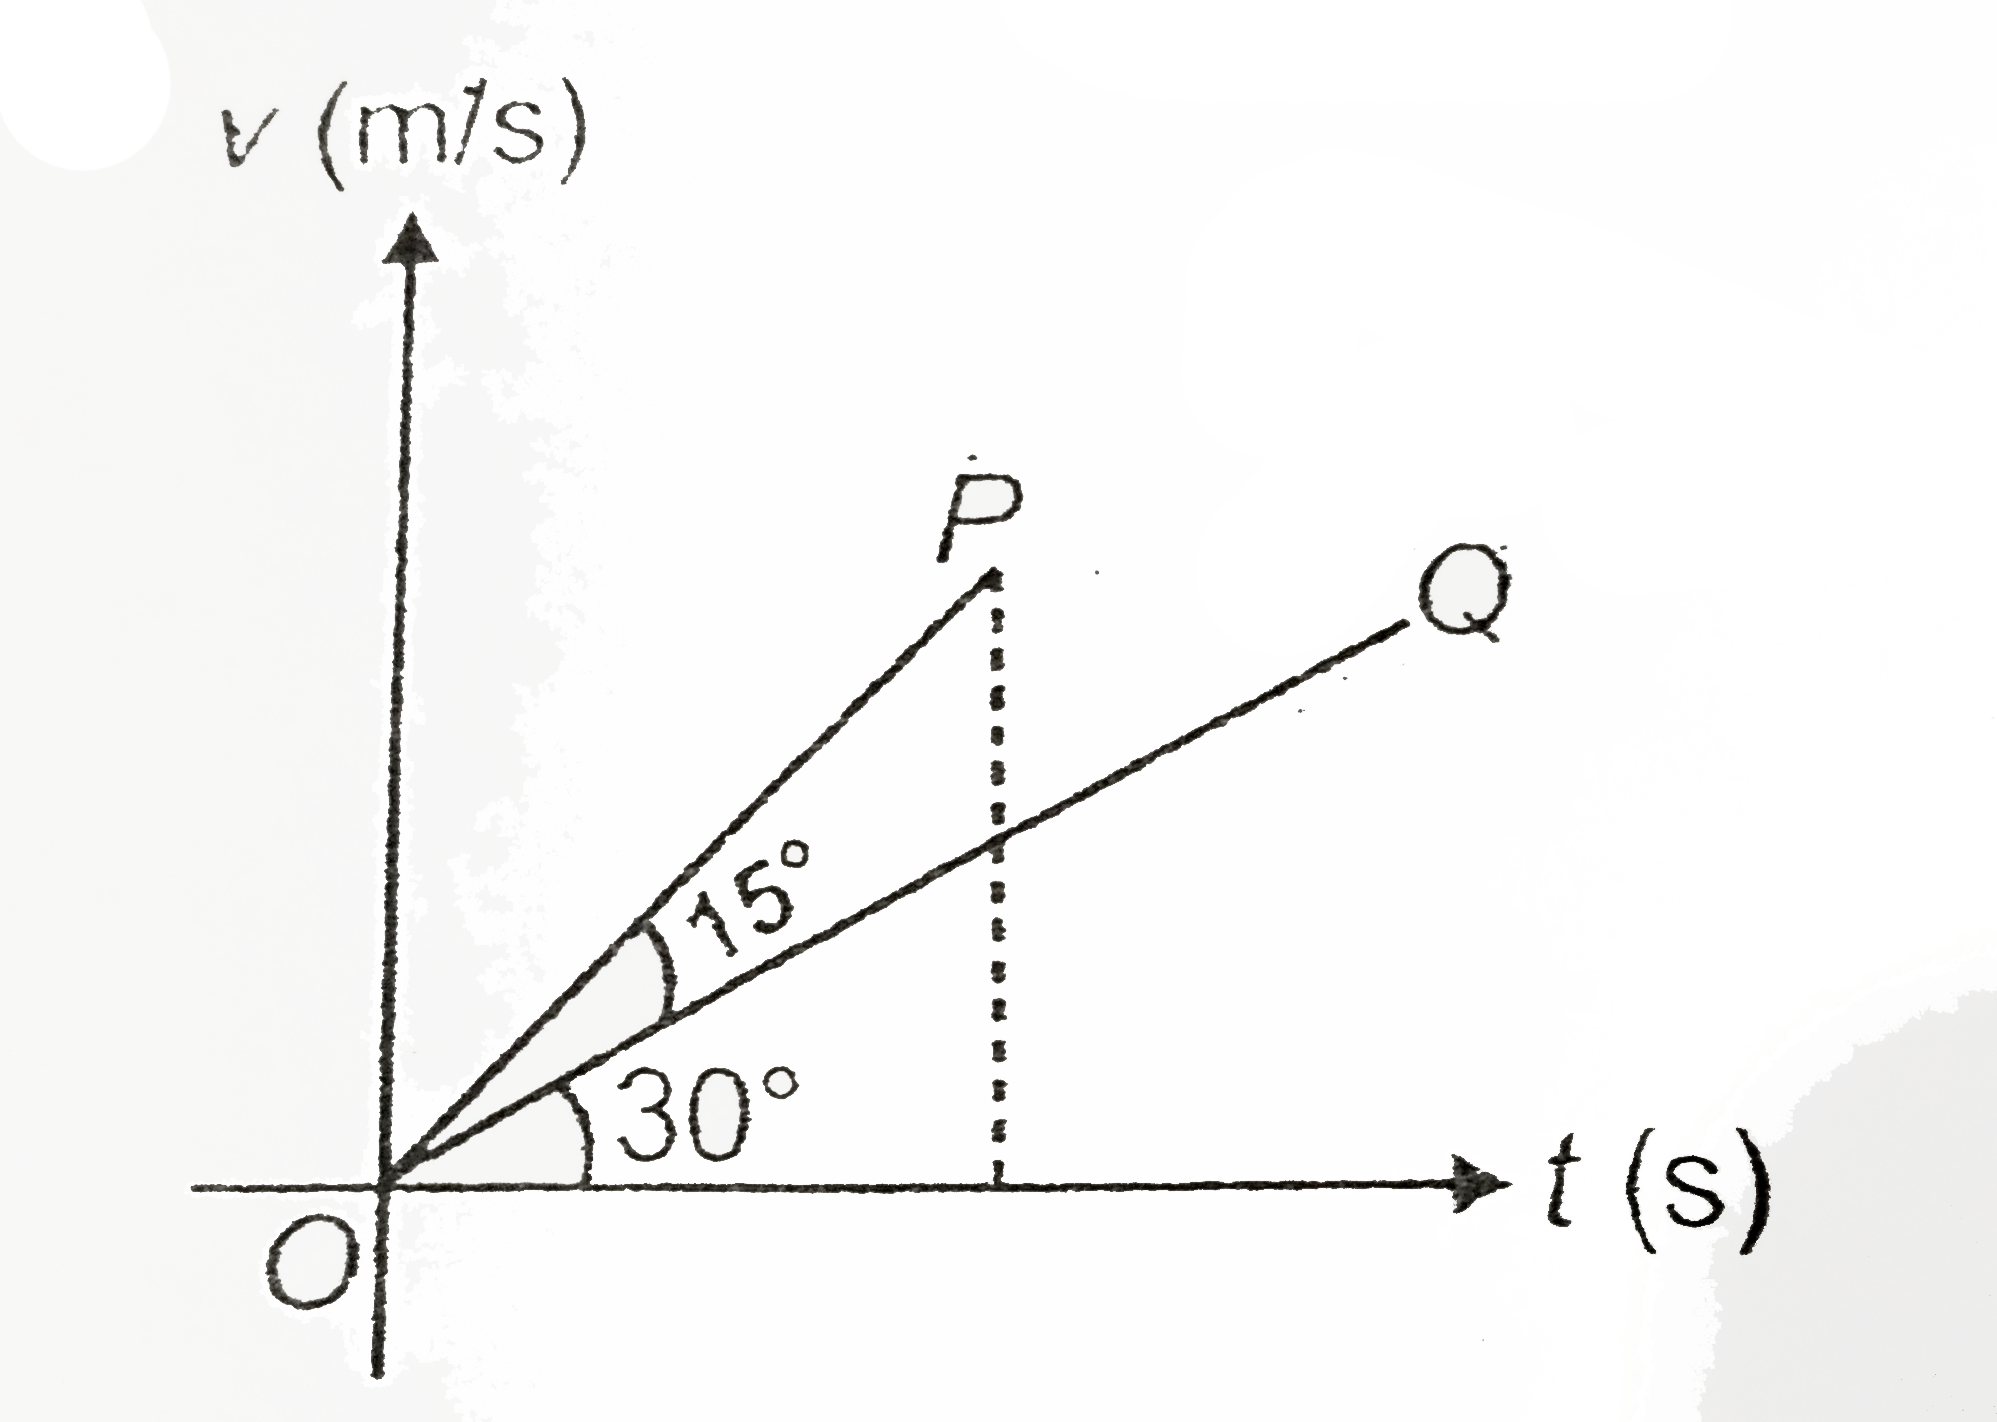
View SolutionGraphs are very useful to represent a physical situation. Various quantities can be easily represented on graphs and other quantites can be determined from the graph. For example the slope of velocity-time graph represents instantaneous acceleration. For a motion with constant acceleration slope of velocity-time graph is constant. If acceleration is changing with time, slope with change and thus velocity-time graph will be a non-linear curve. Further the area of velocity-time graph gives displacement.
The velocity-time graph for two objects P and Q are shown. The ratio of their respective acceleration is
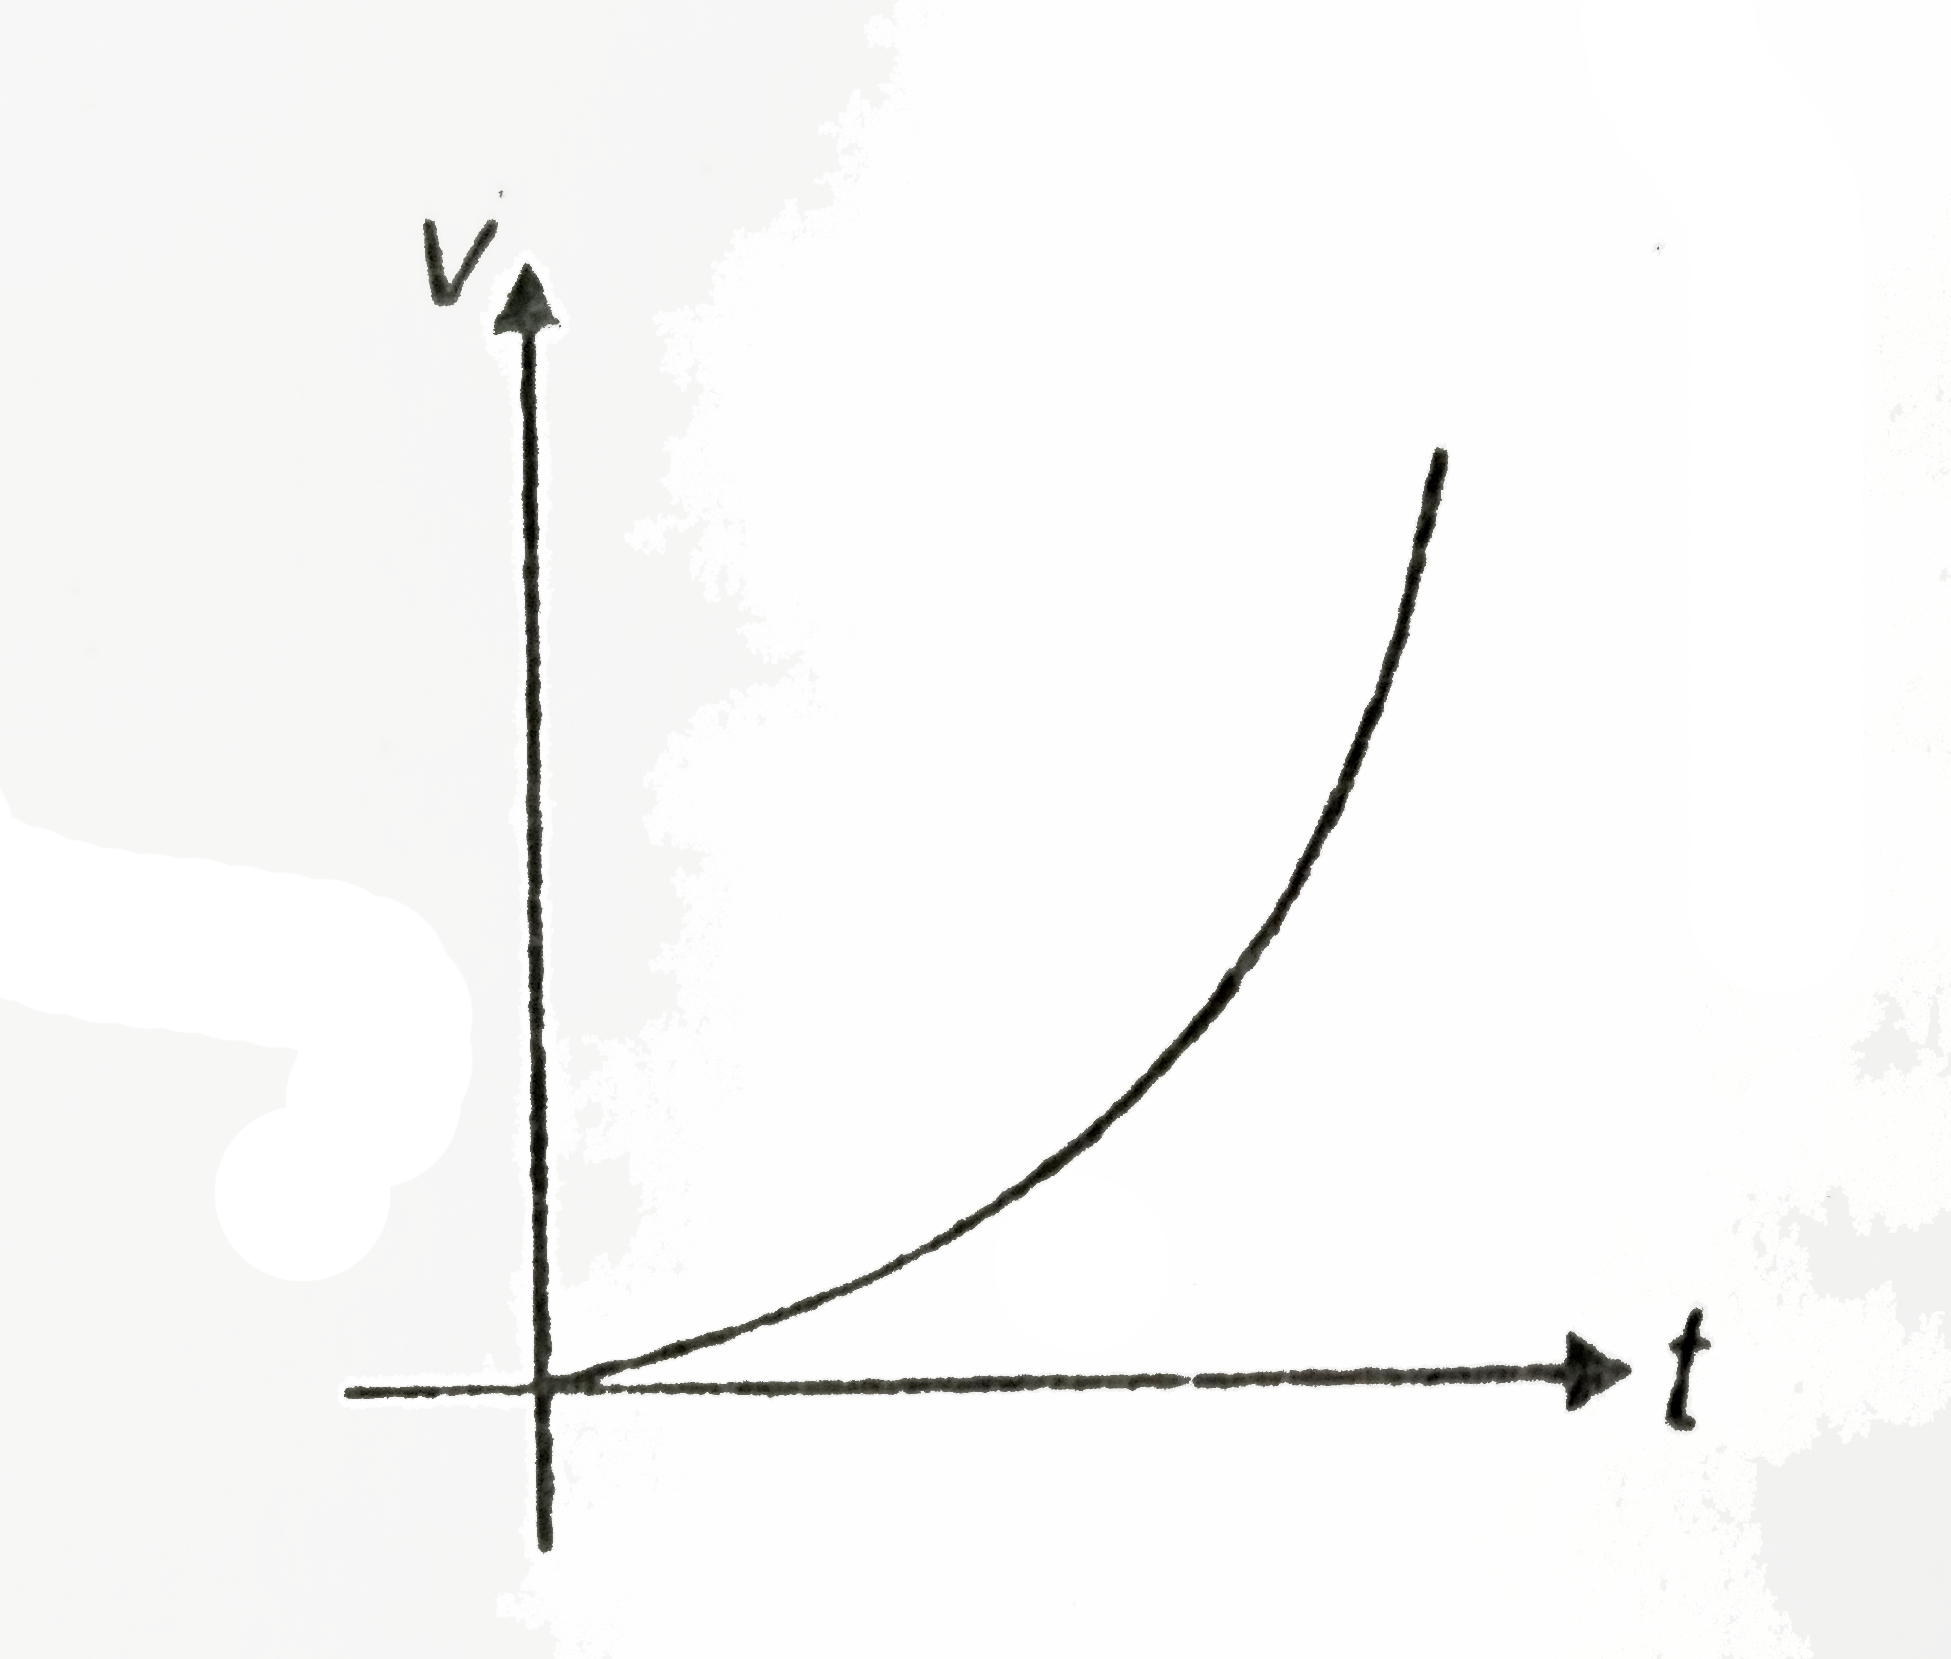
View SolutionGraphs are very useful to represent a physical situation. Various quantities can be easily represented on graphs and other quantites can be determined from the graph. For example the slope of velocity-time graph represents instantaneous acceleration. For a motion with constant acceleration slope of velocity-time graph is constant. If acceleration is changing with time, slope will change and thus velocity-time graph will be a non-linear curve. Further the area of velocity-time graph gives displacement.
For the given velocity-time graph the possibly correct acceleration-time relationship is
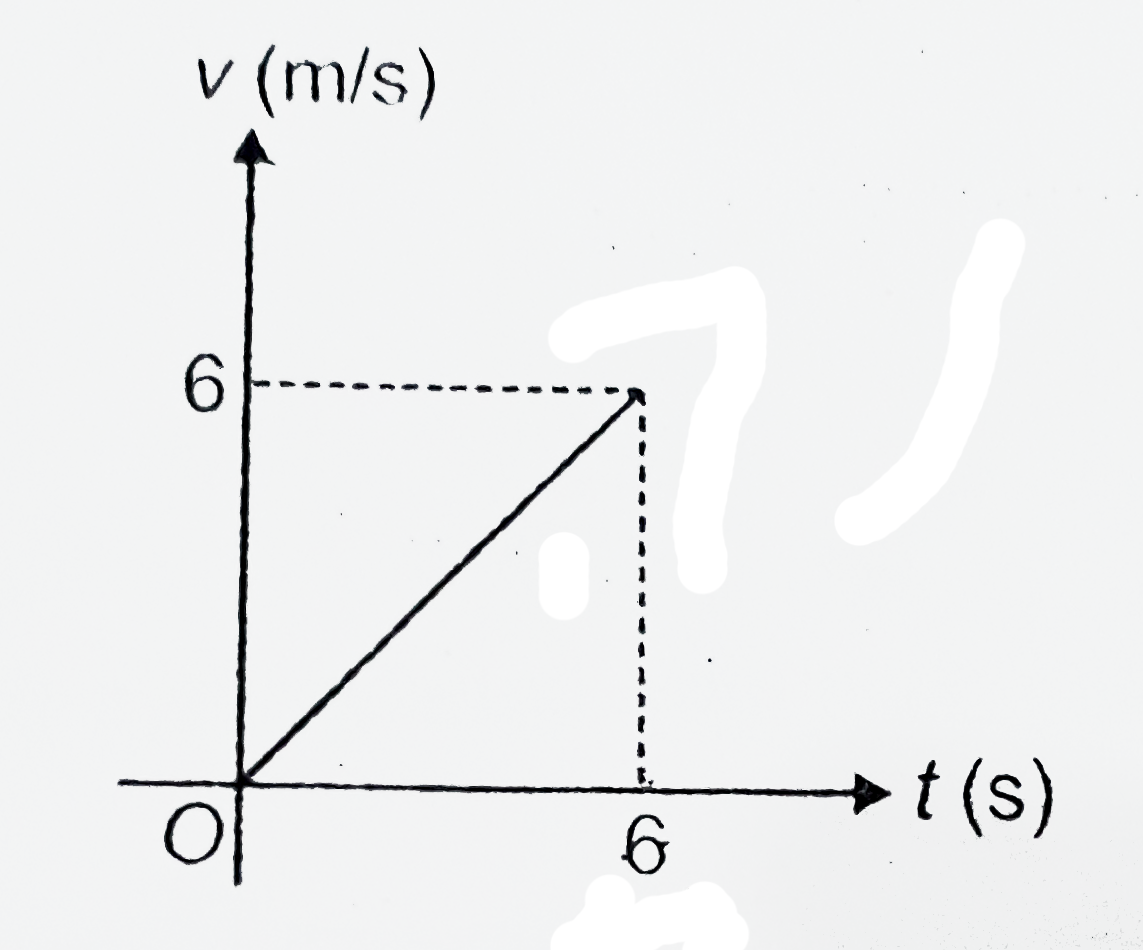
View SolutionGraphs are very useful to represent a physical situation. Various quantities can be easily represented on graphs and other quantites can be determined from the graph. For example the slope of velocity-time graph represents instantaneous acceleration. For a motion with constant acceleration slope of velocity-time graph is constant. If acceleration is changing with time, slope will change and thus velocity-time graph will be a non-linear curve. Further the area of velocity-time graph gives displacement.
For the given velocity-time graph the displacement of the object between t = 2 s to t = 4 s is
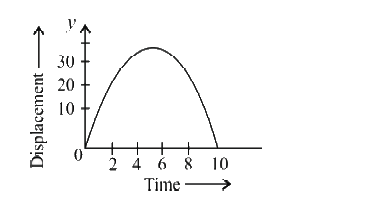
View SolutionThe displacement-time graph of a moving object is shown in figure. Which of the velocity-time graphs shown in figure could represent the motion of the same body ?
View Solution

