निम्न ग्राफ का अध्ययन करे और प्रश्न का उत्तर दे। 2012 में एक कम्पनी के कुल व्यय का प्रतिशत बंटन
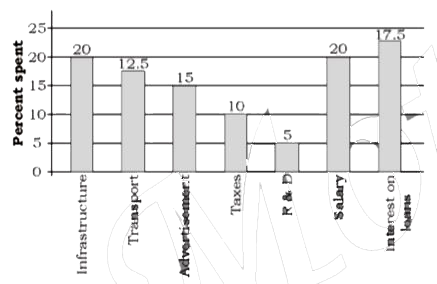
वेतन और ऋण पर ब्याज हेतु किये गए कूल व्यय का, आधारभूत ढांचे (infrastructure) और परिवहन पर किये गए कुल व्यय से अनुपात क्या है?
13:12
14:11
15:13
15:11
The correct Answer is:C
Step by step video, text & image solution for निम्न ग्राफ का अध्ययन करे और प्रश्न का उत्तर दे। 2012 में एक कम्पनी के कुल व्यय का प्रतिशत बंटन वेतन और ऋण पर ब्याज हेतु किये गए कूल व्यय का, आधारभूत ढांचे (infrastructure) और परिवहन पर किये गए कुल व्यय से अनुपात क्या है? by Maths experts to help you in doubts & scoring excellent marks in Class 14 exams.
Updated on:21/07/2023Topper's Solved these Questions
Similar Questions
यदि A:B=2:3 और B:C=3:7, तो A+B:B+C:C+A क्या होगा?
View SolutionP और Q की वर्तमान आयु के बीच का क्रमशः अनुपात 3 : 4 है। चार वर्ष बाद Q, P से पाँच वर्ष बड़ा होगा।P की वर्तमान आयु कितनी है?
View SolutionStudy the given graph and answer the question that follows.
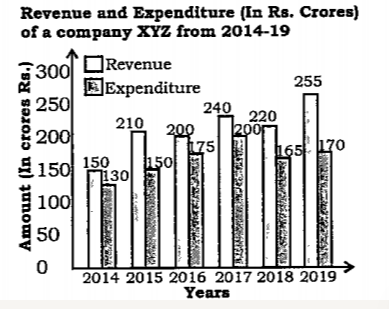
The total revenue in 2015 and 2017 is what per cent of the total expenditure of the company in 2016,2018 and 2019 ( correct to one decimal place)?
दिए गए ग्राफ का अध्ययन करें और नीचे दिए गए प्रश्न का उत्तर दें। 2015 और 2017 2 कुल आय (revenue), 2016, 2018 और 2019 में कंपनी के कुल व्यय (Expenditure) की कितनी प्रतिशत है (दशमलव के बाद एक
स्थान तक गणना करें?
View SolutionThe ratio of incomes of A and B is 3:8 and the ratio of their savings is 9:25. If the income of A equals the expenditure of B, then the ratio of expenditures of A and B is:
A और B की आय में 3 : 8 का अनुपात है तथा उनकी बचत में 9 :25 का अनुपात है | यदि A की आय B के व्यय के बराबर है, तो A और B के व्यय में क्या अनुपात है ?
View SolutionThe given table represents the number of engineers recruited by four companies A,B,C and D over the years. Study the table carefully and answer the questions that follows: The ratio of the total number of engineers recruited by companies A and B in 2015 and 2018 to the total number of engineers recruited by C and D in 2014 and 2018 is: दी गयी तालिका चार कंपनियों A, B, C और D के द्वारा इन वर्षों के दौरान भर्ती किये गए इंजीनियरों की संख्या दर्शाती है | इस तालिका का ध्यानपूर्वक अध्ययन करें तथा इसके बाद पूछे गए प्रश्न का उत्तर दें | कंपनी A और B के द्वारा 2015 और 2018 में भर्ती किये गए इंजीनियरों की कुल संख्या एवं C तथा D के द्वारा 2014 और 2018 में भर्ती किये गए इंजीनियरों की कुल संख्या के बीच अनुपात ज्ञात करें |
View SolutionThe given graph represents the percentage distribution of the total expenditure of a company. Study the graph and answer the question that follows.
दिया गया आरेख एक कंपनी के कुल व्यय के प्रतिशत वितरण को दर्शाता है। आरेख का अध्ययन कीजिए और फिर पूछे गए प्रश्न का उत्तर दीजिए।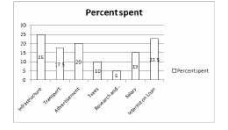 What is the ratio of the total expenditure on .Infrastructure. and .Transport. to the total expenditure on .Taxes. and .Interest on Loans.?
‘आधारभूत संरचना’(Infrastructure) तथा “परिवहन. (Transport) पर किये गए कुल व्यय और “करों (Taxes) तथा “ऋण पर ब्याज.(Interest on loans) पर किये गए कुल व्यय के बीच अनुपात ज्ञात कीजिए।
View SolutionThe given graph represents the percentage distribution of the total expenditure of a company. Study the graph and answer the question that follows.
दिया गया आरेख एक कंपनी के कुल व्यय के प्रतिशत वितरण को दर्शाता है। आरेख का अध्ययन कीजिए और फिर पूछे गए प्रश्न का उत्तर दीजिए।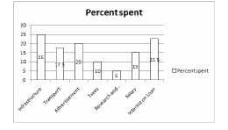 The total expenditure of the company is how many times the total expenditure on .Research
and Development. and .Salary.?
कंपनी का कुल व्यय .शोध तथा विकास (Reaserch and Development)’ और .वेतन.(Salary) पर किये गए कुल व्यय से कितना गुना है ?
View SolutionThe given graph represents the percentage distribution of the total expenditure of a company. Study the graph and answer the question that follows.
दिया गया आरेख एक कंपनी के कुल व्यय के प्रतिशत वितरण को दर्शाता है। आरेख का अध्ययन कीजिए और फिर पूछे गए प्रश्न का उत्तर दीजिए। The expenditure on .Interest on loans. is what percentage more than the expenditure on
.Transport.?
.ऋण पर ब्याज. (Interest on loans) में किया गया व्यय “परिवहन (Transport) पर किये गए व्यय से कितना प्रतिशत अधिक है ?
View Solution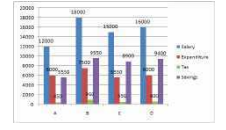
The graph represents the salary, expenditure, tax and savings (in rupees) per month of the persons A, B, C and D. Study the graph and answer the question. The expenditure as a percentage of salary is the least for:
उपरोक्त आरेख व्यक्ति A, B, C और D के प्रतिमाह वेतन, व्यय, कर तथा बचत ( रुपये में) को दर्शाता है। इस आरेख का अध्ययन करें तथा प्रश्न का उत्तर दें। वेतन(Salary) के प्रतिशत के रूप में सबसे कम व्यय(Expenditure) किसका है?
View SolutionStudy the given graph and answer the questions that follow.
दिए गए आरेख का अध्ययन करें और उन सवालों के जवाब दें, जो अनुसरण करते हैं।
The total revenue in 2015 and 2017 is what percent of the total expenditure of the company in 2016, 2018 and 2019 (correct to one decimal place) ?
2015 और 2017 में कुल राजस्व 2016, 2018 और 2019 में कंपनी के कुल व्यय का कितना प्रतिशत है (एक दशमलव स्थान तक )?
View SolutionThe following pie chart shows percentage expenditure of a country on different heads. The total expenditure is Rs.1,680 (in billions). Study the chart and answer the questions
निम्नलिखित पाई चार्ट अलग-अलग प्रमुखों पर किसी देश का प्रतिशत व्यय दर्शाता है। कुल खर्च रु1,680 (अरबों में)। चार्ट का अध्ययन करें और प्रश्नों का उत्तर दें |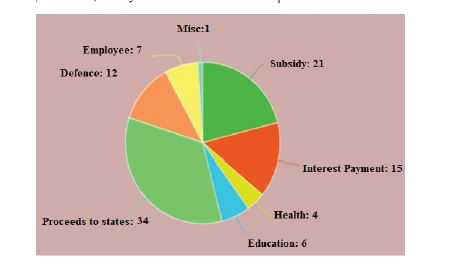 The central angle of the sector representing expenditure on subsidy is :
सब्सिडी पर व्यय का प्रतिनिधित्व करने वाले क्षेत्र का केंद्रीय कोण ज्ञात करे |
View SolutionThe following pie chart shows percentage expenditure of a country on different heads. The total expenditure in Rs. 1,680(in billion). Study the chart and answer the question.
निम्नलिखित पाई चार्ट अलग-अलग प्रमुखों पर किसी देश का प्रतिशत व्यय दर्शाता है। 1,680 (बिलियन में) कुल खर्च। चार्ट का अध्ययन करें और प्रश्न का उत्तर दें।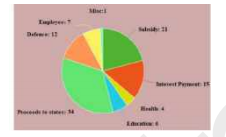
The expenditure on Education is what percentage less than the expenditure on defence ?
शिक्षा पर व्यय रक्षा पर व्यय से कितना प्रतिशत कम है |
View SolutionThe following pie chart shows percentage expenditure of a country on different heads. The total expenditure in Rs. 1,680(in billion). Study the chart and answer the question.
निम्नलिखित पाई चार्ट अलग-अलग प्रमुखों पर किसी देश का प्रतिशत व्यय दर्शाता है। 1,680 (बिलियन में) कुल खर्च। चार्ट का अध्ययन करें और प्रश्न का उत्तर दें।
The central angle of the sector representing expenditure on interest payment is:
ब्याज भुगतान पर व्यय का प्रतिनिधित्व करने वाले क्षेत्र का केंद्रीय कोण है
View SolutionThe ratio of the incomes of A and B is 2:3 and that of their expenditures is 1:2. If 90% of B’s expenditure is equal to the income of A, then what is the ratio of the savings of A and B? A और B की आय का अनुपात 2: 3 है और उनके व्यय का अनुपात 1: 2 है यदि B के व्यय का 90% A की आय के बराबर है तो A और B की बचत का अनुपात कितना है?
View SolutionThe given Bar Graph presents Income and Expenditure (in crores of Rupees) of a company for five years, 2014 to 2018. What is the ratio of total Expenditure to total Income of the company in 2014,2016 and 2017? दिया गया दंड आरेख (बार ग्राफ) 5 वर्षों, 2014 से 2018 के दौरान किसी कंपनी की आय और व्यय (करोड़ रुपए में) को दर्शाता है| 2014, 2016 और 2017 में कंपनी के कुल व्यय और कुल आय का अनुपात क्या है?
View SolutionStudy the following graph which shows income and expenditure of a company over the years and answer the questions. In how many years was the expenditure of the company more than the average expenditure of the given years? निम्नलिखित चार्ट का अध्ययन कीजिए जिसमें कंपनी की कुछ वर्षों की आय एवं उसके व्यय को दर्शाया गया है और प्रश्नों के उत्तर दीजिए : कितने वर्षों में कंपनी का व्यय दिए गए वर्षों के औसत व्यय से अधिक था?
View Solution
