नीचे दिया गया दण्ड आलेख वर्ष 1993 में एक परिवार की आय का विभिन्न मदों पर व्यय एवं बचत को दर्शाता है। आलेख का ध्यानपूर्वक अवलोकन कीजिए तथा उत्तर दीजिए:
1993 में व्यय की गयी पारिवारिक आय (प्रतिशत में)
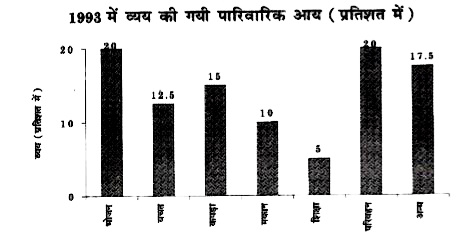
Expenditure on food is how much percent more than expenditure on others ?
भोजन पर किया गया व्यय अन्य से कितना प्रतिशत अधिक है?
5
10
12.5
2.5
The correct Answer is:D
अभीष्ट अंतर = (20-17.5) =2.5%
Similar Questions
नीचे दिया गया दण्ड आलेख वर्ष 1993 में एक परिवार की आय का विभिन्न मदों पर व्यय एवं बचत को दर्शाता है। आलेख का ध्यानपूर्वक अवलोकन कीजिए तथा उत्तर दीजिए:
1993 में व्यय की गयी पारिवारिक आय (प्रतिशत में)
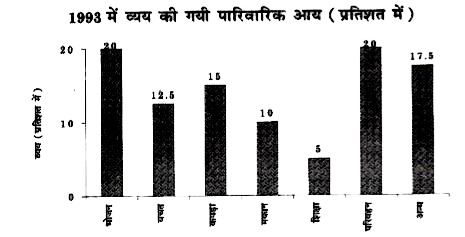
Percentage of expenditure on cloths is how much more than saving percentage ?
कपड़े पर व्यय का प्रतिशत, बचत प्रतिशत से कितना अधिक है?
View Solutionनीचे दिया गया दण्ड आलेख वर्ष 1993 में एक परिवार की आय का विभिन्न मदों पर व्यय एवं बचत को दर्शाता है। आलेख का ध्यानपूर्वक अवलोकन कीजिए तथा उत्तर दीजिए:
1993 में व्यय की गयी पारिवारिक आय (प्रतिशत में)
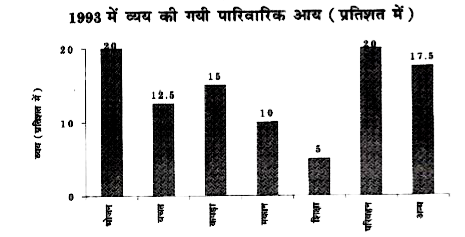
If in 1993 total income of family was ₹ 1,00,000, then what was total saving of family in 1993 ?
यदि वर्ष 1993 में परिवार की कुल आय ₹ 1,00,000 थी, तो 1993 में परिवार की कुल बचत थी -
View SolutionThe given graph represents the percentage distribution of the total expenditure of a company. Study the graph and answer the question that follows.
दिया गया आरेख एक कंपनी के कुल व्यय के प्रतिशत वितरण को दर्शाता है। आरेख का अध्ययन कीजिए और फिर पूछे गए प्रश्न का उत्तर दीजिए। The expenditure on .Interest on loans. is what percentage more than the expenditure on
.Transport.?
.ऋण पर ब्याज. (Interest on loans) में किया गया व्यय “परिवहन (Transport) पर किये गए व्यय से कितना प्रतिशत अधिक है ?
View SolutionThe pie chart given below shows the expenditure on various items and savings of a family during the year 2009. Study the pie chart and answer these questions.
नीचे दिया गया याई-चार्ट वर्ष २००९ में एक परिवार द्वारा विभिन्न मदों पर व्यय की गई धनराशि तथा बचत को प्रदर्शित करता है। पाईं-चार्ट का अध्ययन कीजिये तथा इस पर आधारित प्रश्नों का उत्तर दीजिये-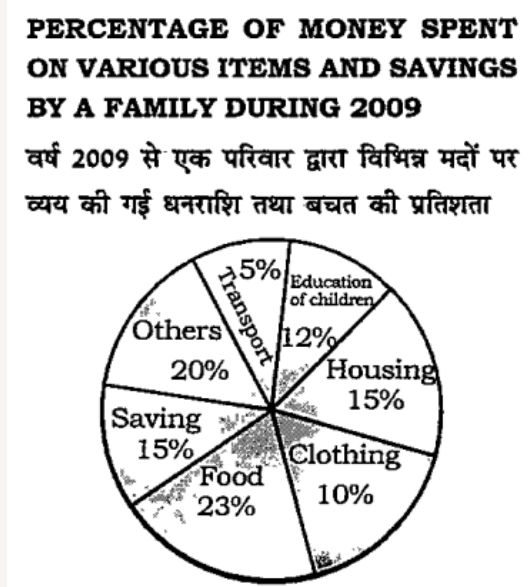 Maximum expenditure of the family other than on food, was on
परिवार द्वारा किसी मद पर भोजन के सिवाय सर्वाधिक व्यय किया गया?
View SolutionThe following pie chart shows percentage expenditure of a country on different heads. The total expenditure in Rs. 1,680(in billion). Study the chart and answer the question.
निम्नलिखित पाई चार्ट अलग-अलग प्रमुखों पर किसी देश का प्रतिशत व्यय दर्शाता है। 1,680 (बिलियन में) कुल खर्च। चार्ट का अध्ययन करें और प्रश्न का उत्तर दें।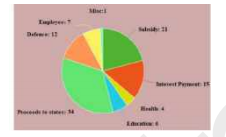
The expenditure on Education is what percentage less than the expenditure on defence ?
शिक्षा पर व्यय रक्षा पर व्यय से कितना प्रतिशत कम है |
View SolutionThe given graph represents the percentage distribution of the total expenditure of a company. Study the graph and answer the question that follows.
दिया गया आरेख एक कंपनी के कुल व्यय के प्रतिशत वितरण को दर्शाता है। आरेख का अध्ययन कीजिए और फिर पूछे गए प्रश्न का उत्तर दीजिए।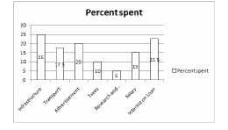 The total expenditure of the company is how many times the total expenditure on .Research
and Development. and .Salary.?
कंपनी का कुल व्यय .शोध तथा विकास (Reaserch and Development)’ और .वेतन.(Salary) पर किये गए कुल व्यय से कितना गुना है ?
View SolutionThe pie chart given below shows the expenditure on various items and savings of a family during the year 2009. Study the pie chart and answer these questions.
नीचे दिया गया याई-चार्ट वर्ष २००९ में एक परिवार द्वारा विभिन्न मदों पर व्यय की गई धनराशि तथा बचत को प्रदर्शित करता है। पाईं-चार्ट का अध्ययन कीजिये तथा इस पर आधारित प्रश्नों का उत्तर दीजिये-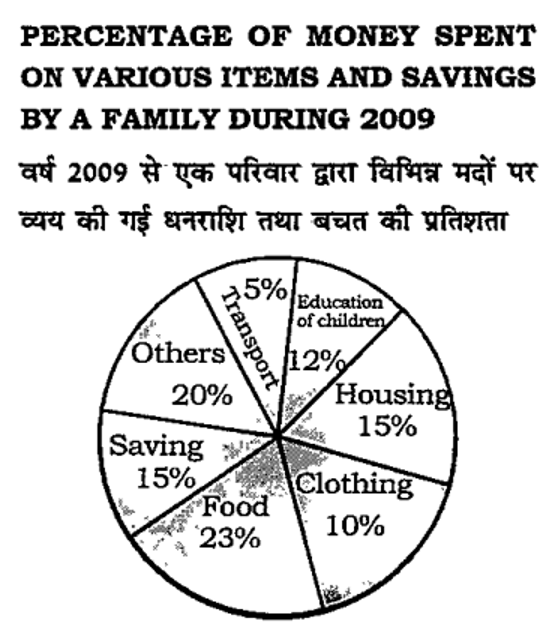
If the total income of the family for the year 2009 was Rs.1,50,000 then the difference between the expenditures on housing and transport was
यदि वर्ष 2009 में परिवार को कुल आय 1,50,000 रुपये रही हो, तो आवास तथा परिवहन पर किये गये व्ययों का अंतर था?
View SolutionThe given Bar Graph presents Income and Expenditure (in crores of Rupees) of a company for the five years, 2014 to 2018.
दिया गया दंड आरेख पांच वर्षों अर्थात 2014 से 2018 तक एक कंपनी के आय एवं व्यय ( करोड़ रुपये में ) को दर्शाता है |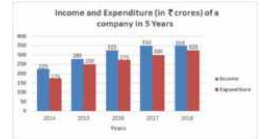 The average Income (per year) of the company in five years is what percentage more than its
Expenditure in 2015?
पांच वर्षों में कंपनी की औसत आय (प्रति वर्ष ) 2015 में इसके व्यय से कितना प्रतिशत अधिक है ?
View SolutionIn the given bar graph, the Blue bar shows the income and the Red bar shows the expenditure of a company. Study the graph and answer the question that follows
दिए गए दंड आरेख में, नीला दंड एक कंपनी की आय दिखाता है और लाल दंड खर्च (लाख रुपये में) को दर्शाता है। आरेख का अध्ययन करें और उस प्रश्न का उत्तर दें जो नीचे पूछा गया है। The percentage decrease in the income of the company in 2002 as compared to that in 2001 is:
2001 की तुलना में 2002 में कंपनी की आय में कितने प्रतिशत में कमी आई है:
View SolutionThe Bar graph shown below presents the number of employees in an office during eight consecutive years.
नीचे दिया गया दंड आरेख किसी कार्यालय में आठ लगातार वर्षों के दौरान कर्मचारियों की संख्या को दर्शाता है |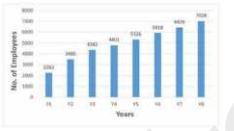
The number of employees in year Y2 is how much percent less than the average number of employees per year?
वर्ष Y2 में कर्मचारियों की संख्या प्रति वर्ष कर्मचारियों की औसत संख्या से कितना प्रतिशत कम है ?
View Solution
