नीचे दिया गया दण्ड आलेख वर्ष 1993 में एक परिवार की आय का विभिन्न मदों पर व्यय एवं बचत को दर्शाता है। आलेख का ध्यानपूर्वक अवलोकन कीजिए तथा उत्तर दीजिए:
1993 में व्यय की गयी पारिवारिक आय (प्रतिशत में)
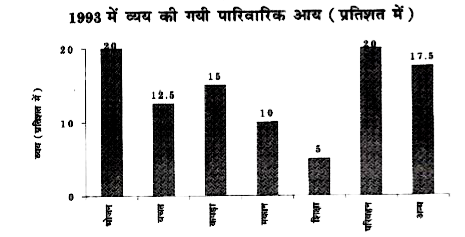
If in 1993 total income of family was ₹ 1,00,000, then what was total saving of family in 1993 ?
यदि वर्ष 1993 में परिवार की कुल आय ₹ 1,00,000 थी, तो 1993 में परिवार की कुल बचत थी -
₹1,760
₹20,000
₹12,500
₹50,000
The correct Answer is:C
परिवार की कुल बचत =100000×12.5100
Rs. 12500
Similar Questions
नीचे दिया गया दण्ड आलेख वर्ष 1993 में एक परिवार की आय का विभिन्न मदों पर व्यय एवं बचत को दर्शाता है। आलेख का ध्यानपूर्वक अवलोकन कीजिए तथा उत्तर दीजिए:
1993 में व्यय की गयी पारिवारिक आय (प्रतिशत में)
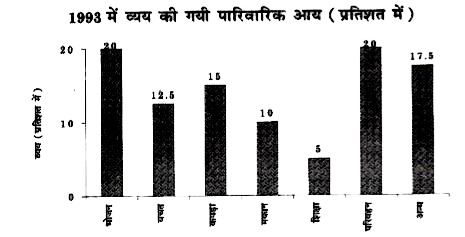
Percentage of expenditure on cloths is how much more than saving percentage ?
कपड़े पर व्यय का प्रतिशत, बचत प्रतिशत से कितना अधिक है?
View Solutionनीचे दिया गया दण्ड आलेख वर्ष 1993 में एक परिवार की आय का विभिन्न मदों पर व्यय एवं बचत को दर्शाता है। आलेख का ध्यानपूर्वक अवलोकन कीजिए तथा उत्तर दीजिए:
1993 में व्यय की गयी पारिवारिक आय (प्रतिशत में)
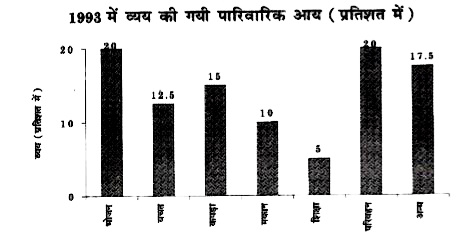
Expenditure on food is how much percent more than expenditure on others ?
भोजन पर किया गया व्यय अन्य से कितना प्रतिशत अधिक है?
View Solution
Knowledge Check
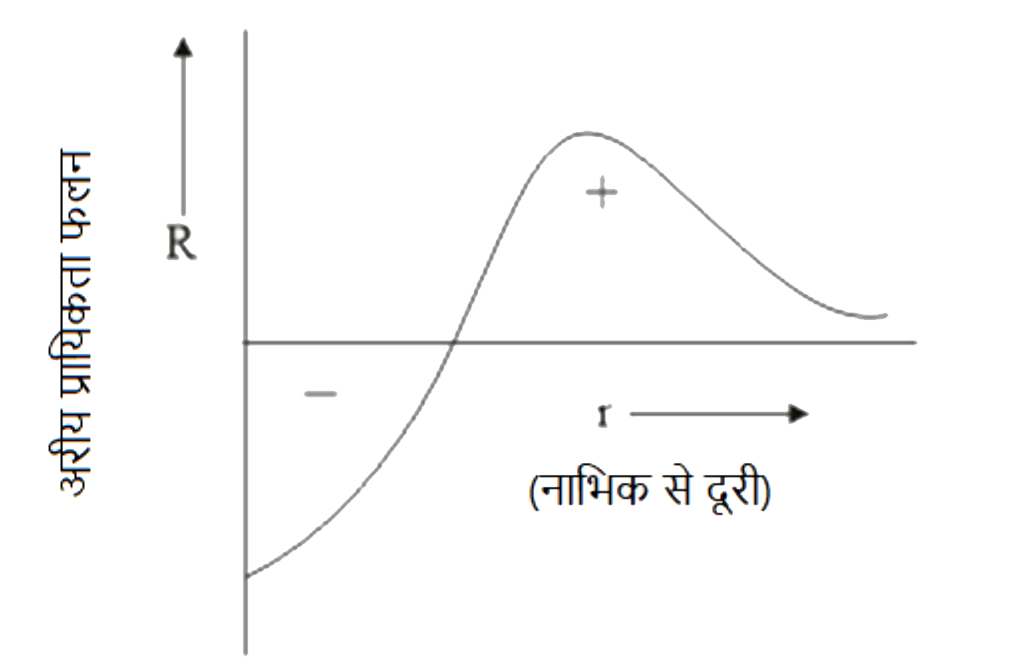
उपरोक्त आलेख में नोडों की संख्या है:A1B2C3D4
The pie chart given below shows the expenditure on various items and savings of a family during the year 2009. Study the pie chart and answer these questions.
नीचे दिया गया याई-चार्ट वर्ष २००९ में एक परिवार द्वारा विभिन्न मदों पर व्यय की गई धनराशि तथा बचत को प्रदर्शित करता है। पाईं-चार्ट का अध्ययन कीजिये तथा इस पर आधारित प्रश्नों का उत्तर दीजिये-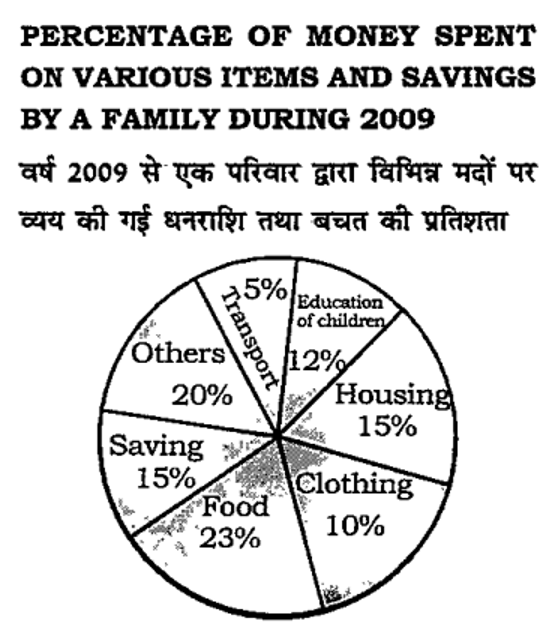
If the total income of the family for the year 2009 was Rs.1,50,000 then the difference between the expenditures on housing and transport was
यदि वर्ष 2009 में परिवार को कुल आय 1,50,000 रुपये रही हो, तो आवास तथा परिवहन पर किये गये व्ययों का अंतर था?
View Solutionनिम्नलिखित प्रश्नो के उत्तर दीजिए :
'एक मुट्ठी छाँव' कहानी में चित्रित परिवार की सह्दयता का परिचय दीजिए ।
View SolutionThe pie chart given below shows the expenditure on various items and savings of a family during the year 2009. Study the pie chart and answer these questions.
नीचे दिया गया याई-चार्ट वर्ष २००९ में एक परिवार द्वारा विभिन्न मदों पर व्यय की गई धनराशि तथा बचत को प्रदर्शित करता है। पाईं-चार्ट का अध्ययन कीजिये तथा इस पर आधारित प्रश्नों का उत्तर दीजिये-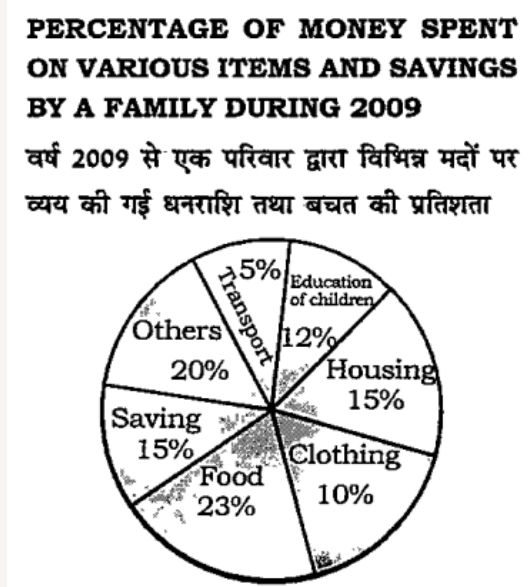 Maximum expenditure of the family other than on food, was on
परिवार द्वारा किसी मद पर भोजन के सिवाय सर्वाधिक व्यय किया गया?
View SolutionThe given Bar Graph presents the data of annual income (A) and annual expenditure (B) of an IT officer in a multi-national company during the years 2012 to 2016.
दिया गया दंड आरेख वर्ष 2012 से 2016 के दौरान किसी बहुराष्ट्रीय कंपनी में कार्यरत एक आईटी अधिकारी अधिकारी की वार्षिक आय ( A ) और वार्षिक व्यय (B) के आंकड़ों को दर्शाता है |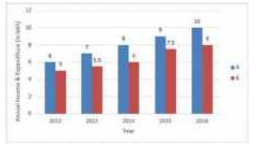 What is the
what is the percentage of his total savings with reference to his total income for the period 2012-15?
2012 से 2015 की अवधि में उसकी कुल आय के संदर्भ में उसकी कुल बचत का प्रतिशत कितना है ?
View SolutionThe following pie-chart shows the monthly expenditure of a family on various items. If the family spends Rs. 825 on clothing, answer the question.
निम्नलिखित पाई-चार्ट में किसी परिवार के विभिन्न मदों पर होने वाले खर्च का दर्शाया गया है। यदि परिवार वस्त्रों पर 825 रू खर्च करे तो प्रश्न का उत्तर दीजिए।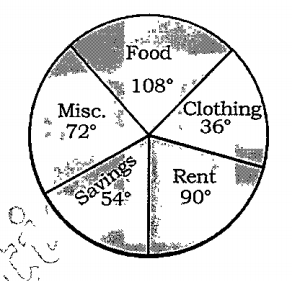 The ratio of average of expenses on food, clothing and miscellaneous items to the average of expenses on savings and rent is
भोजन, वस्त्र ओर विविध मदों पर होने वाले खर्च के औसत का बचत और किराये पर होने वाले खर्च के औसत से अनुपात क्या है?
View SolutionThe given Bar Graph presents the sales of the number of books (in thousands) by six benches of a publishing company during two consecutive years 2000 and 2001.
दिया गया दंड आरेख लगातार दो वर्षों : 2000 और 2001 में एक प्रकाशन कंपनी की छः शाखाओं के द्वारा बेची गयी पुस्तकों की संख्या ( हज़ार में ) दर्शाता है |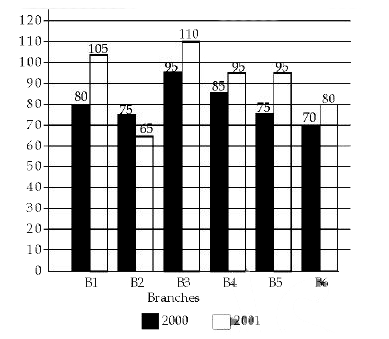 The ratio of total sales by all branches for the year 2001 to total sales by all branches for the year 2000 is:
वर्ष 2001 में सभी शाखाओं की कुल बिक्री का वर्ष 2000 में सभी शाखाओं की कुल बिक्री के साथ अनुपात ज्ञात करें|
View SolutionIn the given bar graph, the Blue bar shows the income and the Red bar shows the expenditure of a company. Study the graph and answer the question that follows
दिए गए दंड आरेख में, नीला दंड एक कंपनी की आय दिखाता है और लाल दंड खर्च (लाख रुपये में) को दर्शाता है। आरेख का अध्ययन करें और उस प्रश्न का उत्तर दें जो नीचे पूछा गया है। The percentage decrease in the income of the company in 2002 as compared to that in 2001 is:
2001 की तुलना में 2002 में कंपनी की आय में कितने प्रतिशत में कमी आई है:
View Solution
