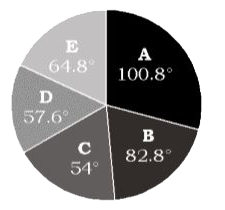
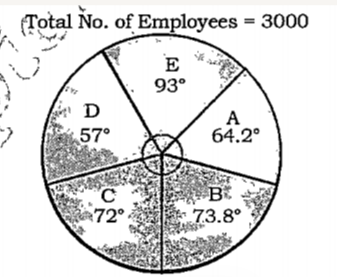
पाई-चार्ट का अध्ययन करे और उसके बाद दिए गए प्रश्न का उत्तर दे -

यदि कार्यालय E से 50% कर्मचारियों को कार्यालय D में स्थान्तरित किये जाये, तो कम्पनी के कुल कमर्चारियों की संख्या के कितने प्रतिशत कर्मचारी कार्यालय D में है ?
28
25
26
30
The correct Answer is:B
Step by step video, text & image solution for पाई-चार्ट का अध्ययन करे और उसके बाद दिए गए प्रश्न का उत्तर दे - यदि कार्यालय E से 50% कर्मचारियों को कार्यालय D में स्थान्तरित किये जाये, तो कम्पनी के कुल कमर्चारियों की संख्या के कितने प्रतिशत कर्मचारी कार्यालय D में है ? by Maths experts to help you in doubts & scoring excellent marks in Class 14 exams.
Updated on:21/07/2023Topper's Solved these Questions
Similar Questions
यदि A:B=2:3 और B:C=3:7, तो A+B:B+C:C+A क्या होगा?
View SolutionP और Q की वर्तमान आयु के बीच का क्रमशः अनुपात 3 : 4 है। चार वर्ष बाद Q, P से पाँच वर्ष बड़ा होगा।P की वर्तमान आयु कितनी है?
View SolutionDetermine the point of symmetry of a regular hexagon.
View SolutionMatch the following Column A to Column B

View SolutionMatch the following Column A to Column B

View SolutionMatch the following Column A to Column B

View SolutionThe inequation represented by the graph given below is :
View SolutionThe inequation that best describes the graph given below is _________
View SolutionThe inequation that best describes the following graph is _________
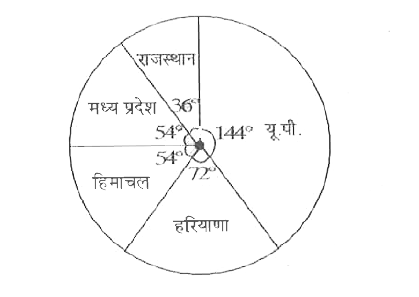
View Solutionचित्र में दिया गया वृत्त चार्ट मई -जून 2013 के दौरान वाहनों का केन्द्र्य सर्कार द्वारा चल्या गये अभियान में कटे हुए चलानो की संख्या को डिग्री (∘ ) में दर्शाता है। इसे ध्यानपूर्वक पढ़िए व निम्न प्रशनो के उत्तर दीजिए।
यदि कुल वाहनों 72 लाख है तो मध्य प्रदेश में कटे चालानों की संख्या राजस्थान के कटे चालानों की संख्या से कितना अधिक है ?

View SolutionStudy the given graph and answer the question that follows:

Breakup for distribution (degree wise) of the employees working in five departments (A,B,C,D, and E) in a company The number of employees in department B is what percent of the total number of employees working in department D and E?
दिए गए ग्राफ का अध्ययन करें और नीचे दिए गए प्रश्न का उत्त्तर दें। कंपनी के पांच विभागों (A, B, C, D और E) में काम कर रहे कर्मचारियों का वितरण
(डिग्री में) है। विभाग B में कर्मचारियों को संख्या, विभाग D और E में कार्य करने वाले कर्मचारियों की कुल संख्या की कितनी प्रतिशत है ?
View SolutionStudy the following pie chart and table to answer the question.Total number of students admitted in a university in various fields = 5000 Distribution of the number of students into various fields: The ratio of the number of boys in Economics to the number of students in Economics is: निम्नांकित पाई चार्ट का अध्ययन कीजिए और उसके बाद दिए गए प्रशन का उत्तर दीजिए। एक विश्वविद्यालय में विभिन्न संकायों में प्रवेश लेने वाले विद्यार्थियों की संख्या 5000 है। विभिन्न संकायों में विद्यार्थियों को संख्या का बंटनः इकोनॉमिक्स में लड़कों की संख्या का, इकोनॉमिक्स में कुल विद्यार्थियों की संख्या से क्या अनुपात हे?
View SolutionThe given pie-chart, shows the percentage distribution of the expenditure incurred in publishing a book. Study the pie-chart and the answer the question based on it. / दिया गया पाई चार्ट किसी पुस्तक के प्रकाशन में हुए व्ययों के प्रतिशत वितरण को दर्शाता है | इस पाई चार्ट का अध्ययन करें तथा इस पर आधारित प्रश्न का उत्तर दें | In the given pie-chart, by what percentage the Royalty on the book is less than the Printing cost? / दिए गए पाई चार्ट के अनुसार, इस पुस्तक पर रॉयल्टी प्रकाशन की लागत से कितना प्रतिशत कम है ?
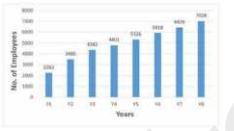
View SolutionThe Bar graph shown below presents the number of employees in an office during eight consecutive years.
नीचे दिया गया दंड आरेख किसी कार्यालय में आठ लगातार वर्षों के दौरान कर्मचारियों की संख्या को दर्शाता है |
The number of employees in year Y2 is how much percent less than the average number of employees per year?
वर्ष Y2 में कर्मचारियों की संख्या प्रति वर्ष कर्मचारियों की औसत संख्या से कितना प्रतिशत कम है ?
View SolutionThe given table represents the number of engineers recruited by four companies A,B,C and D over the years. Study the table carefully and answer the questions that follows: The ratio of the total number of engineers recruited by companies A and B in 2015 and 2018 to the total number of engineers recruited by C and D in 2014 and 2018 is: दी गयी तालिका चार कंपनियों A, B, C और D के द्वारा इन वर्षों के दौरान भर्ती किये गए इंजीनियरों की संख्या दर्शाती है | इस तालिका का ध्यानपूर्वक अध्ययन करें तथा इसके बाद पूछे गए प्रश्न का उत्तर दें | कंपनी A और B के द्वारा 2015 और 2018 में भर्ती किये गए इंजीनियरों की कुल संख्या एवं C तथा D के द्वारा 2014 और 2018 में भर्ती किये गए इंजीनियरों की कुल संख्या के बीच अनुपात ज्ञात करें |
View Solution
