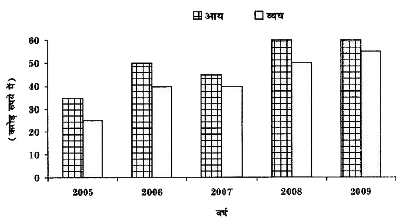
Study the following graph which shows income and expenditure of a company over the years and answer the questions.
Ratio of total income to total expenditure of the company over the years is.
निम्नलिखित चार्ट का अध्ययन कीजिए जिसमें कंपनी की कुछ वर्षों की आय एवं उसके व्यय को दर्शाया गया है और प्रश्नों के उत्तर दीजिए :
दिए गए वर्षों में कंपनी की कुल आय और कुल व्यय का अनुपात क्या रहा?

21:25
25:21
26:21
25:22
The correct Answer is:B
अभीष्ट अनुपात = 35+50+45+60+60:25+40+40+50+55
=250:210=25:21
Similar Questions
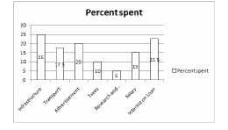
The given graph represents the percentage distribution of the total expenditure of a company. Study the graph and answer the question that follows.
दिया गया आरेख एक कंपनी के कुल व्यय के प्रतिशत वितरण को दर्शाता है। आरेख का अध्ययन कीजिए और फिर पूछे गए प्रश्न का उत्तर दीजिए। The total expenditure of the company is how many times the total expenditure on .Research
and Development. and .Salary.?
कंपनी का कुल व्यय .शोध तथा विकास (Reaserch and Development)’ और .वेतन.(Salary) पर किये गए कुल व्यय से कितना गुना है ?
View SolutionIn the given bar graph, the Blue bar shows the income and the Red bar shows the expenditure of a company. Study the graph and answer the question that follows
दिए गए दंड आरेख में, नीला दंड एक कंपनी की आय दिखाता है और लाल दंड खर्च (लाख रुपये में) को दर्शाता है। आरेख का अध्ययन करें और उस प्रश्न का उत्तर दें जो नीचे पूछा गया है। The income in 2001 was equal to the expenditure in the year:
2001 में आय किस वर्ष के व्यय के बराबर है :
View SolutionIn the given bar graph, the Blue bar shows the income and the Red bar shows the expenditure of a company. Study the graph and answer the question that follows
दिए गए दंड आरेख में, नीला दंड एक कंपनी की आय दिखाता है और लाल दंड खर्च (लाख रुपये में) को दर्शाता है। आरेख का अध्ययन करें और उस प्रश्न का उत्तर दें जो नीचे पूछा गया है। The percentage decrease in the income of the company in 2002 as compared to that in 2001 is:
2001 की तुलना में 2002 में कंपनी की आय में कितने प्रतिशत में कमी आई है:
View SolutionThe given Bar Graph presents Income and Expenditure (in crores of Rupees) of a company for five years, 2014 to 2018. The average Income (per year) of the company in five years is what percentage more than its Expenditure in 2015? दिया गया दंड आरेख॑ (बार ग्राफ) 5 वर्षों, 2014 से 2018 के दौरान किसी कंपनी की आय और व्यय (करोड़ रुपए में) को दर्शाता है| 5 वर्षों में कंपनी की (प्रतिवर्ष) औसत आय 2015 में उसके व्यय से कितने प्रतिशत अधिक है?
View SolutionThe given Bar Graph presents Income and Expenditure (in crores of Rupees) of a company for five years, 2014 to 2018. The total Income of the company in 2015, 2017 and 2018 is approximately what percent less than the total Expenditure in the five years? दिया गया दंड आरेख (बार ग्राफ) 5 वर्षो, 2014 से 2018 के दौरान किसी कंपनी की आय और व्यय (करोड़ रुपए में) को दर्शाता है 2015, 201 और 2018 में कंपनी की कुल आय, 5 वर्षो में कुल व्यय से लगभग कितने प्रतिशत कम है?
View SolutionThe given Bar Graph presents Income and Expenditure (in crores of Rupees) of a company for five years, 2014 to 2018. In which year is the Expenditure more than 40% as compared to the Expenditure in the previous year? दिया गया दंड आरेख (बार ग्राफ) 5 वर्षो, 2014 से 2018 के दौरान किसी कंपनी की आय और व्यय (करोड़ रुपए में) को दर्शाता है| पिछले वर्ष के व्यय की तुलना में किस वर्ष में वह 40% अधिक है?
View SolutionThe given Bar Graph presents Income and Expenditure (in crores of Rupees) of a company for five years, 2014 to 2018. What is the ratio of total Expenditure to total Income of the company in 2014,2016 and 2017? दिया गया दंड आरेख (बार ग्राफ) 5 वर्षों, 2014 से 2018 के दौरान किसी कंपनी की आय और व्यय (करोड़ रुपए में) को दर्शाता है| 2014, 2016 और 2017 में कंपनी के कुल व्यय और कुल आय का अनुपात क्या है?
View SolutionStudy the following graph which shows income and expenditure of a company over the years and answer the questions. The difference in profit (in crores) of the company during 2007 and 2008 is. निम्नलिखित चार्ट का अध्ययन कीजिए जिसमें कंपनी की कुछ वर्षों की आय एवं उसके व्यय को दर्शाया गया है और प्रश्नों के उत्तर दीजिए : वर्ष 2007 और 2008 में कंपनी के लाभ में अंतर (₹ करोड़ में) कितना है?
View Solution
