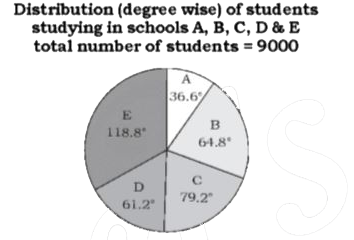
निम्न पाई-चार्ट का अध्ययन करे और उसके बाद दिए गए प्रश्न का उत्तर दे।

विद्यालय D और E में विद्यार्थियों की कुल संख्या, विद्यालय B और C के विद्यार्थियों की कुल संख्या से कितने प्रतिशत अधिक है ?
20
30
25
35
The correct Answer is:C
Step by step video, text & image solution for निम्न पाई-चार्ट का अध्ययन करे और उसके बाद दिए गए प्रश्न का उत्तर दे। विद्यालय D और E में विद्यार्थियों की कुल संख्या, विद्यालय B और C के विद्यार्थियों की कुल संख्या से कितने प्रतिशत अधिक है ? by Maths experts to help you in doubts & scoring excellent marks in Class 14 exams.
Updated on:21/07/2023Topper's Solved these Questions
Similar Questions
यदि A:B=2:3 और B:C=3:7, तो A+B:B+C:C+A क्या होगा?
View SolutionP और Q की वर्तमान आयु के बीच का क्रमशः अनुपात 3 : 4 है। चार वर्ष बाद Q, P से पाँच वर्ष बड़ा होगा।P की वर्तमान आयु कितनी है?
View SolutionMatch the following Column A to Column B

View SolutionStudy the following bar graph and answer the questions given below. . The number of boys in school B is what percentage of the number of students in that school? निम्नांकित बार ग्राफ का अध्ययन कीजिए और उसके बाव दिए गए प्रश्न का उत्तर दीजिए। . स्कूल B में लड़कों की संख्या, उस स्कूल में विद्यार्थियों की कुल संख्या की कितने प्रतिशत है?
View SolutionStudy the following pie chart and table to answer the question.Total number of students admitted in a university in various fields = 5000 Distribution of the number of students into various fields: The ratio of the number of boys in Economics to the number of students in Economics is: निम्नांकित पाई चार्ट का अध्ययन कीजिए और उसके बाद दिए गए प्रशन का उत्तर दीजिए। एक विश्वविद्यालय में विभिन्न संकायों में प्रवेश लेने वाले विद्यार्थियों की संख्या 5000 है। विभिन्न संकायों में विद्यार्थियों को संख्या का बंटनः इकोनॉमिक्स में लड़कों की संख्या का, इकोनॉमिक्स में कुल विद्यार्थियों की संख्या से क्या अनुपात हे?
View SolutionStudy the following pie chart and table to answer the question.Total number of students admitted in a university in various fields = 5000 Distribution of the number of students into various fields: What is the average number of boys in CS, ECE and EEE fields? निम्नांकित पाई चार्ट का अध्ययन कीजिए और उसके बाद दिए गए प्रशन का उत्तर दीजिए। एक विश्वविद्यालय में विभिन्न संकायों में प्रवेश लेने वाले विद्यार्थियों की संख्या 5000 है। विभिन्न संकायों में विद्यार्थियों को संख्या का बंटनः CS, ECE और EEE संकायों में लड़कों की औसत संख्या कितनी है?
View SolutionStudy the following bar graph and answer the questions given below. निम्नांकित बार ग्राफ का अध्ययन कीजिए और उसके बाद गए प्रश्न का उत्तर दीजिए। Difference between the number of boys and girls in school A, B, C, D and E. स्कूल A, B, C, D और E में लड़कों और लड़कियों की संख्या के बीच अंतर। What is the ratio of number of boys to the number of girls in school E? स्कूल E में लड़कों की संख्या से अनुपात कितना है?
View SolutionStudy the following bar graph and answer the questions given below. निम्नांकित बार ग्राफ का अध्ययन कीजिए और उसके बाद दिए गए प्रशन का उत्तर दीजिए। Total number of boys and girls in schools A, B, C, D and E. स्कूलों A, B, C, D और E में लड़कों और लड़कियों की कुल संख्या। What is the difference between the number of girls in school A and the number of girls in school C? स्कूल A में लड़कियों कीं संख्या और स्कूल C में लड़कों की संख्या में कितना अंतर है?
View SolutionIn a school 4/9 of the number of students are girls and the rest are boys 3/5 of the number of boys are below 12 years of age and 5/12 of the number of girls are 12 years or above 12 years of age. If the number of students below 12 years of age is 480, then 5/18 of the total number of students in the school will be equal to: एक विद्यालय में, छात्रो कौ कुल संख्या का 4/9 लडकियाँ और बाकी लडके है। लडको की कुल संख्या का 3/5 , 12 साल से कम है, और लडकियो की संख्या का 5/12 ,12 साल या उससे अधिक है। यदि 12 साल, से कम आयु के छात्रो की संख्या 480 है, तो स्कूल में छात्रो की कुल संख्या का 5/18 निम्न में से किसके बराबर है?
View Solutionविद्यार्थियों की एक पंक्ति में , सोहन का स्थान दोनों मे से किसी भी किनारे से 9 वाँ है तब विद्यार्थियों की कुल संख्या होगी ?
View SolutionTwo numbers A and B are, respectively, 80% and 20% more than a third number C. The ratio of the numbers A to B is:
दो संख्या A और B क्रमशः, 80% और 20% अधिक है एक तीसरी संख्या C से । A से B की संख्या का अनुपात है
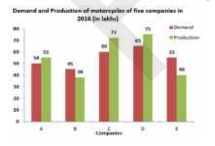
View SolutionStudy the following bar graph and answer the question given.
निम्नलिखित दंड आरेख का अध्ययन करें तथा दिए गए प्रश्न का उत्तर दें | The ratio of the total demand of motorcycles of companies A, C and E to the total production of
motorcycles of B and C is:
कंपनी A, C और E की मोटरसाइकिल की कुल मांग और B तथा C की मोटरसाइकिल के कुल उत्पादन के बीच अनुपात ज्ञात करें
View SolutionThe Table shows the number of students from different schools playing different games. यह तालिका अलग-अलग विद्यालयों के छात्रों की संख्या को दर्शाती है जो अलग-अलग खेल खेलते हैं ? What is the ratio of the total students who play cricket in schools A and B together to the total students who play hockey in schools C and D ? विद्यालय A और B में क्रिकेट खेलने वाले छात्रों की कुल संख्या का विद्यालय C और D में हॉकी खेलने वाले छात्रों की कुल संख्या के साथ क्या अनुपात है ?
View SolutionThe given table represents the number of engineers recruited by four companies A,B,C and D over the years. Study the table carefully and answer the questions that follows: The ratio of the total number of engineers recruited by companies A and B in 2015 and 2018 to the total number of engineers recruited by C and D in 2014 and 2018 is: दी गयी तालिका चार कंपनियों A, B, C और D के द्वारा इन वर्षों के दौरान भर्ती किये गए इंजीनियरों की संख्या दर्शाती है | इस तालिका का ध्यानपूर्वक अध्ययन करें तथा इसके बाद पूछे गए प्रश्न का उत्तर दें | कंपनी A और B के द्वारा 2015 और 2018 में भर्ती किये गए इंजीनियरों की कुल संख्या एवं C तथा D के द्वारा 2014 और 2018 में भर्ती किये गए इंजीनियरों की कुल संख्या के बीच अनुपात ज्ञात करें |
View SolutionThe given table represents the number of engineers recruited by four companies A,B,C and D over the years. Study the table carefully and answer the questions that follows:The total number of engineers recruited by company A in 2014 to 2017 is what percentage more than the total number of engineers recruited by all the four companies in 2019? दी गयी तालिका चार कंपनियों A, B, C और D के द्वारा इन वर्षों के दौरान भर्ती किये गए इंजीनियरों की संख्या दर्शाती है | इस तालिका का ध्यानपूर्वक अध्ययन करें तथा इसके बाद पूछे गए प्रश्न का उत्तर दें | कंपनी A के द्वारा 2014 से 2017 की अवधि में भर्ती किये गए इंजीनियरों की कुल संख्या सभी चार कंपनियों के द्वारा 2019 में भर्ती किये गए इंजीनियरों की कुल संख्या से कितना प्रतिशत अधिक है ?
View SolutionThe given table represents the number of engineers recruited by four companies A,B,C and D over the years. Study the table carefully and answer the questions that follows: The total number of engineers recruited by the company B in 2014 and 2017 is what percentage of the total number of engineers recruited by C during 2015 to 2019? दी गयी तालिका चार कंपनियों A, B, C और D के द्वारा इन वर्षों के दौरान भर्ती किये गए इंजीनियरों की संख्या दर्शाती है | इस तालिका का ध्यानपूर्वक अध्ययन करें तथा इसके बाद पूछे गए प्रश्न का उत्तर दें | कंपनी B के द्वारा 2014 और 2017 में भर्ती किये गए इंजीनियरों की कुल संख्या C के द्वारा 2015 से 2019 के दौरान भर्ती किये गए इंजीनियरों की कुल संख्या का कितना प्रतिशत है ?
View Solution
