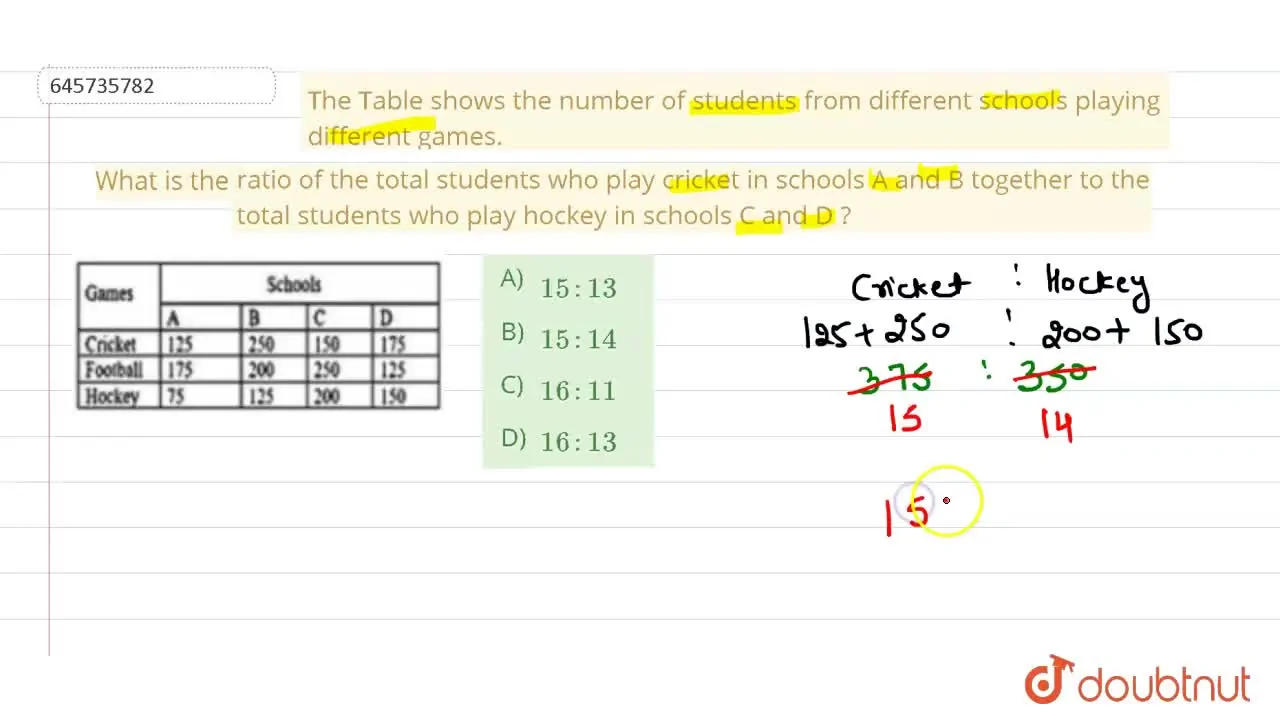
The Table shows the number of students from different schools playing different games.
यह तालिका अलग-अलग विद्यालयों के छात्रों की संख्या को दर्शाती है जो अलग-अलग खेल खेलते हैं ?
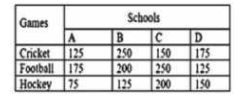 What is the ratio of the total students who play cricket in schools A and B together to the total students who play hockey in schools C and D ?
विद्यालय A और B में क्रिकेट खेलने वाले छात्रों की कुल संख्या का विद्यालय C और D में हॉकी खेलने वाले छात्रों की कुल संख्या के साथ क्या अनुपात है ?
15:13
15:14
16:11
16:13
Step by step video & image solution for The Table shows the number of students from different schools playing different games. यह तालिका अलग-अलग विद्यालयों के छात्रों की संख्या को दर्शाती है जो अलग-अलग खेल खेलते हैं ? What is the ratio of the total students who play cricket in schools A and B together to the total students who play hockey in schools C and D ? विद्यालय A और B में क्रिकेट खेलने वाले छात्रों की कुल संख्या का विद्यालय C और D में हॉकी खेलने वाले छात्रों की कुल संख्या के साथ क्या अनुपात है ? by Maths experts to help you in doubts & scoring excellent marks in Class 14 exams.
Related Playlists
Similar Questions
The Table shows the number of students from different schools playing different games.
यह तालिका अलग-अलग विद्यालयों के छात्रों की संख्या को दर्शाती है जो अलग-अलग खेल खेलते हैं ?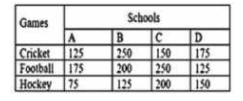 The number of students who play football in school A is approximately what percent of the football playing students from all schools?
विद्यालय A में फुटबॉल खेलने वाले छात्रों की संख्या सभी विद्यालयों में फुटबॉल खेलने वाले छात्रों की संख्या का लगभग कितना प्रतिशत है ?View SolutionThe Table shows the number of students from different schools playing different games.
यह तालिका अलग-अलग विद्यालयों के छात्रों की संख्या को दर्शाती है जो अलग-अलग खेल खेलते हैं ?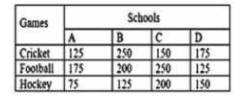 What is the average of the number of students who play cricket in all four schools?
सभी चार विद्यालयों में क्रिकेट खेलने है छात्रों की औसत संख्या कितनीView SolutionThe Table shows the number of students from different schools playing different games.
यह तालिका अलग-अलग विद्यालयों के छात्रों की संख्या को दर्शाती है जो अलग-अलग खेल खेलते हैं ?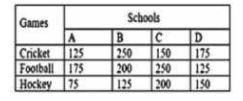 If the data about the number of students who play hockey from different schools is represented by a pie-chart, what is the central angle of the sector representing students who play hockey from school C to the nearest whole number?
यदि अलग-अलग विद्यालयों में हॉकी खेलने वाले छात्रों से संबंधित आंकड़ों को एक पाई-चार्ट में प्रस्तुत किया जाए, तो विद्यालय C में हॉकी खेलने वाले छात्रों को दर्शने वाले खंड का केंद्रीय कोण ( निकटतम पूर्ण संख्या में ) क्या होगा ?View SolutionWhy students should play games in school ?
View SolutionThe table given below shows the number of students having obtained different marks
नीचे दी गयी तालिका अलग-अलग अंक प्राप्त करने वाले छात्रों की संख्या को दर्शाती है |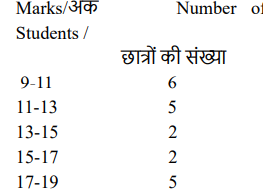
What is the mean marks per student ?
प्रति छात्र माध्य अंक कितना है ?View SolutionThe table shows the number of students from different schools playing different games. Study the table carefully and answer the questions.
Games Schools A B C DCricket 125 250 150 175Football 175 200 250 125Hockey 75 125 200 150
What is the ratio of the total students who play cricket in schools A and B together to the total students who play hockey in schools D and B together ?View SolutionThe given bar graph presents the number of students from Science and Arts streams from a school in different years.
दिया गया दंड आरेख अलग-अलग वर्षों में एक विद्यालय में विज्ञान एवं कला संकाय के छात्रों की संख्या को दर्शाता है |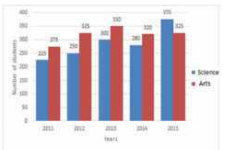 What is the ratio of the total number of Science students in 2011 and 2015 to that of Arts in 2012 and 2015?
2011 तथा 2015 में विज्ञान के छात्रों की कुल संख्या का 2012 तथा 2015 में कला के छात्रों की कुल संख्या के साथ अनुपात ज्ञात करें |View SolutionThe given Bar Graph presents the number of students of two schools for six years.
दिया गया दंड आरेख छः वर्ष की अवधि में दो विद्यालयों में छात्रों की संख्या को दर्शाता है |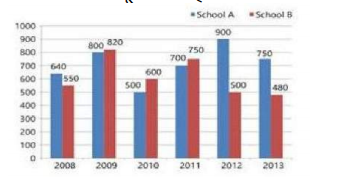
What is the ratio of the number of students taken for all years together from school A to that from school B?
सभी वर्षों को मिलाकर विद्यालय A और विद्यालय B के छात्रों की संख्या में अनुपात ज्ञात करें |View SolutionThe given Bar Graph presents the number of students of two schools for six years.
दिया गया दंड आरेख छः वर्ष की अवधि में दो विद्यालयों में छात्रों की संख्या को दर्शाता है | What is the average (correct to two decimal places) of total students in schools A and B taken
together during the six year period?
विद्यालय A और B को मिलाकर छः वर्ष की अवधि के दौरान कुल छात्रों का औसत ( दो दशमलव स्थान तक ) क्या है?View SolutionThe given Bar Graph presents the number of students of two schools for six years.
दिया गया दंड आरेख छः वर्ष की अवधि में दो विद्यालयों में छात्रों की संख्या को दर्शाता है |
What is the ratio of the number of students taken together for the years 2008, 2012 and 2013 in School A to the number of students taken together for the years 2008, 2012 and 2013 in school B?
विद्यालय A में 2008, 2012 तथा 2013 को मिलाकर छात्रों की संख्या का विद्यालय B में 2008, 2012 तथा 2013 को मिलाकर होने वाले छात्रों की संख्या के साथ अनुपात ज्ञात करें |View Solution

