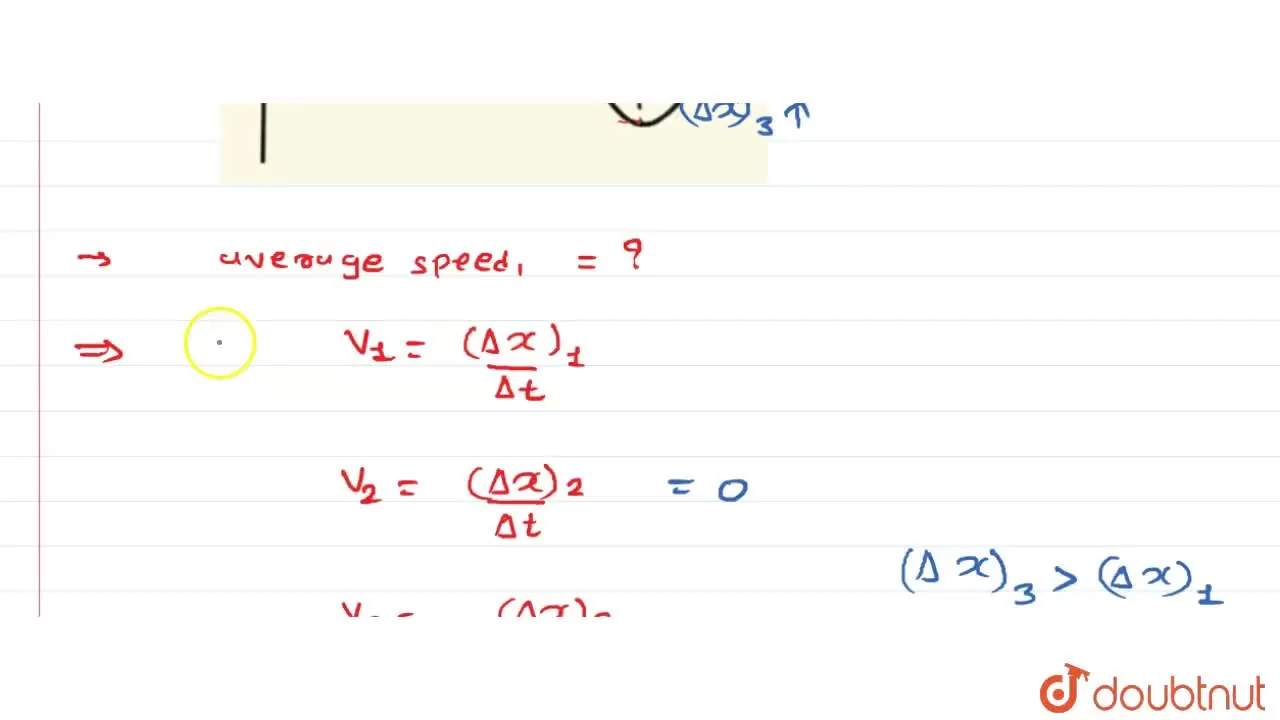
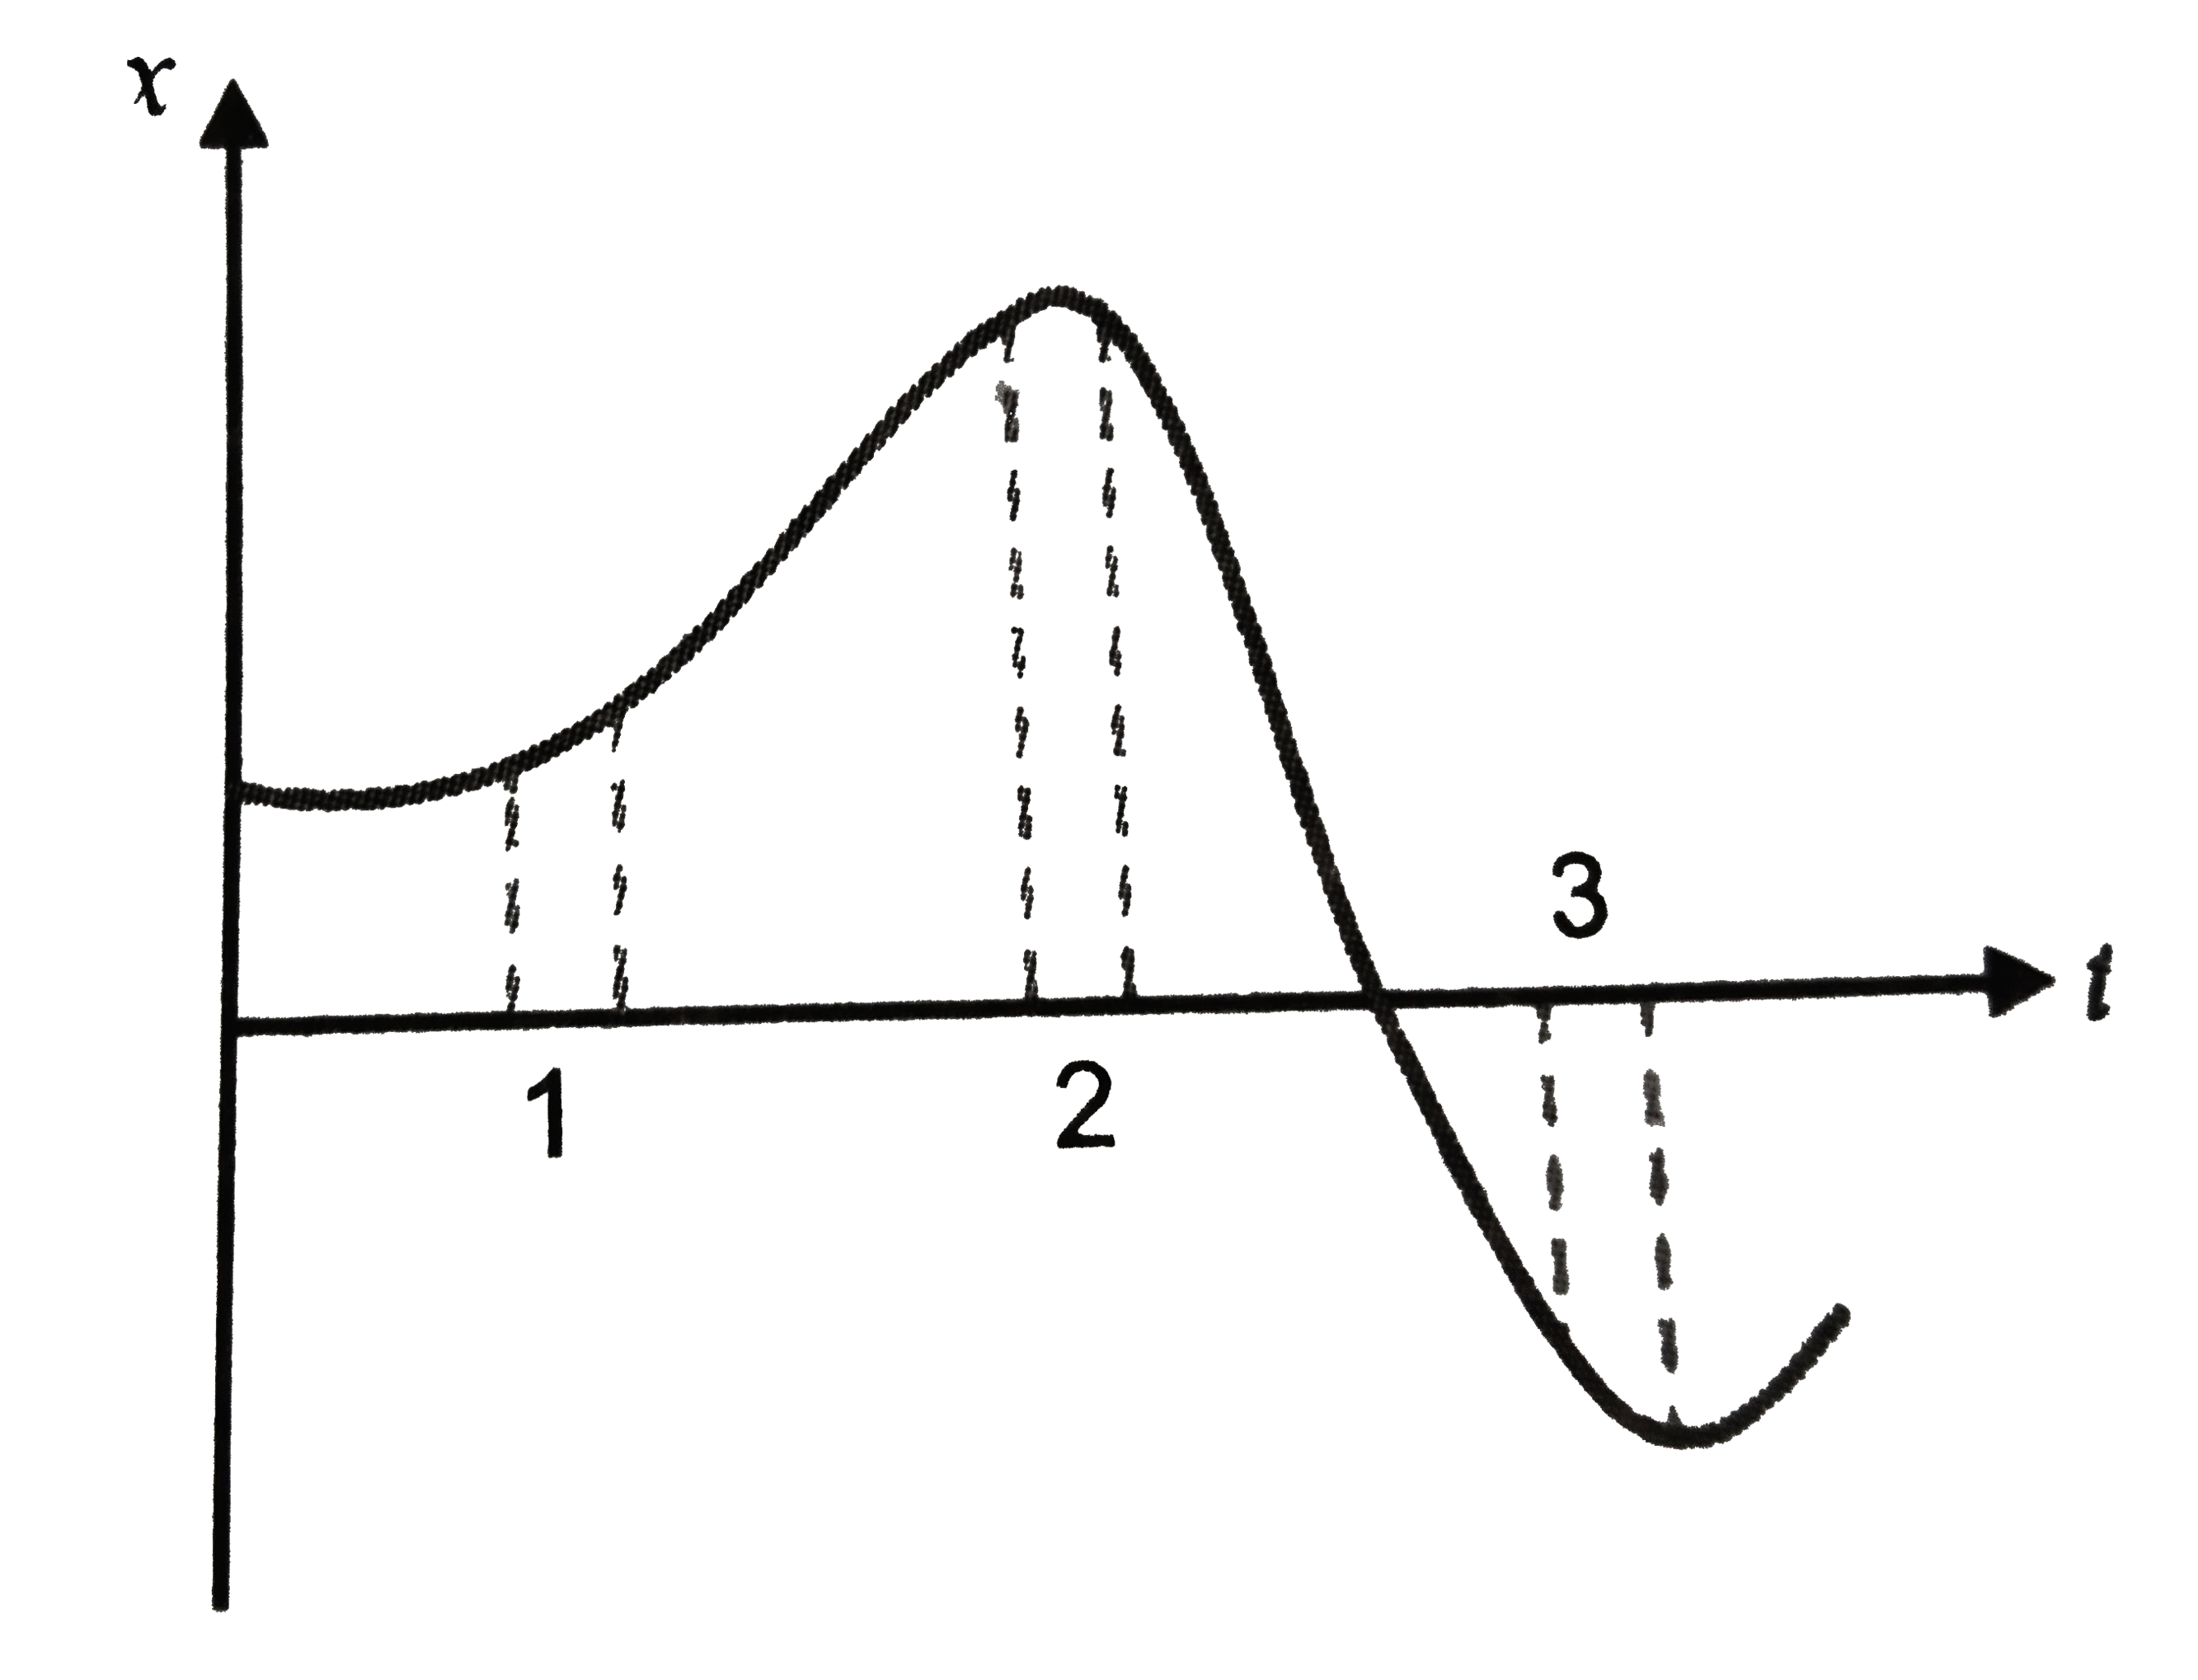
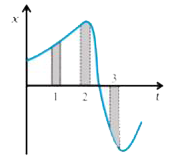
Fig. 2 (NCT).9 show the x−t plot of a particle in one dimensional motion. Three different equal intervals of time are shown. In which interval the average speed is greatest and in which it is the least ? Give th sign of average speed for each interval.
 .Solution in Gujrati
The correct Answer is:3
By observation, for equal interval of time the magnitude of slope of line in x-t curve is greatest in interval 3.
Related Playlists
- BOOK - ALLEN CHAPTER - KINEMATICSEXERCISE - Exercise-04[B]14videos
KINEMATICS
- BOOK - ALLEN CHAPTER - KINEMATICSEXERCISE - Exercise-05 [A]11videos
KINEMATICS
- BOOK - ALLEN CHAPTER - KINEMATICSEXERCISE - Comprehension#73videos
KINEMATICS
- BOOK - ALLEN CHAPTER - ERROR AND MEASUREMENTEXERCISE - Part-2(Exercise-2)(B)22videos
ERROR AND MEASUREMENT
- BOOK - ALLEN CHAPTER - KINEMATICS (MOTION ALONG A STRAIGHT LINE AND MOTION IN A PLANE)EXERCISE - BEGINNER S BOX-78videos
KINEMATICS (MOTION ALONG A STRAIGHT LINE AND MOTION IN A PLANE)
Similar Questions
Two towns A and B are connected by a regular bus service with a bus leaving in either direction every T minutes. A man cycling with a speed of 20kmh−1 in the direction A to B notices that a bus goes past him every 18 min in the direction of his motion, and every 6 min in the opposite direction. What is the period T of the bus service and with what speed (assumed constant) do the buses ply on the road ?
02:32View SolutionA ball whose kinetic energy is E , is projected at an angle of 45∘ to the horizontal . The kinetic energy of the ball at the highest point of its flight will be
05:52View SolutionA projectile is projected with some initial velocity and some initial angle of projection. A wind is also blowing, due to which constant horizontal retardation a is imparted to the particle in the plane of motion. It is found that, the particle is at same height at two different time t1 & t2 and particle is at same horizontal distance at two different time t3 & t4
Angle of projection of particle is :-02:24View SolutionA cube has a side of length 1.2×10⁻²m. Calculate its volume.
02:39View SolutionA football player kicks a ball at an angle of 30∘ with an initial speed of 20 m/s. Assuming that the ball travels in a vertical plane, calculate (a) the time at which the ball reaches the highest point (b) the maximum height reached (c) the horizontal range of the ball (d) the time for which the ball is in the air, (g=10m/s2)
04:11View SolutionFig. 2 (NCT).9 show the x-t plot of a particle in one dimensional motion. Three different equal intervals of time are shown. In which interval the average speed is greatest and in which it is the least ? Give the sign of average speed for each interval. .
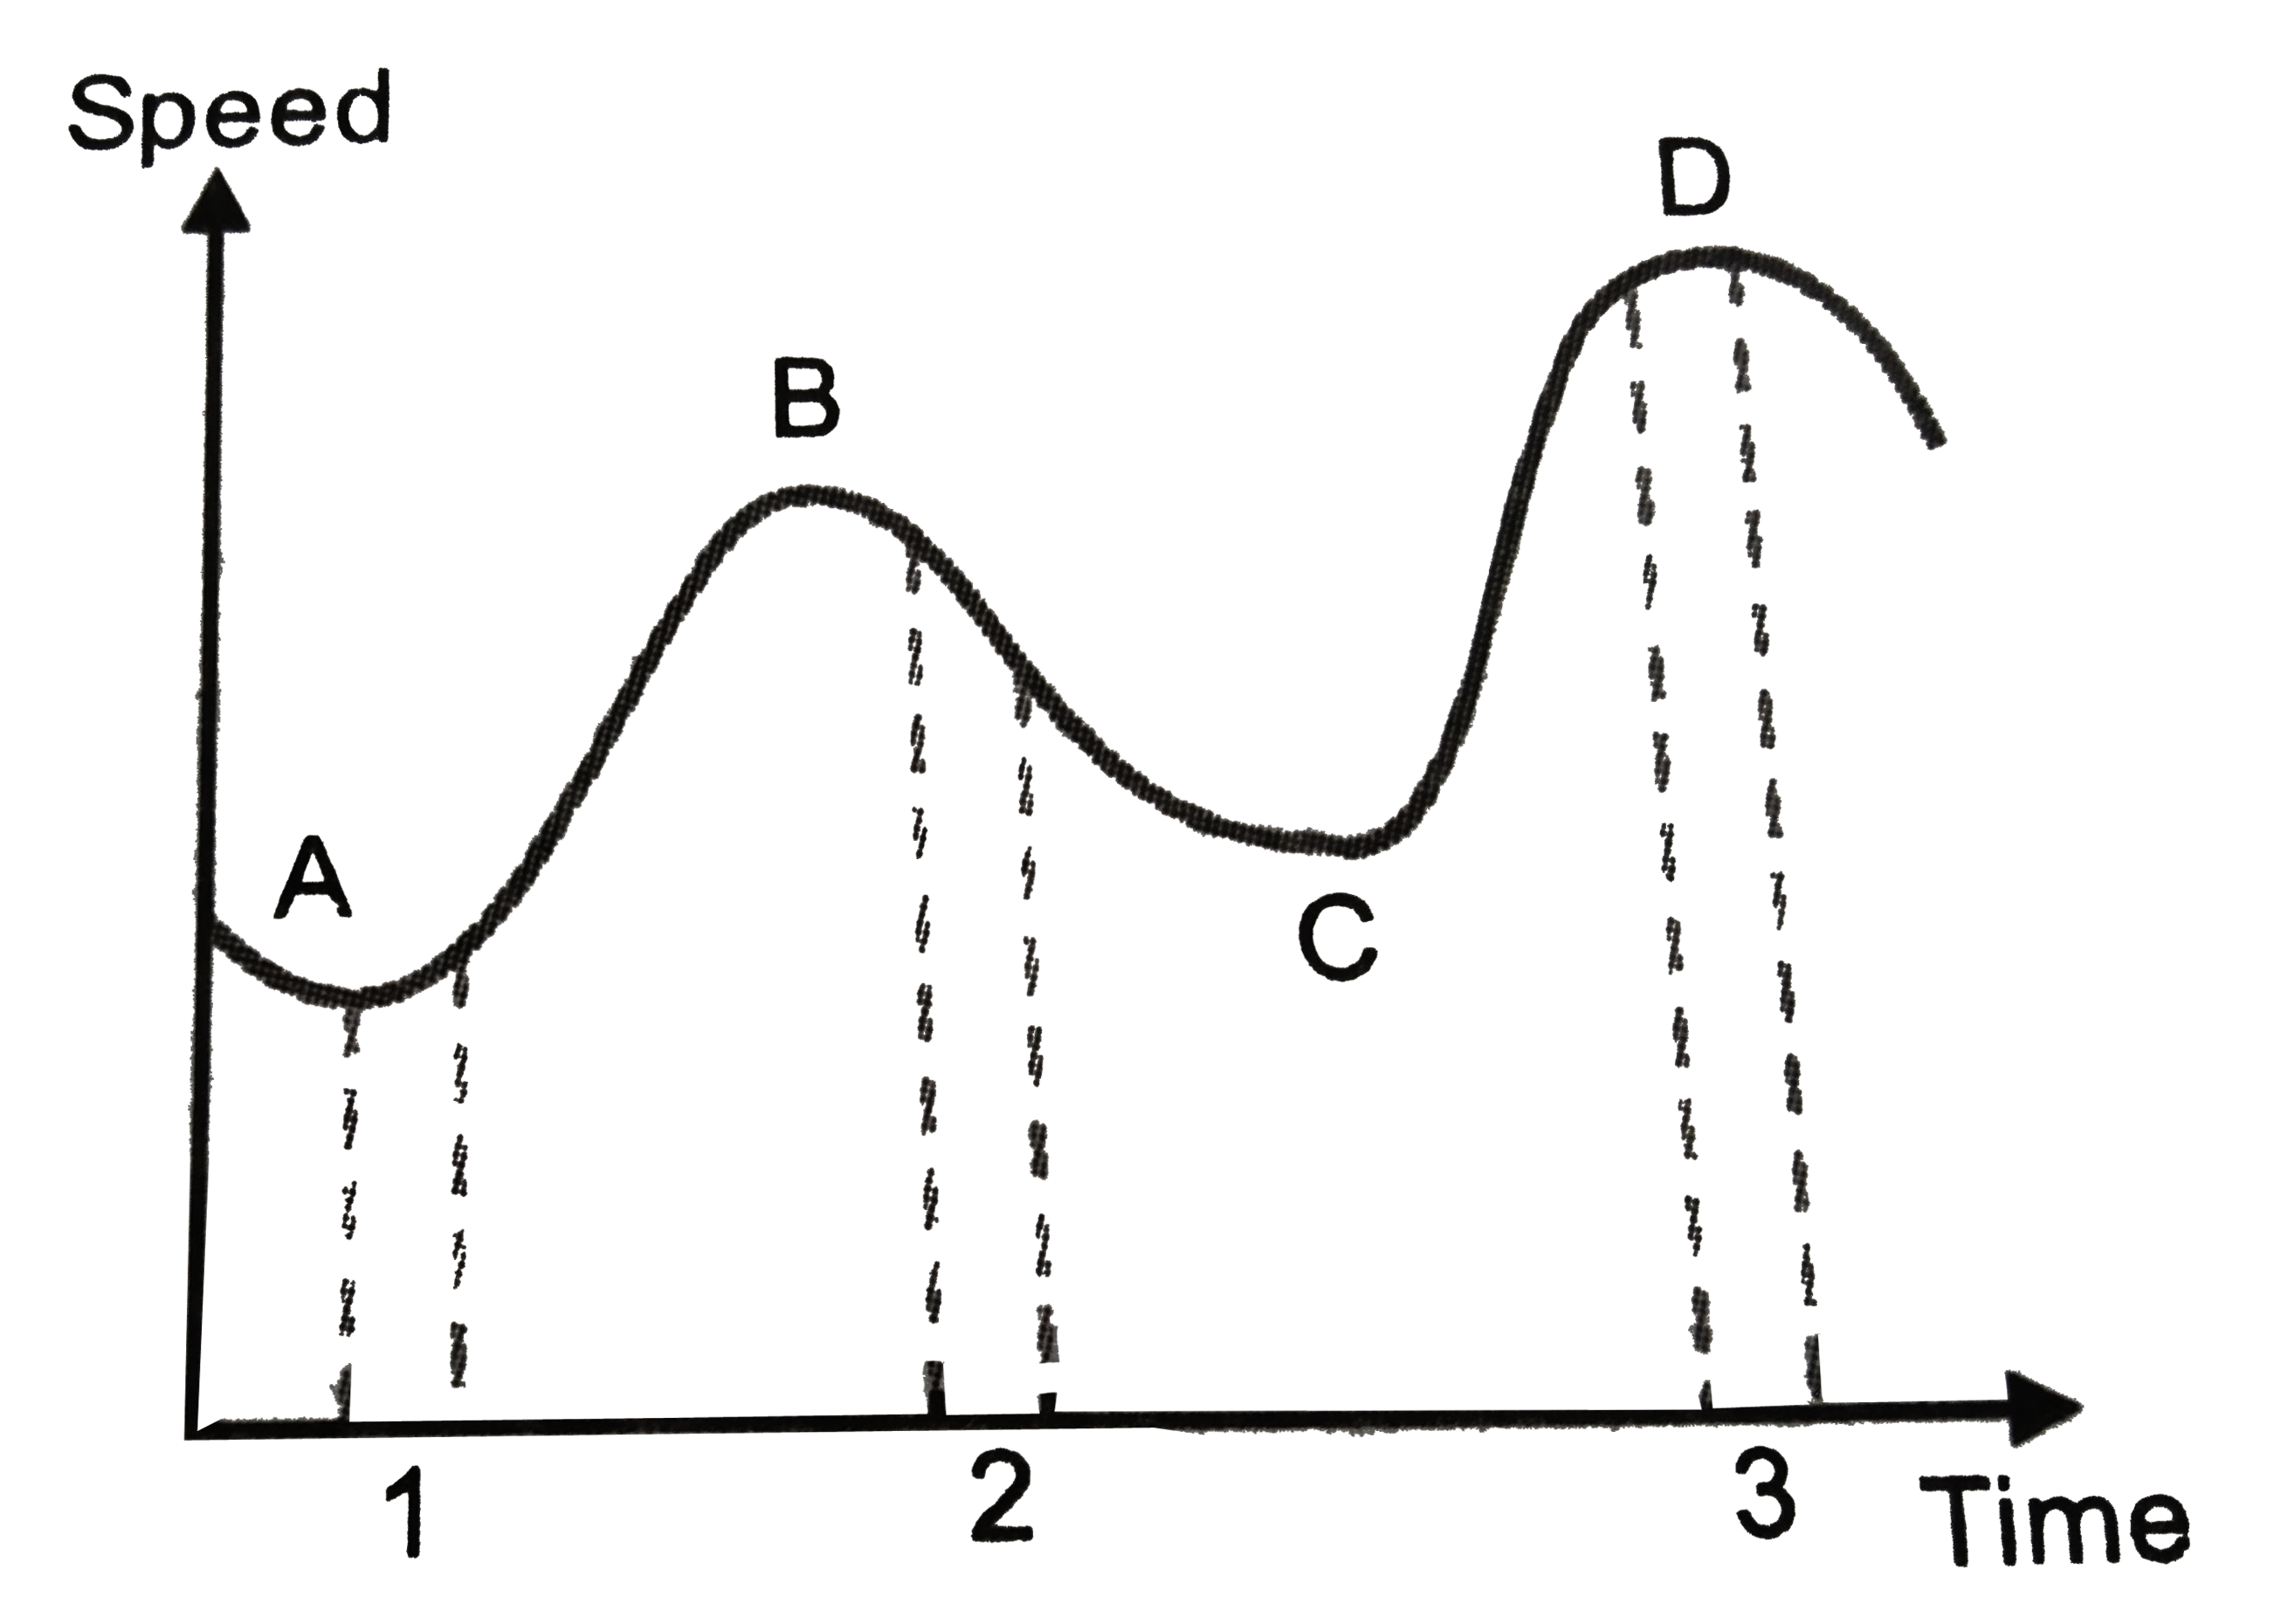
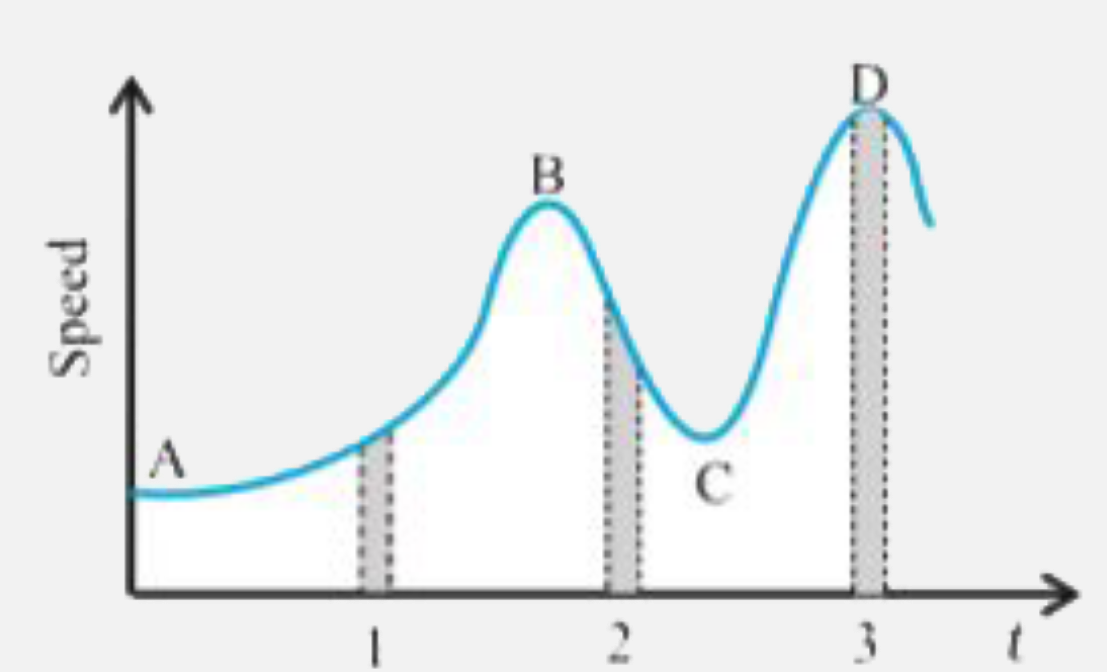
View SolutionFig. 2 (NCT). 10 . Give a speed-tiem graph of a particle in one dimenstional motion. Three different equal intervals of time are shwon. In which interval is the average acceleration graeatest in magnitude ? In which interval is the average speed greatest ? Choosing the positive direction as the constant direction of motion, give the signs of u and a in the three intervals. What are the acclerations at teh points A,B,C and D ?
 .View Solution
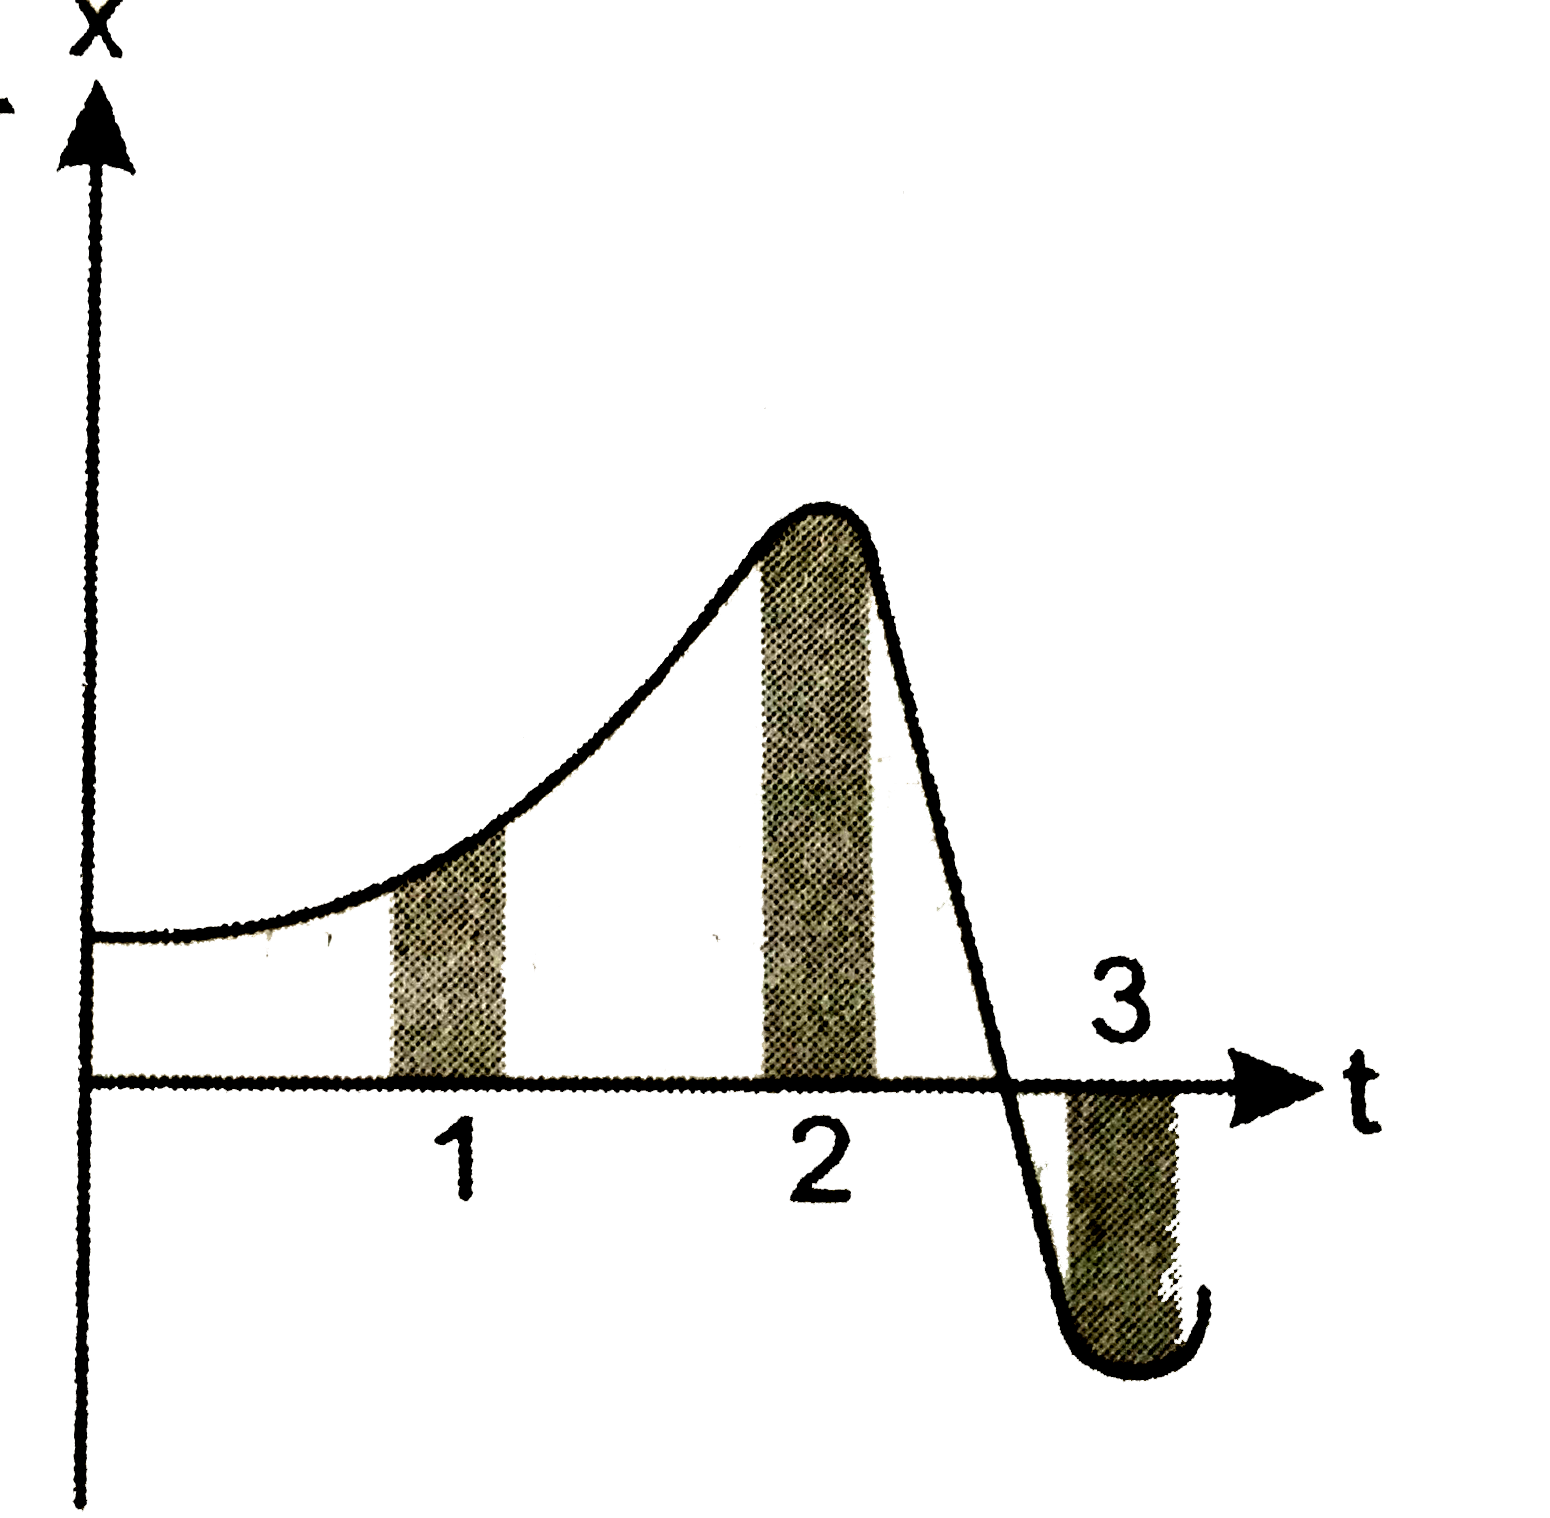
चित्र किसी कण की एकविमीय गति का x−t ग्राफ दर्शाता है। इसमें तीन समान अन्तराल दिखाये गये है। किस अन्तराल में औसत चाल अधिकतम है और किसमें न्यूनतम है? प्रत्येक अन्तराल के लिए औसत वेग का चिन्ह बताइए।
 03:22View Solution
Figure. gives the x-t plot of a particle in one-dimensional motion. Three different equal intervals of time are shown. In which interval is the average speed greatest, and in which is it the least ? Give the sign of average velocity for each interval.
06:19View SolutionFigure. gives a speed-time graph of a particle in motion along a constant direction. Three equal intervals of time are shown. In which interval is the average acceleration greatest in magnitude ? In which interval is the average speed greatest ? Choosing the positive direction as the constant direction of motion, give the signs of v and a in the three intervals. What are the accelerations at the points A, B, C and D ?
03:28View SolutionFigure. gives the x-t plot of a particle in one-dimensional motion. Three different equal intervals of time are shown. In which interval is the average speed greatest, and in which is it the least ? Give the sign of average velocity for each interval.
 07:09View Solution
Figure. gives a speed-time graph of a particle in motion along a constant direction. Three equal intervals of time are shown. In which interval is the average acceleration greatest in magnitude ? In which interval is the average speed greatest ? Choosing the positive direction as the constant direction of motion, give the signs of v and a in the three intervals. What are the accelerations at the points A, B, C and D ?
01:37View SolutionFigure. gives the x-t plot of a particle in one-dimensional motion. Three different equal intervals of time are shown. In which interval is the average speed greatest, and in which is it the least ? Give the sign of average velocity for each interval.
05:58View SolutionFigure. gives a speed-time graph of a particle in motion along a constant direction. Three equal intervals of time are shown. In which interval is the average acceleration greatest in magnitude ? In which interval is the average speed greatest ? Choosing the positive direction as the constant direction of motion, give the signs of v and a in the three intervals. What are the accelerations at the points A, B, C and D ?
 03:28View Solution
Fig. show the x-t plot of a particle in one dimensional motion. Three different equal intervals of time are shown. In which interval the average speed is greatest and in which it is the least? Give the sign of average speed for each interval. .
02:33View SolutionGiven a speed-time graph of a particle in motion along a constant direction. Three equal intervals of time are shown. In which interval is the average acceleration greatest in magnitude? In which interval is the average speed greatest? Choosing the positive direction as the constant direction of motion, give the signs of v and a in the three intervals. What are the accelerations at the points A, B , C and D ? .
View Solution

