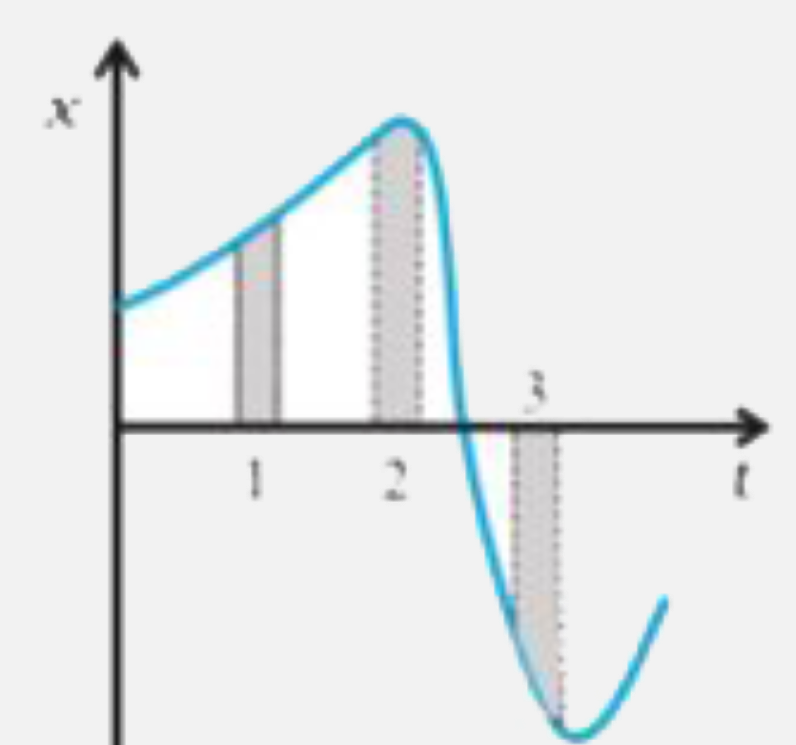
Figure. gives the x-t plot of a particle in one-dimensional motion. Three different equal intervals of time are shown. In which interval is the average speed greatest, and in which is it the least ? Give the sign of average velocity for each interval.
 Solution in Tamil
Greatest in 3, least in 2, υ>0 in 1 and 2, υ<0 in 3.
Topper's Solved these Questions
- MOTION IN A STRAIGHT LINEBOOK - NCERT TAMILCHAPTER - MOTION IN A STRAIGHT LINEEXERCISE - ADDITIONAL EXERCISES
5 Videos
- MOTION IN A STRAIGHT LINEBOOK - NCERT TAMILCHAPTER - MOTION IN A STRAIGHT LINEEXERCISE - ADDITIONAL EXERCISES
5 Videos
- MOTION IN A PLANEBOOK - NCERT TAMILCHAPTER - MOTION IN A PLANEEXERCISE - EXCERCISES
32 Videos
- MOTION OF SYSTEM OF PARTICLES AND RIGID BODIES BOOK - NCERT TAMILCHAPTER - MOTION OF SYSTEM OF PARTICLES AND RIGID BODIES EXERCISE - EXERCISE (V. NUMERICAL PROBLEMS)
6 Videos
Similar Questions
A boy standing on a stationary lift ( open from above ) throws a ball upwards with the maximum initial speed he can, equal to 49ms−1. How much time does the ball take to return to his hands ? If the lift starts moving up with a uniform speed of 5ms−1 and the boy again throws the ball up with the maximum speed he can , how hoes the ball take to return to his hands ?
View SolutionA boy standing on a stationary lift ( open from above ) throws a ball upwards with the maximum initial speed he can, equal to 49ms−1. How much time does the ball take to return to his hands ? If the lift starts moving up with a uniform speed of 5ms−1 and the boy again throws the ball up with the maximum speed he can , how hoes the ball take to return to his hands ?
View SolutionState, for each of the following physical quantities, if it is a scalar or a vector. Volume, mass speed acceleration, density, number of moles, velocity, angular frequency, displacement, angular velocity.
View SolutionA uniform disc of mass 100g has a diameter of 10 cm. Calculate the total energy of the disc when rolling along a horizontal table with a velocity of 20cms−1. (take the surface of table as reference)
View SolutionFig. 2 (NCT).9 show the x-t plot of a particle in one dimensional motion. Three different equal intervals of time are shown. In which interval the average speed is greatest and in which it is the least ? Give the sign of average speed for each interval. .
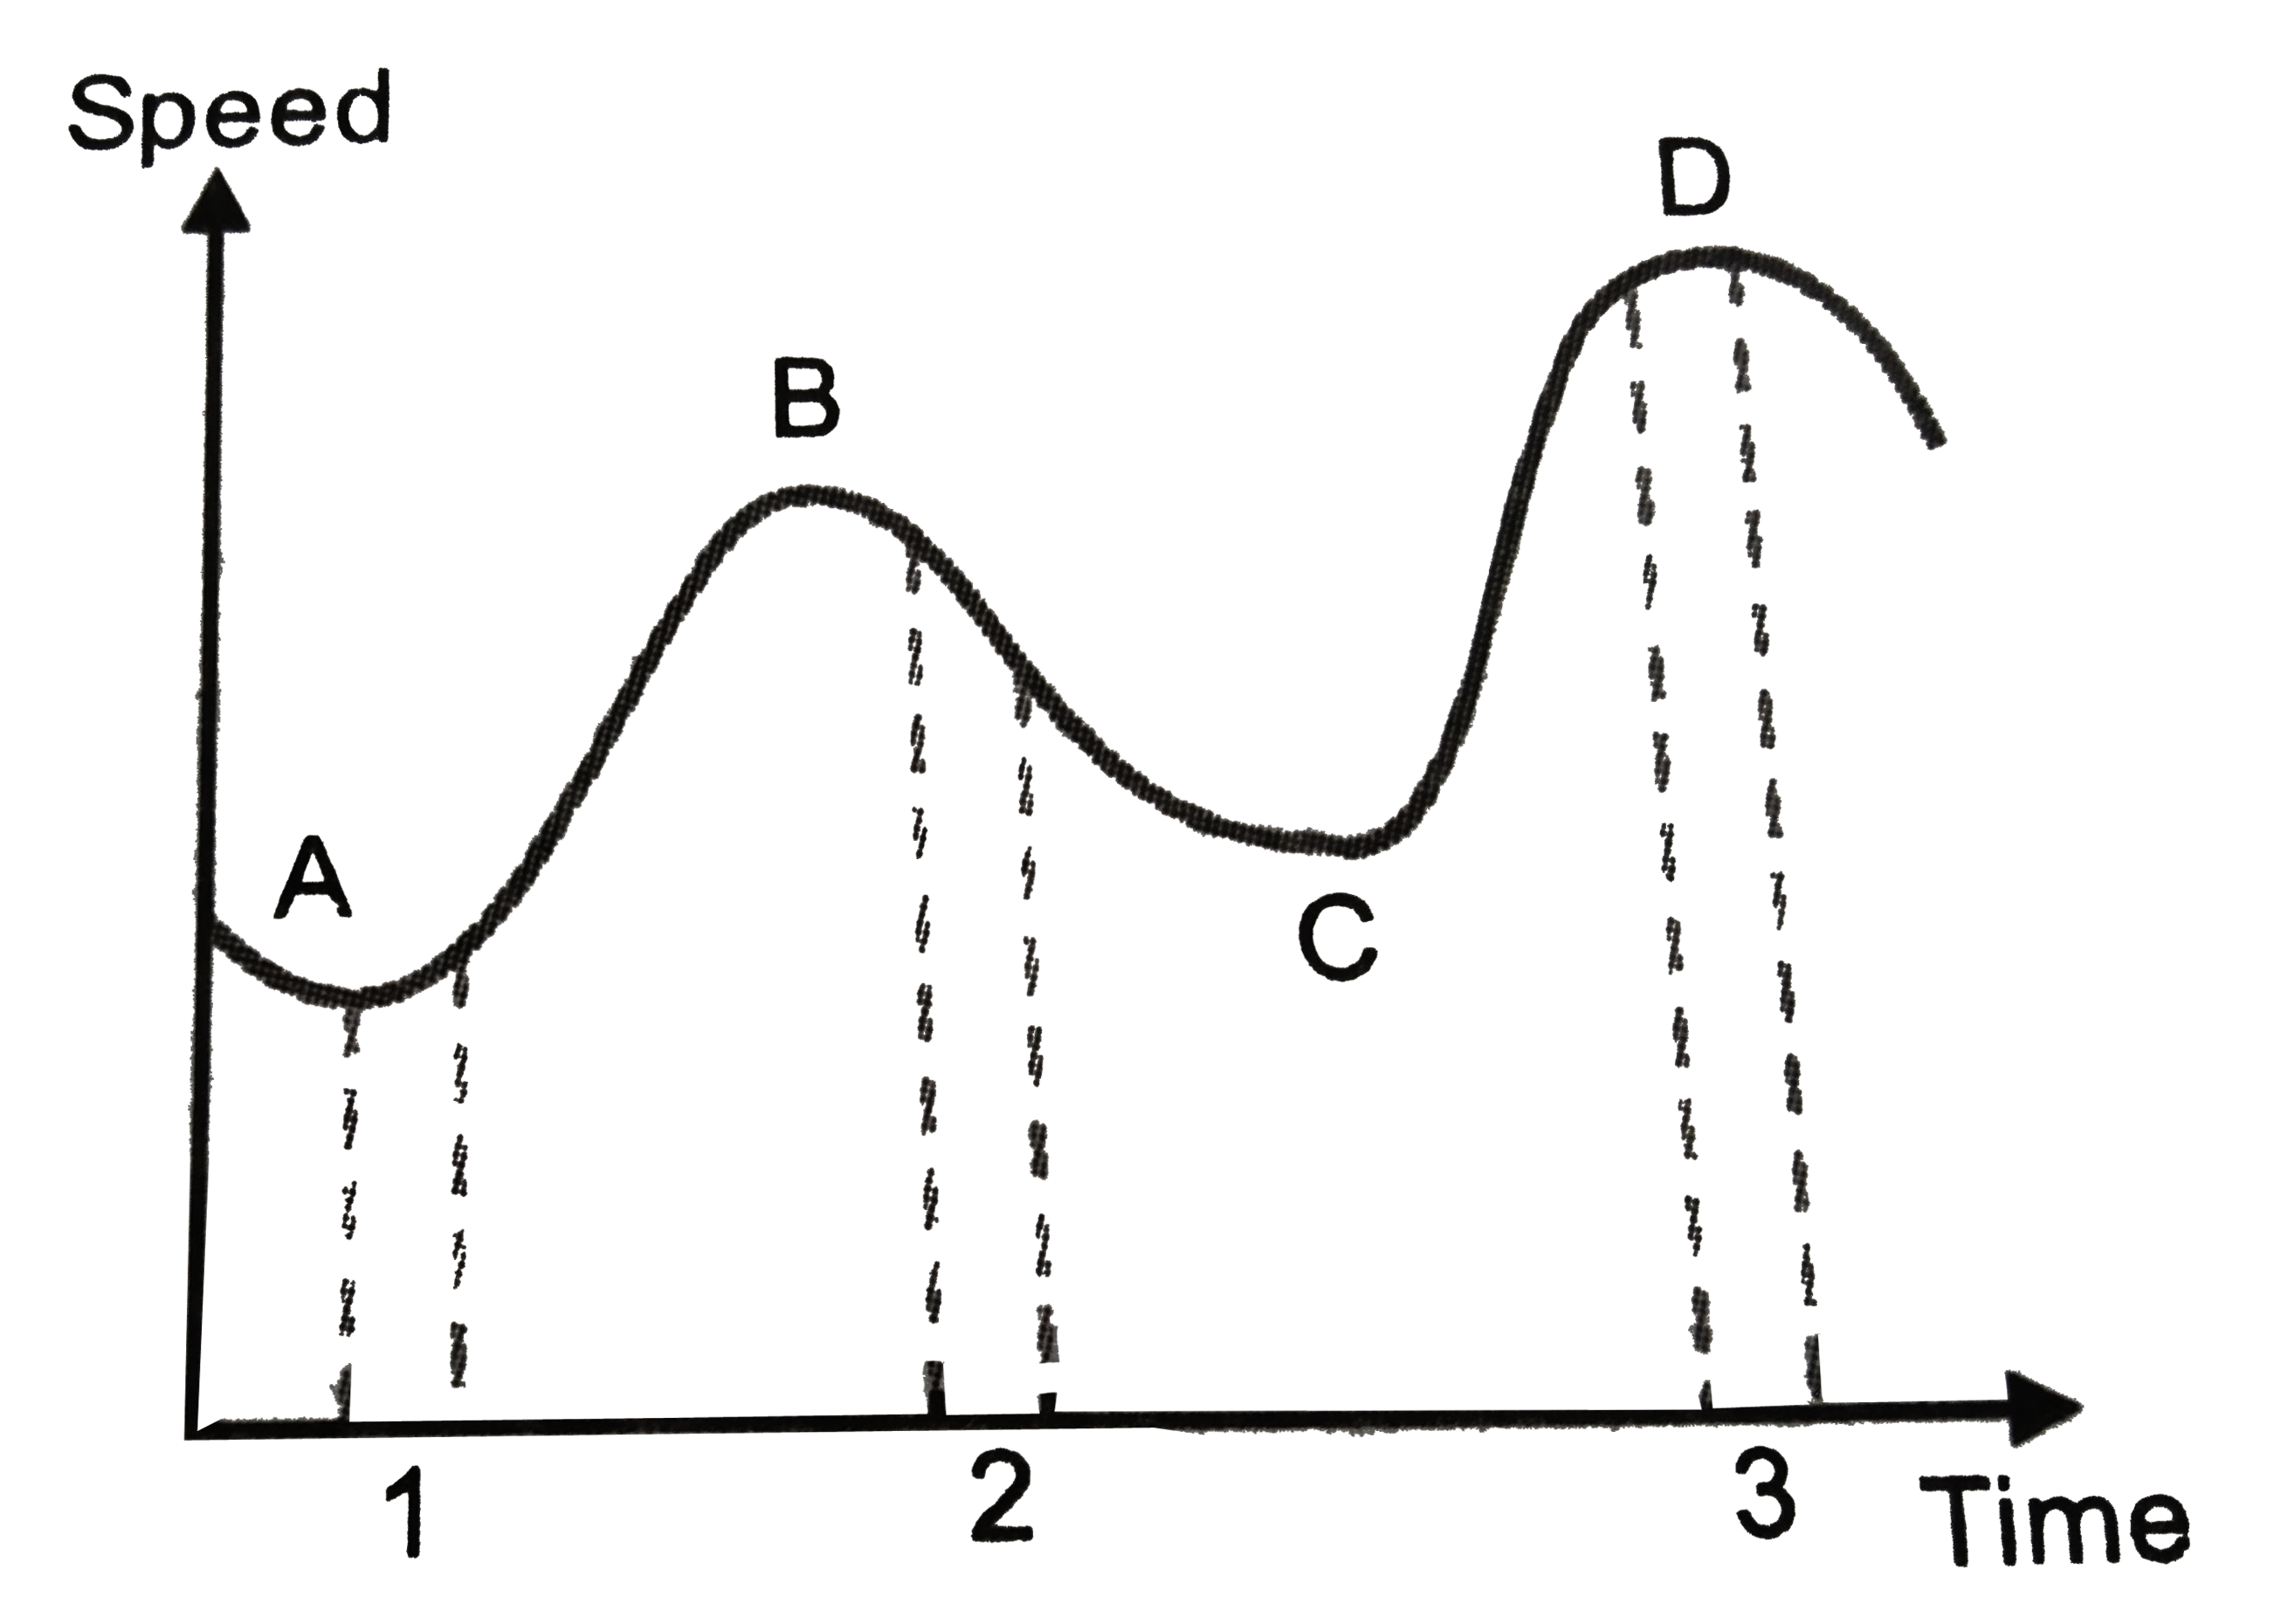
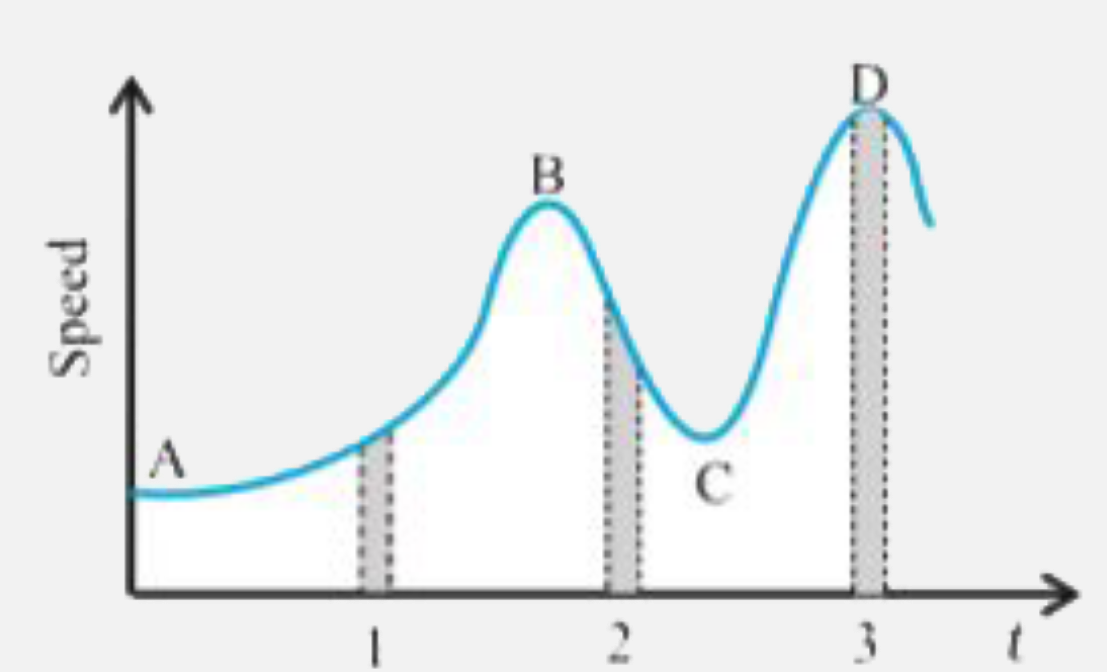
View SolutionFig. 2 (NCT). 10 . Give a speed-tiem graph of a particle in one dimenstional motion. Three different equal intervals of time are shwon. In which interval is the average acceleration graeatest in magnitude ? In which interval is the average speed greatest ? Choosing the positive direction as the constant direction of motion, give the signs of u and a in the three intervals. What are the acclerations at teh points A,B,C and D ?
 .
.
View Solutionचित्र किसी कण की एकविमीय गति का x−t ग्राफ दर्शाता है। इसमें तीन समान अन्तराल दिखाये गये है। किस अन्तराल में औसत चाल अधिकतम है और किसमें न्यूनतम है? प्रत्येक अन्तराल के लिए औसत वेग का चिन्ह बताइए।
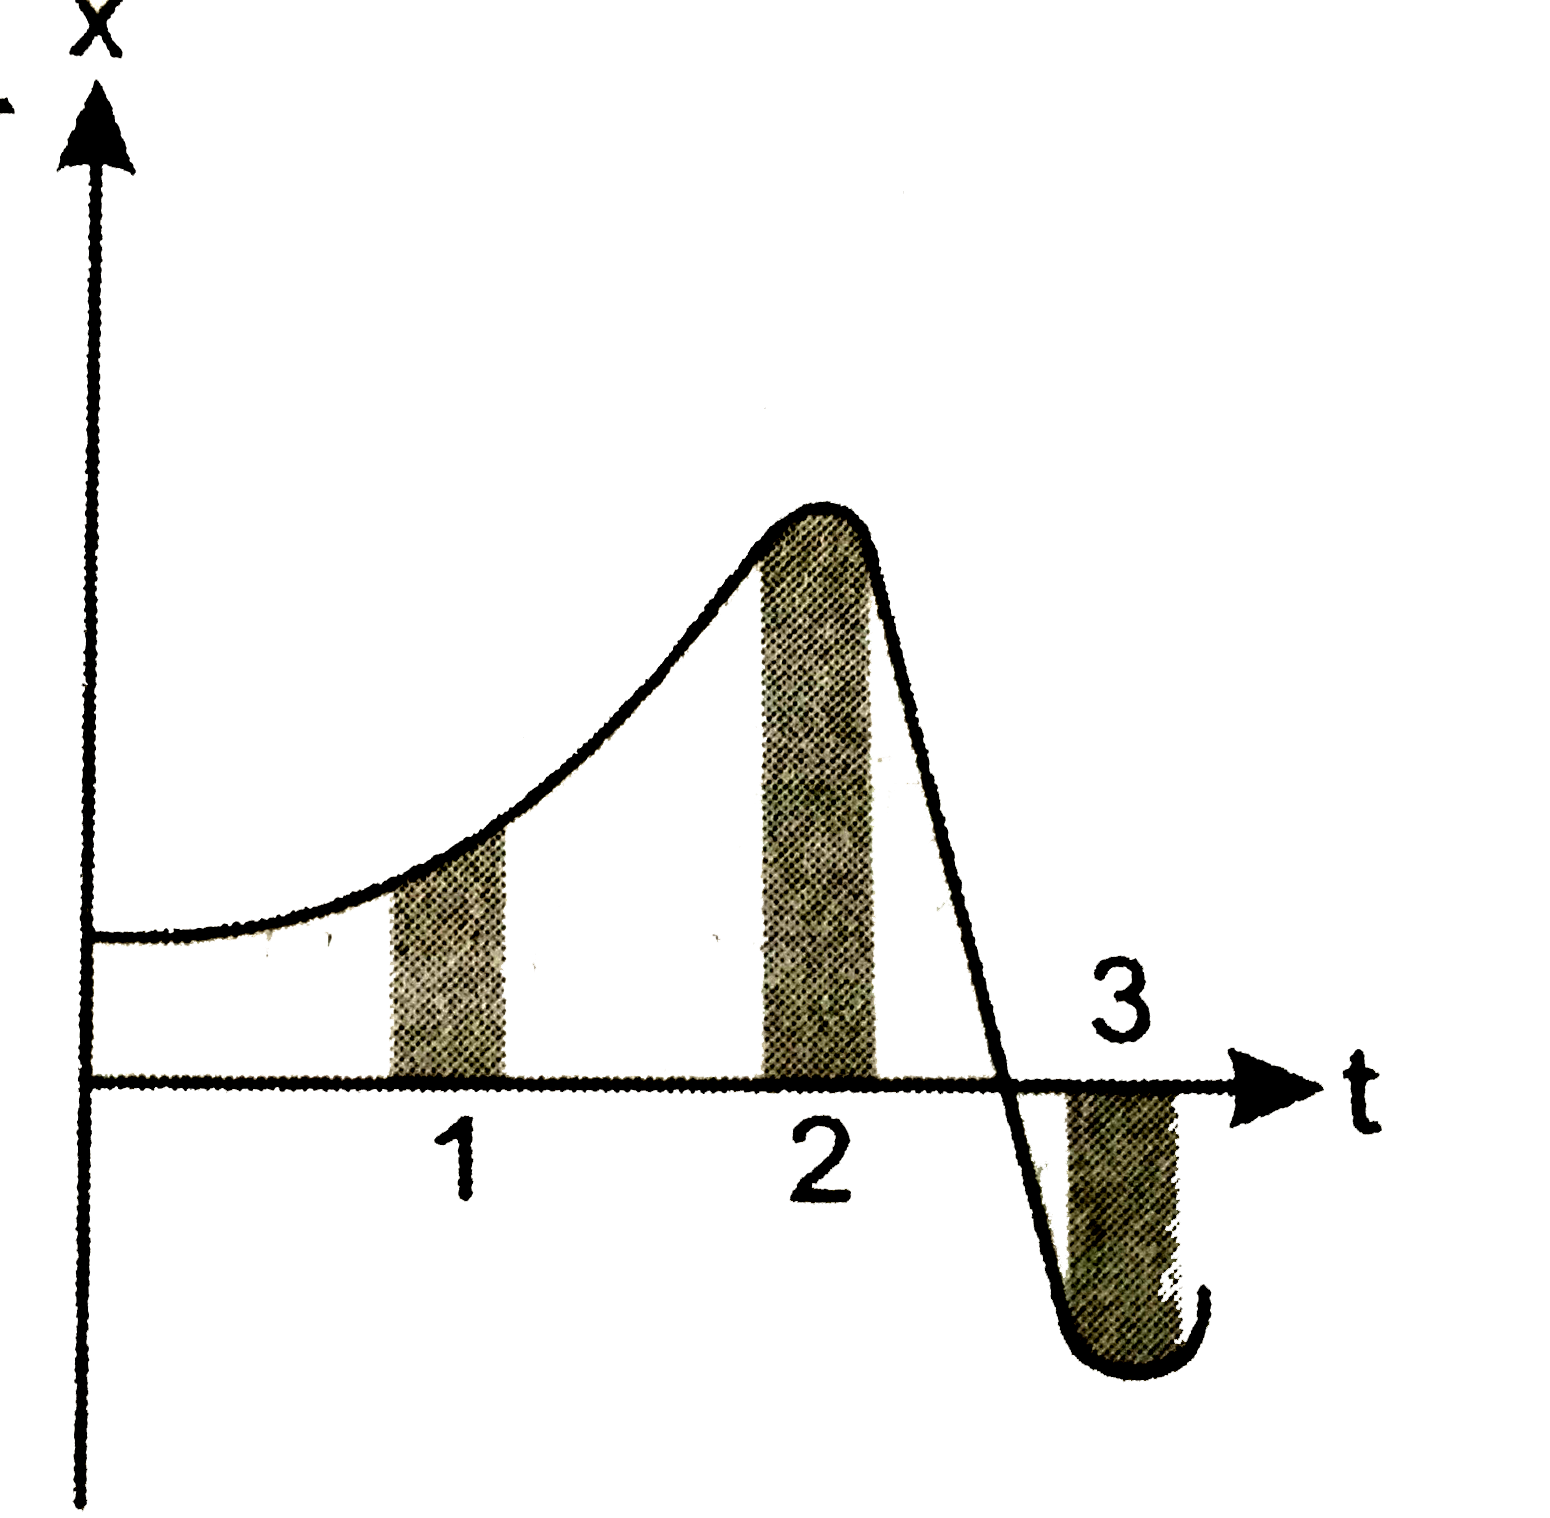
View SolutionFigure. gives the x-t plot of a particle in one-dimensional motion. Three different equal intervals of time are shown. In which interval is the average speed greatest, and in which is it the least ? Give the sign of average velocity for each interval.
View SolutionFigure. gives a speed-time graph of a particle in motion along a constant direction. Three equal intervals of time are shown. In which interval is the average acceleration greatest in magnitude ? In which interval is the average speed greatest ? Choosing the positive direction as the constant direction of motion, give the signs of v and a in the three intervals. What are the accelerations at the points A, B, C and D ?
View SolutionFigure. gives the x-t plot of a particle in one-dimensional motion. Three different equal intervals of time are shown. In which interval is the average speed greatest, and in which is it the least ? Give the sign of average velocity for each interval.
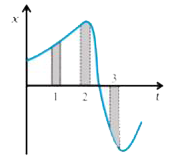
View SolutionFigure. gives a speed-time graph of a particle in motion along a constant direction. Three equal intervals of time are shown. In which interval is the average acceleration greatest in magnitude ? In which interval is the average speed greatest ? Choosing the positive direction as the constant direction of motion, give the signs of v and a in the three intervals. What are the accelerations at the points A, B, C and D ?
View SolutionFigure. gives a speed-time graph of a particle in motion along a constant direction. Three equal intervals of time are shown. In which interval is the average acceleration greatest in magnitude ? In which interval is the average speed greatest ? Choosing the positive direction as the constant direction of motion, give the signs of v and a in the three intervals. What are the accelerations at the points A, B, C and D ?
View SolutionFig. show the x-t plot of a particle in one dimensional motion. Three different equal intervals of time are shown. In which interval the average speed is greatest and in which it is the least? Give the sign of average speed for each interval. .
View SolutionFigure gives the x-t plot of a particle in one dimensional motion. Three different equal intervals of time are shown. In which interval is the average speed greatest and in which is it the least ? Give the sign of average velocity for each interval.

View SolutionFigure gives a speed - time graph of a particle in motion along a constant direction. Three equal intervals of time are shown. In which interval is the average acceleration greatest in magnitude ? In which interval is the average speed greatest? Choosing the positive direction as the constant direction of motion give the signs of vand a in the three intervals. What are the acclerations at the points A, B, C and D?
View Solution
