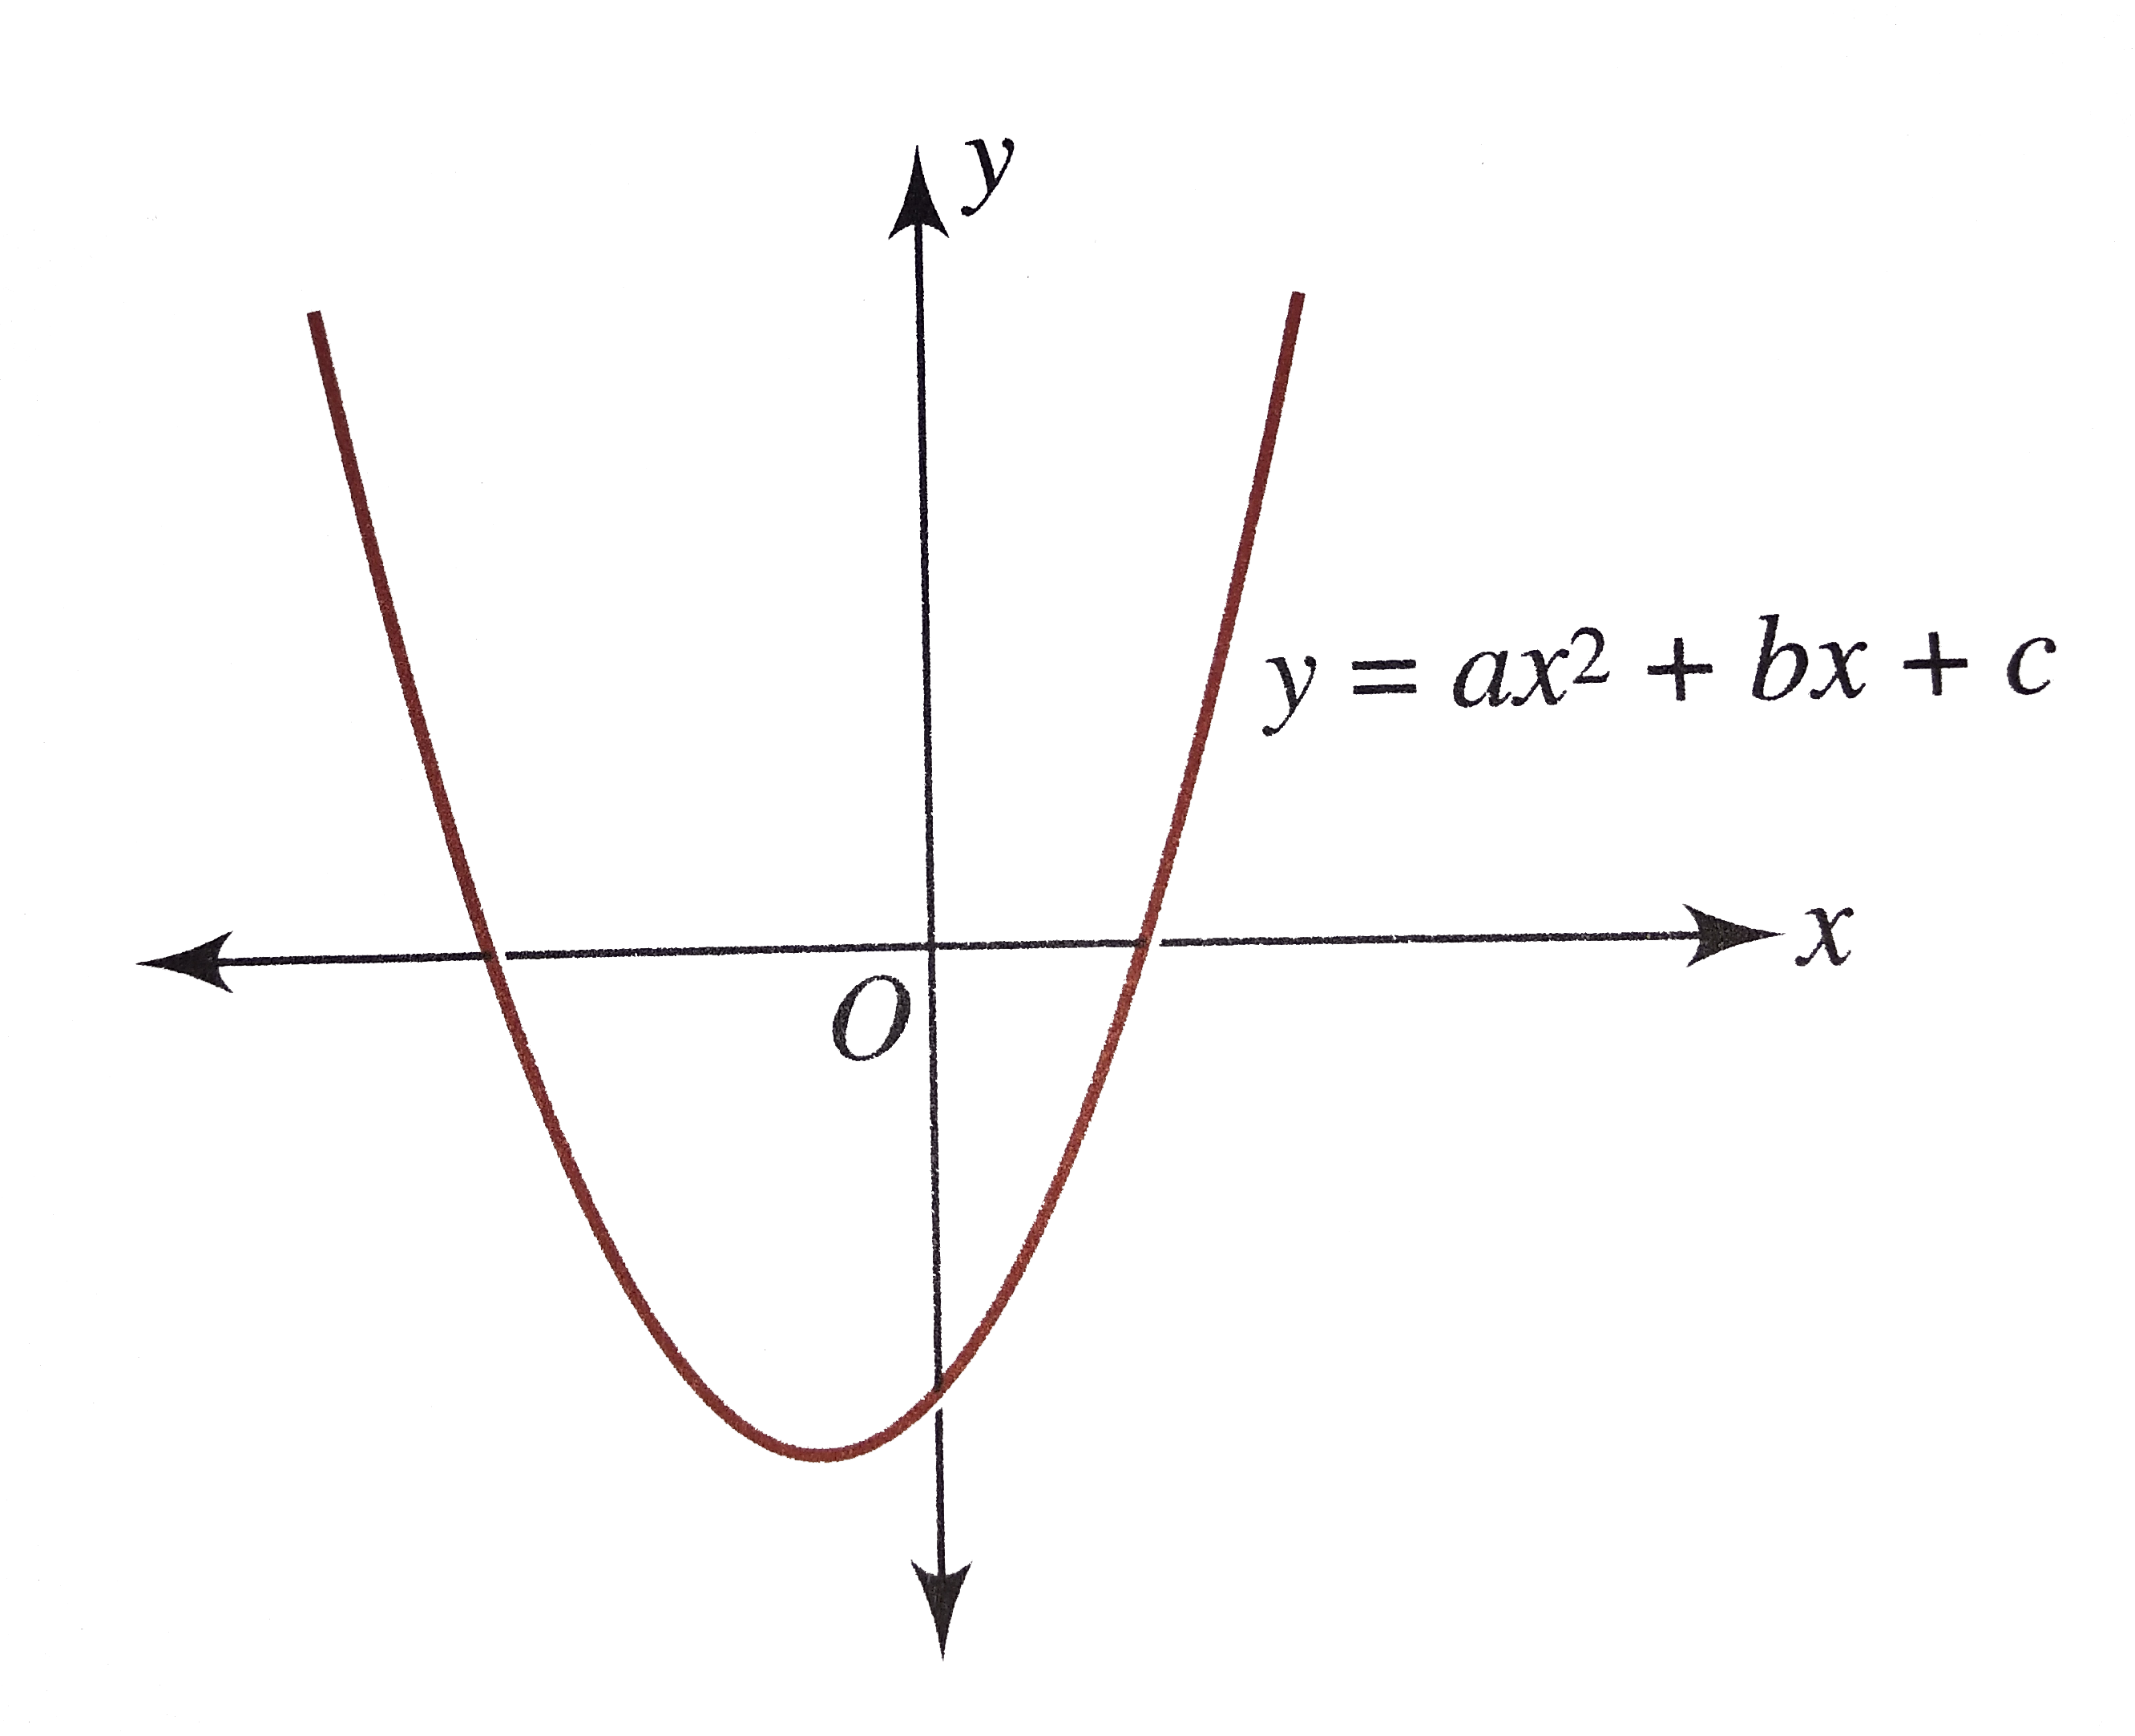
The following figure shows the graph of f(x)=ax2+bx+c, then find the sign of values of a,bandc.
 Solution in Tamil
From the graph, f(0)=c<0 (as the graph intersects the y-axis on the negative side)
Also the graph is concave upward ⇒a>0
Further the vertex lies on the left-hand side of the y-axis.
So the abscissa or the vertex −b2a<0
⇒b>0(as a>0)

Topper's Solved these Questions
- GRAPHS OF ELEMENTARY FUNCTIONS BOOK - CENGAGECHAPTER - GRAPHS OF ELEMENTARY FUNCTIONS EXERCISE - Exercise
34 Videos
- GRAPHS OF POLYNOMIAL AND RATIONAL FUNCTIONSBOOK - CENGAGECHAPTER - GRAPHS OF POLYNOMIAL AND RATIONAL FUNCTIONSEXERCISE - Exercises
4 Videos
- GRAPHS OF TRIGONOMETRIC FUNCTIONSBOOK - CENGAGECHAPTER - GRAPHS OF TRIGONOMETRIC FUNCTIONSEXERCISE - Exercise
22 Videos
Similar Questions
Draw the graph of y=1(1/x).
View SolutionSketch the graph of an example of a rational function f that satisfies all the given conditions.
(i) f(0)=0,f(1),limx→∞f(x)=0,f is odd
(ii) limx→0+f(x)=∞,limx→0−f(x)=−∞,limx→∞f(x)=1,limx→−∞f(x)=1
(iii) limx→−2f(x)=∞,limx→−∞f(x)=3,limx→∞f(x)=3,f(0)=0
View SolutionDraw the graph of y= cosec 2x−cot2x. Is f(x) periodic ? If yes, what is its fundamental period ?
View SolutionHow many lines of symmetry does the above figure have ?
View SolutionDetermine the point of symmetry of a regular hexagon.
View SolutionDtermine the images of the following figure about the given line :
View SolutionMatch the following Column A to Column B

View SolutionMatch the following Column A to Column B

View SolutionMatch the following Column A to Column B

View SolutionFind the area of figure given below.

View SolutionFind the perimeter of the figure given below.

View SolutionFind the area of the figure given below.

View SolutionThe inequation represented by the graph given below is :
View SolutionThe inequation that best describes the graph given below is _________
View SolutionThe inequation that best describes the following graph is _________
View SolutionWhich inequations represent the shaded region in the given figure
View Solution
