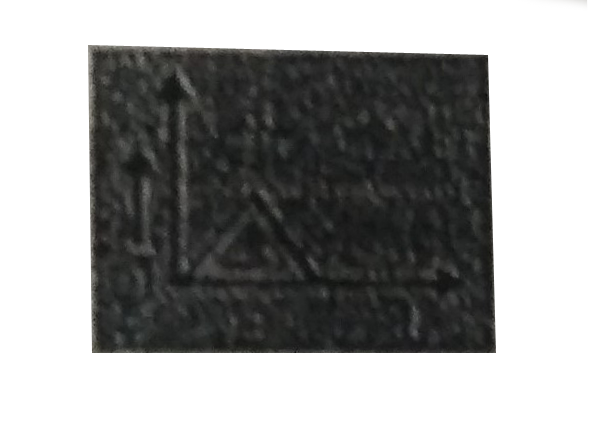
The graph between the current and the time for an inductance coil is shown below. Which of the following graph show the voltage-time variation-
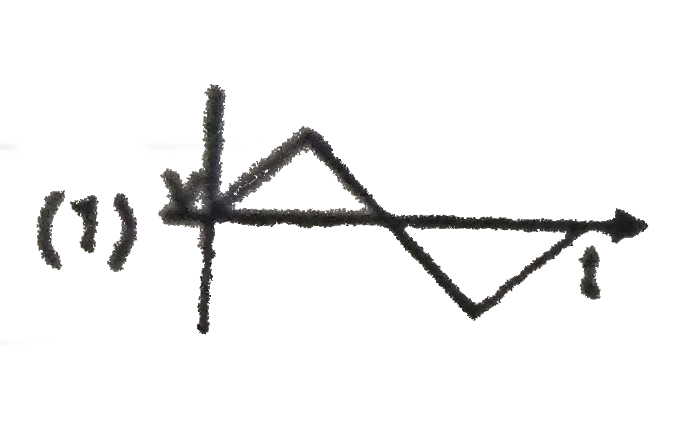
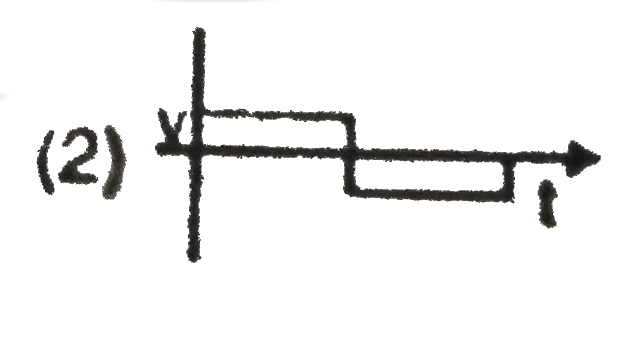
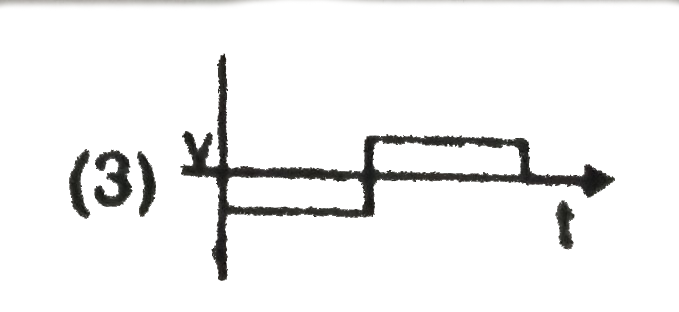
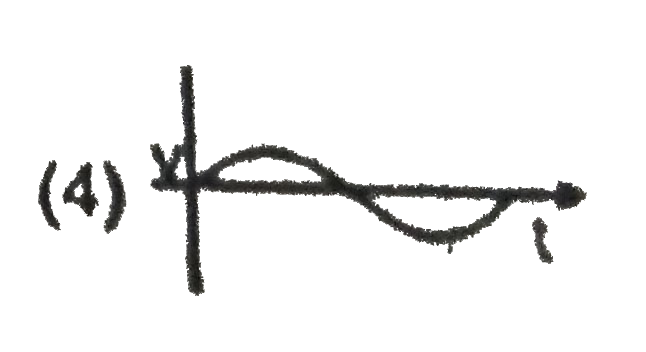
The correct Answer is:C
e=−Ldidti=Kt
Topper's Solved these Questions
Similar Questions
An alternating current I in an inductance coil varies with time t according to the graph as shown: Which one of the following graph gives the variation of voltage with time?
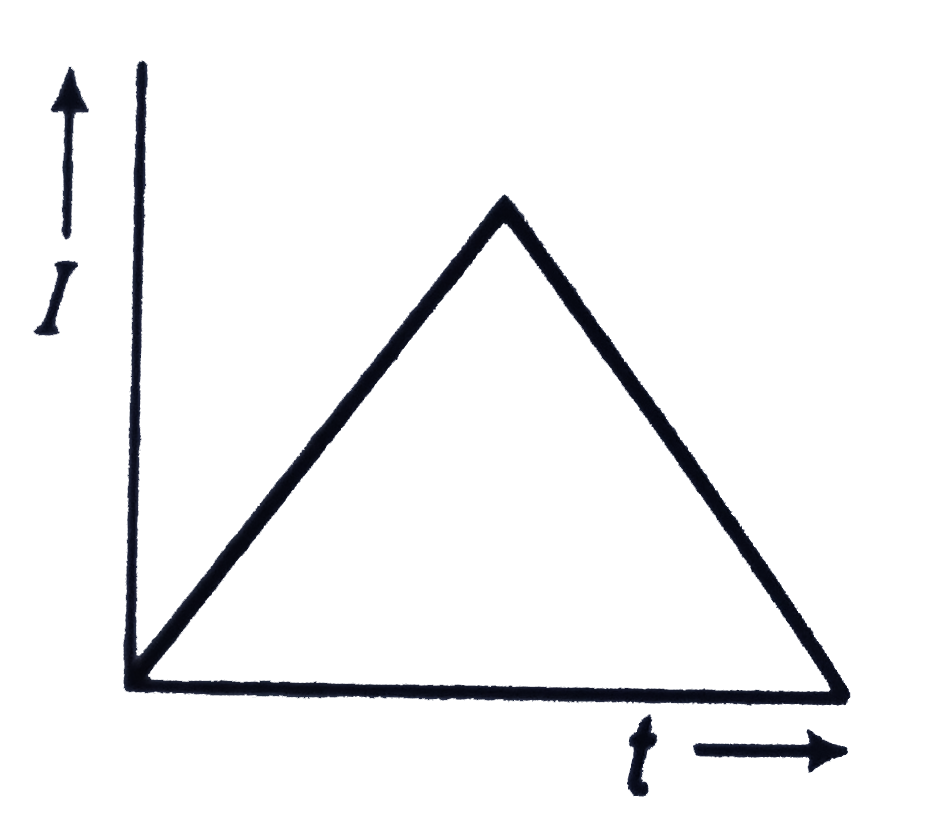 View Solution
An alternating current I in an inductance coil varies with time t according to the graph as shown: Which one of the following graph gives the variation of voltage with time?
 View Solution
Knowledge Check
- Question 1 - Select One
Which of the following is the graph showing stress-strain variation for elastomers ?
A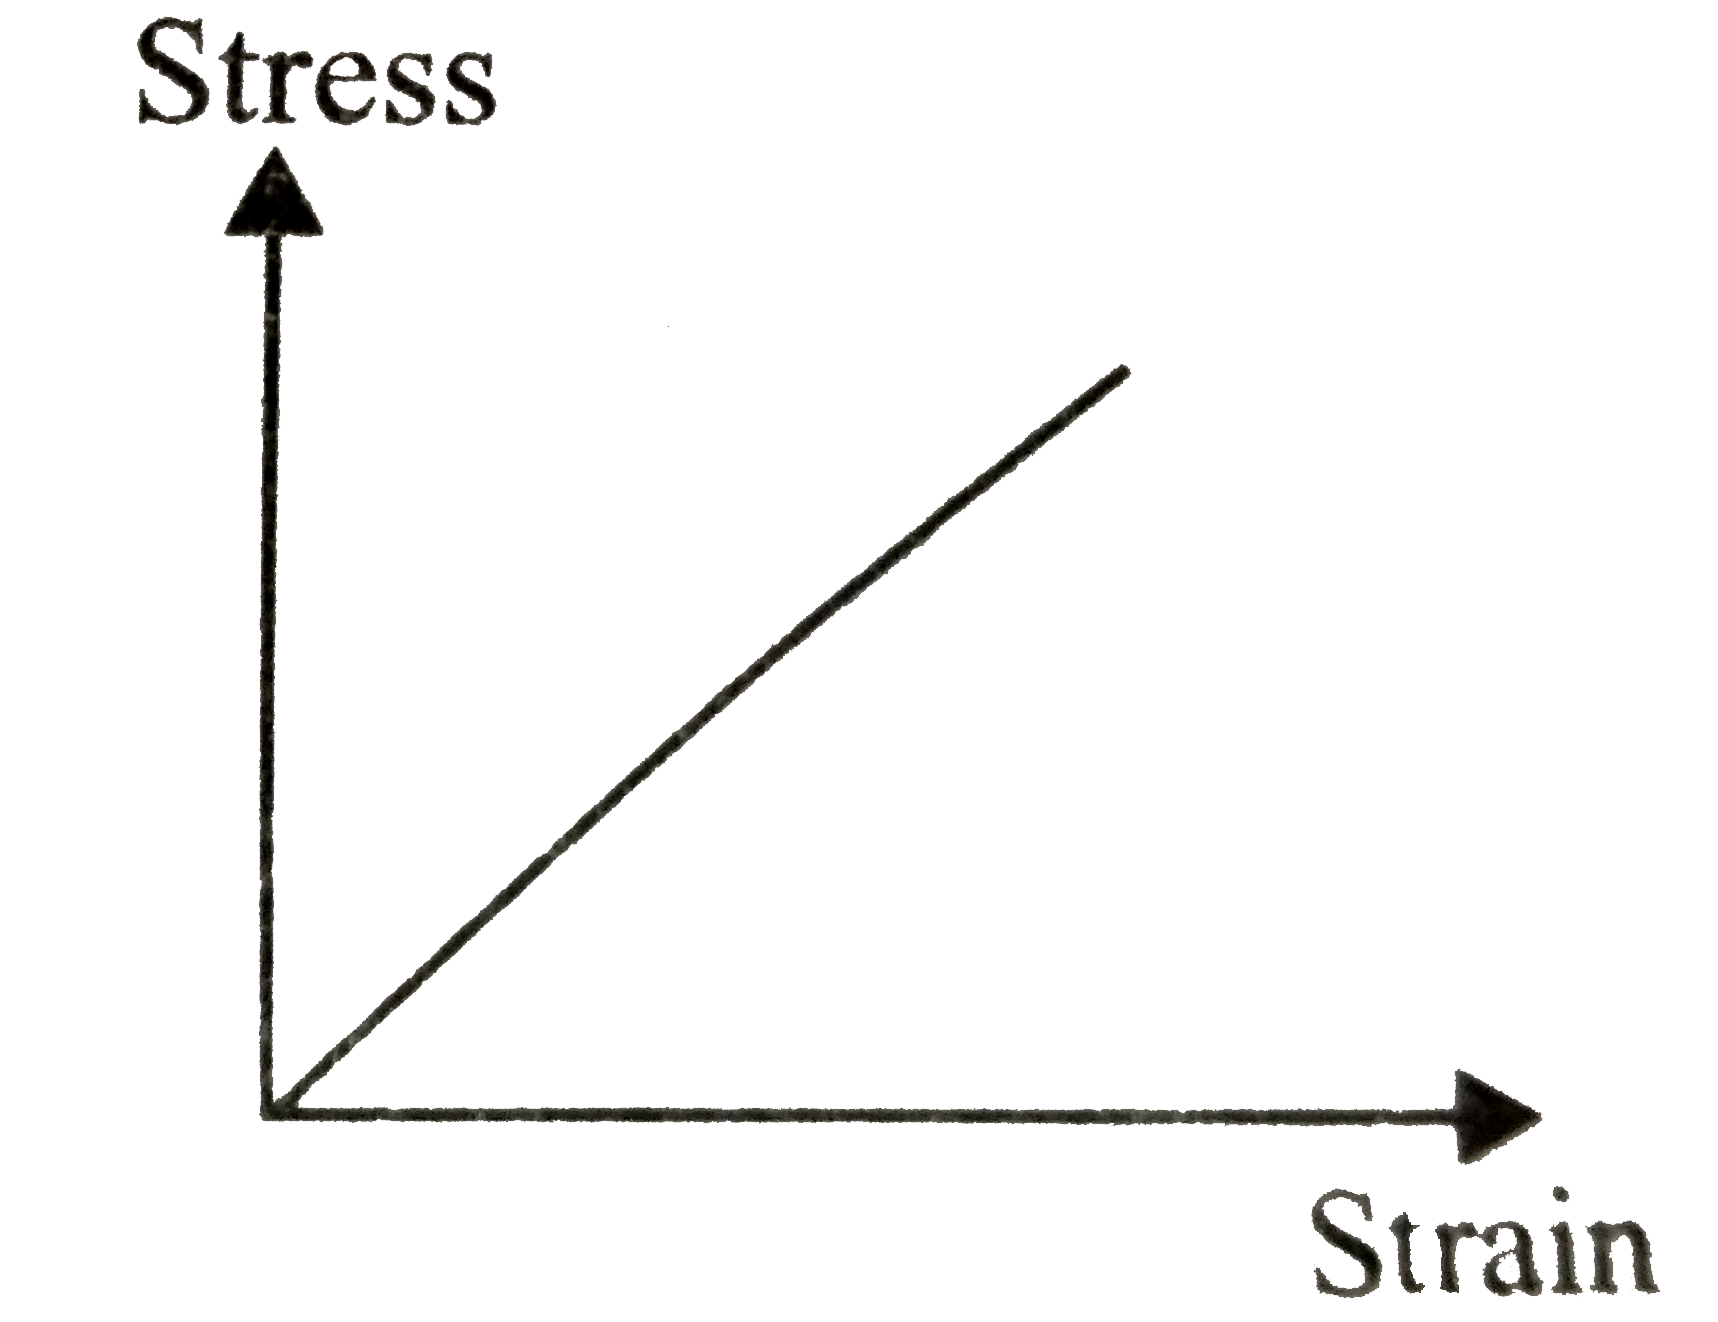 B
B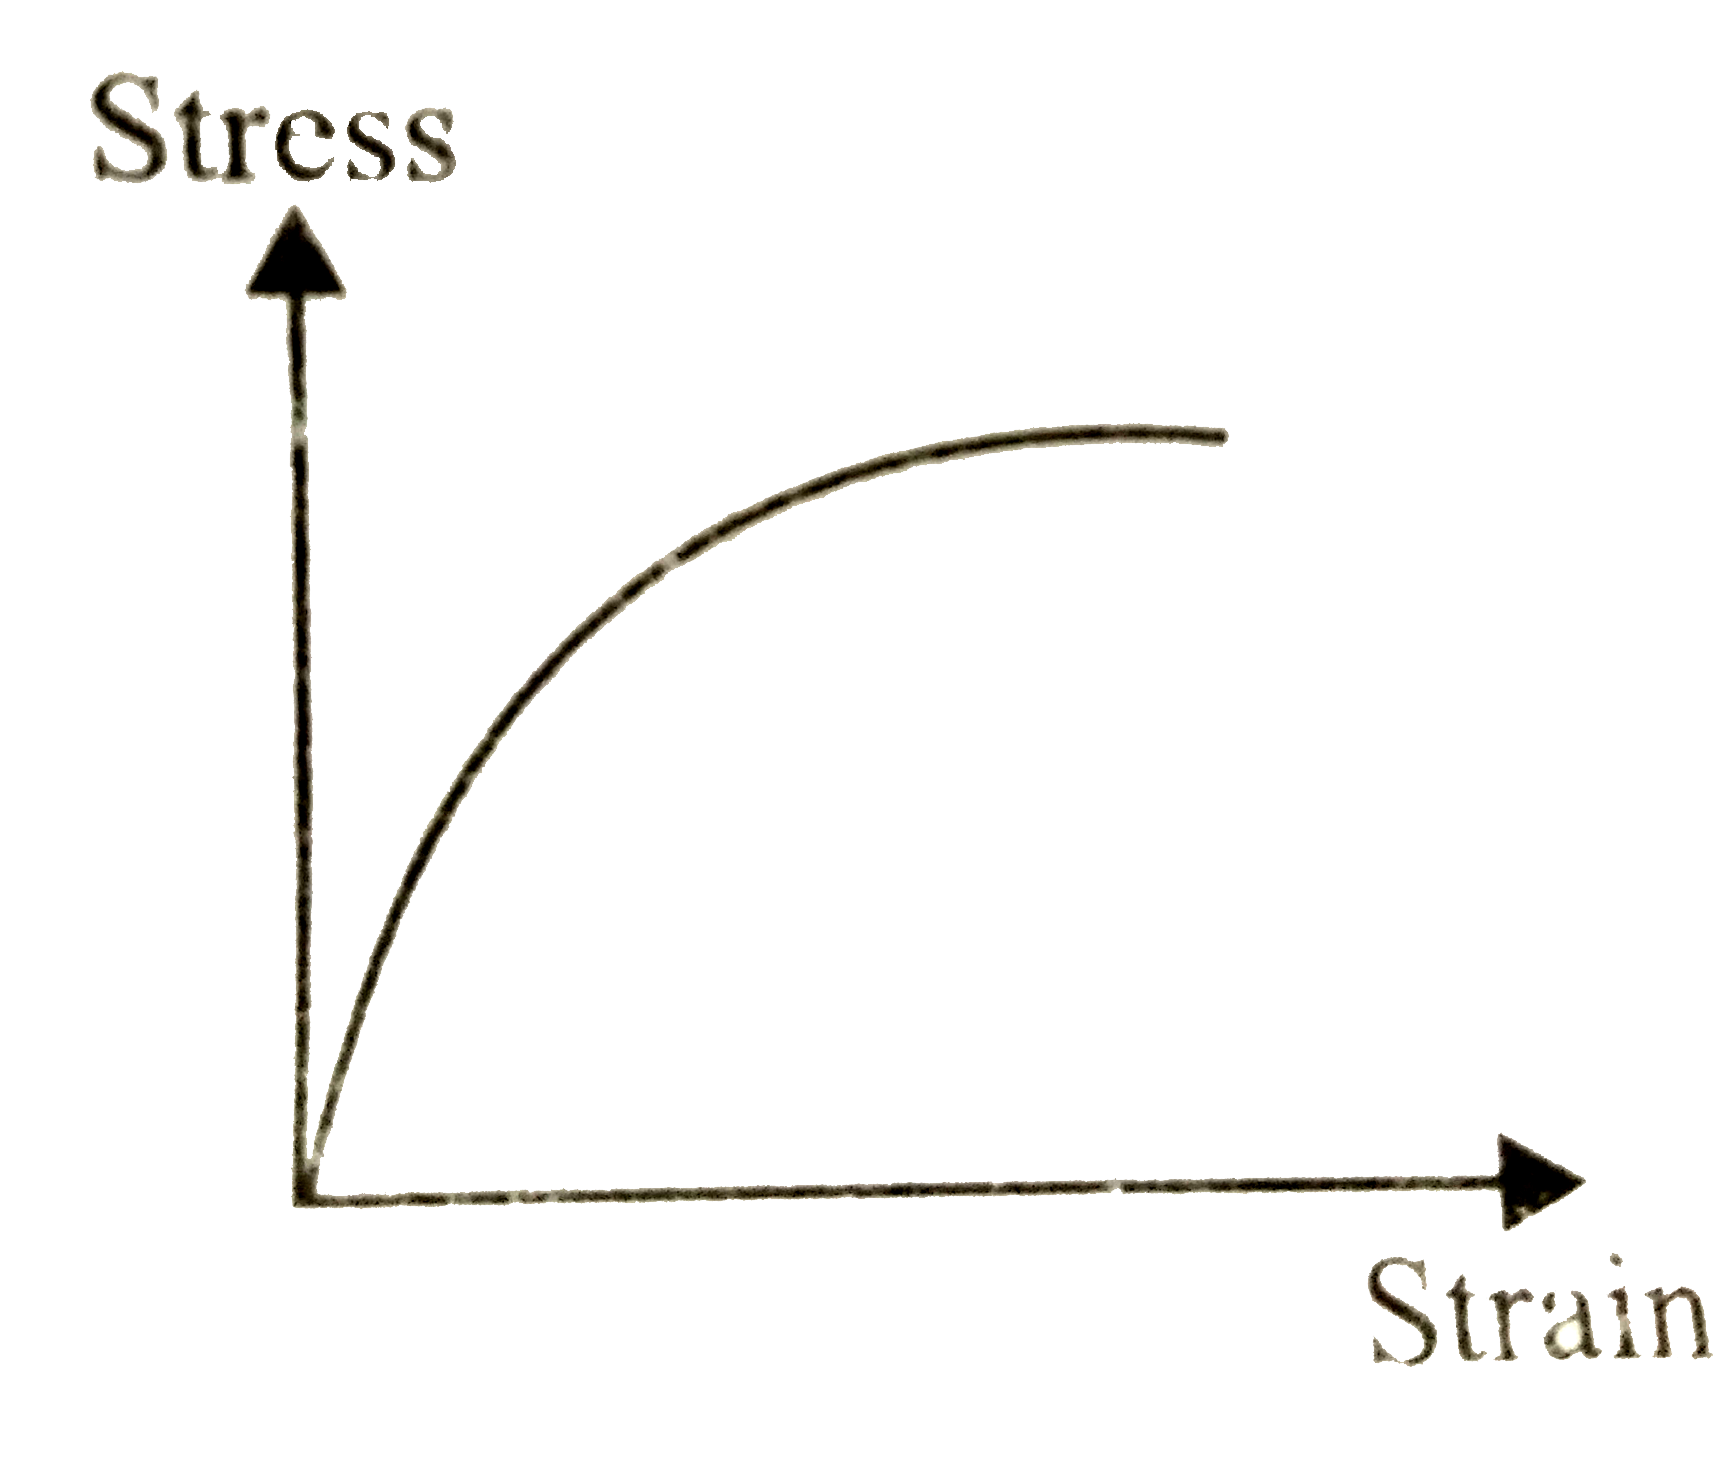 C
C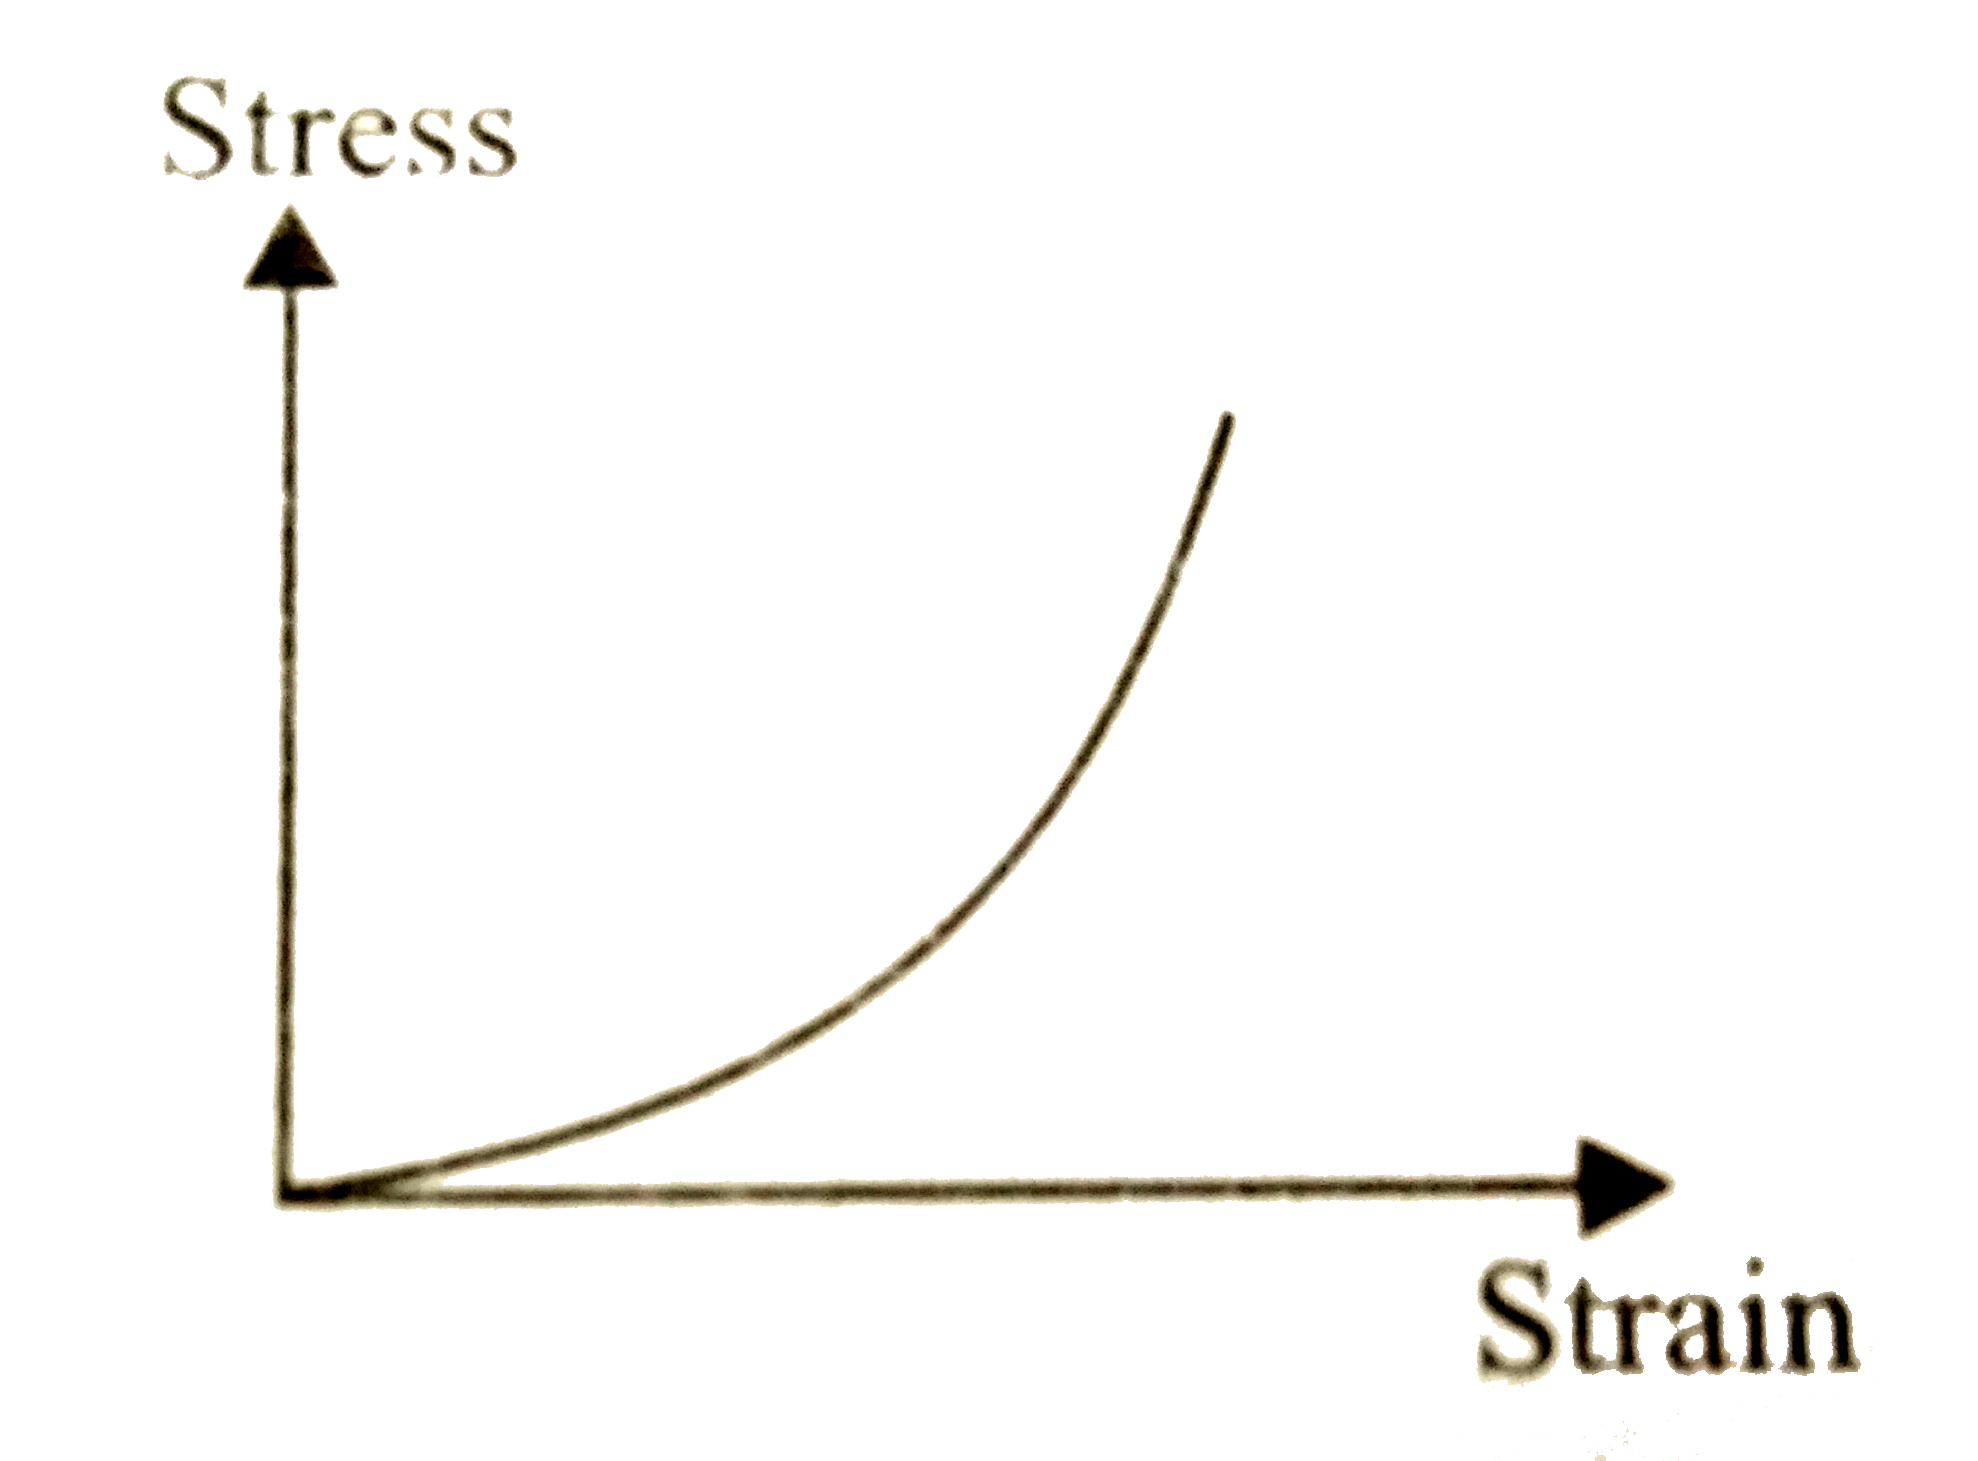 D
D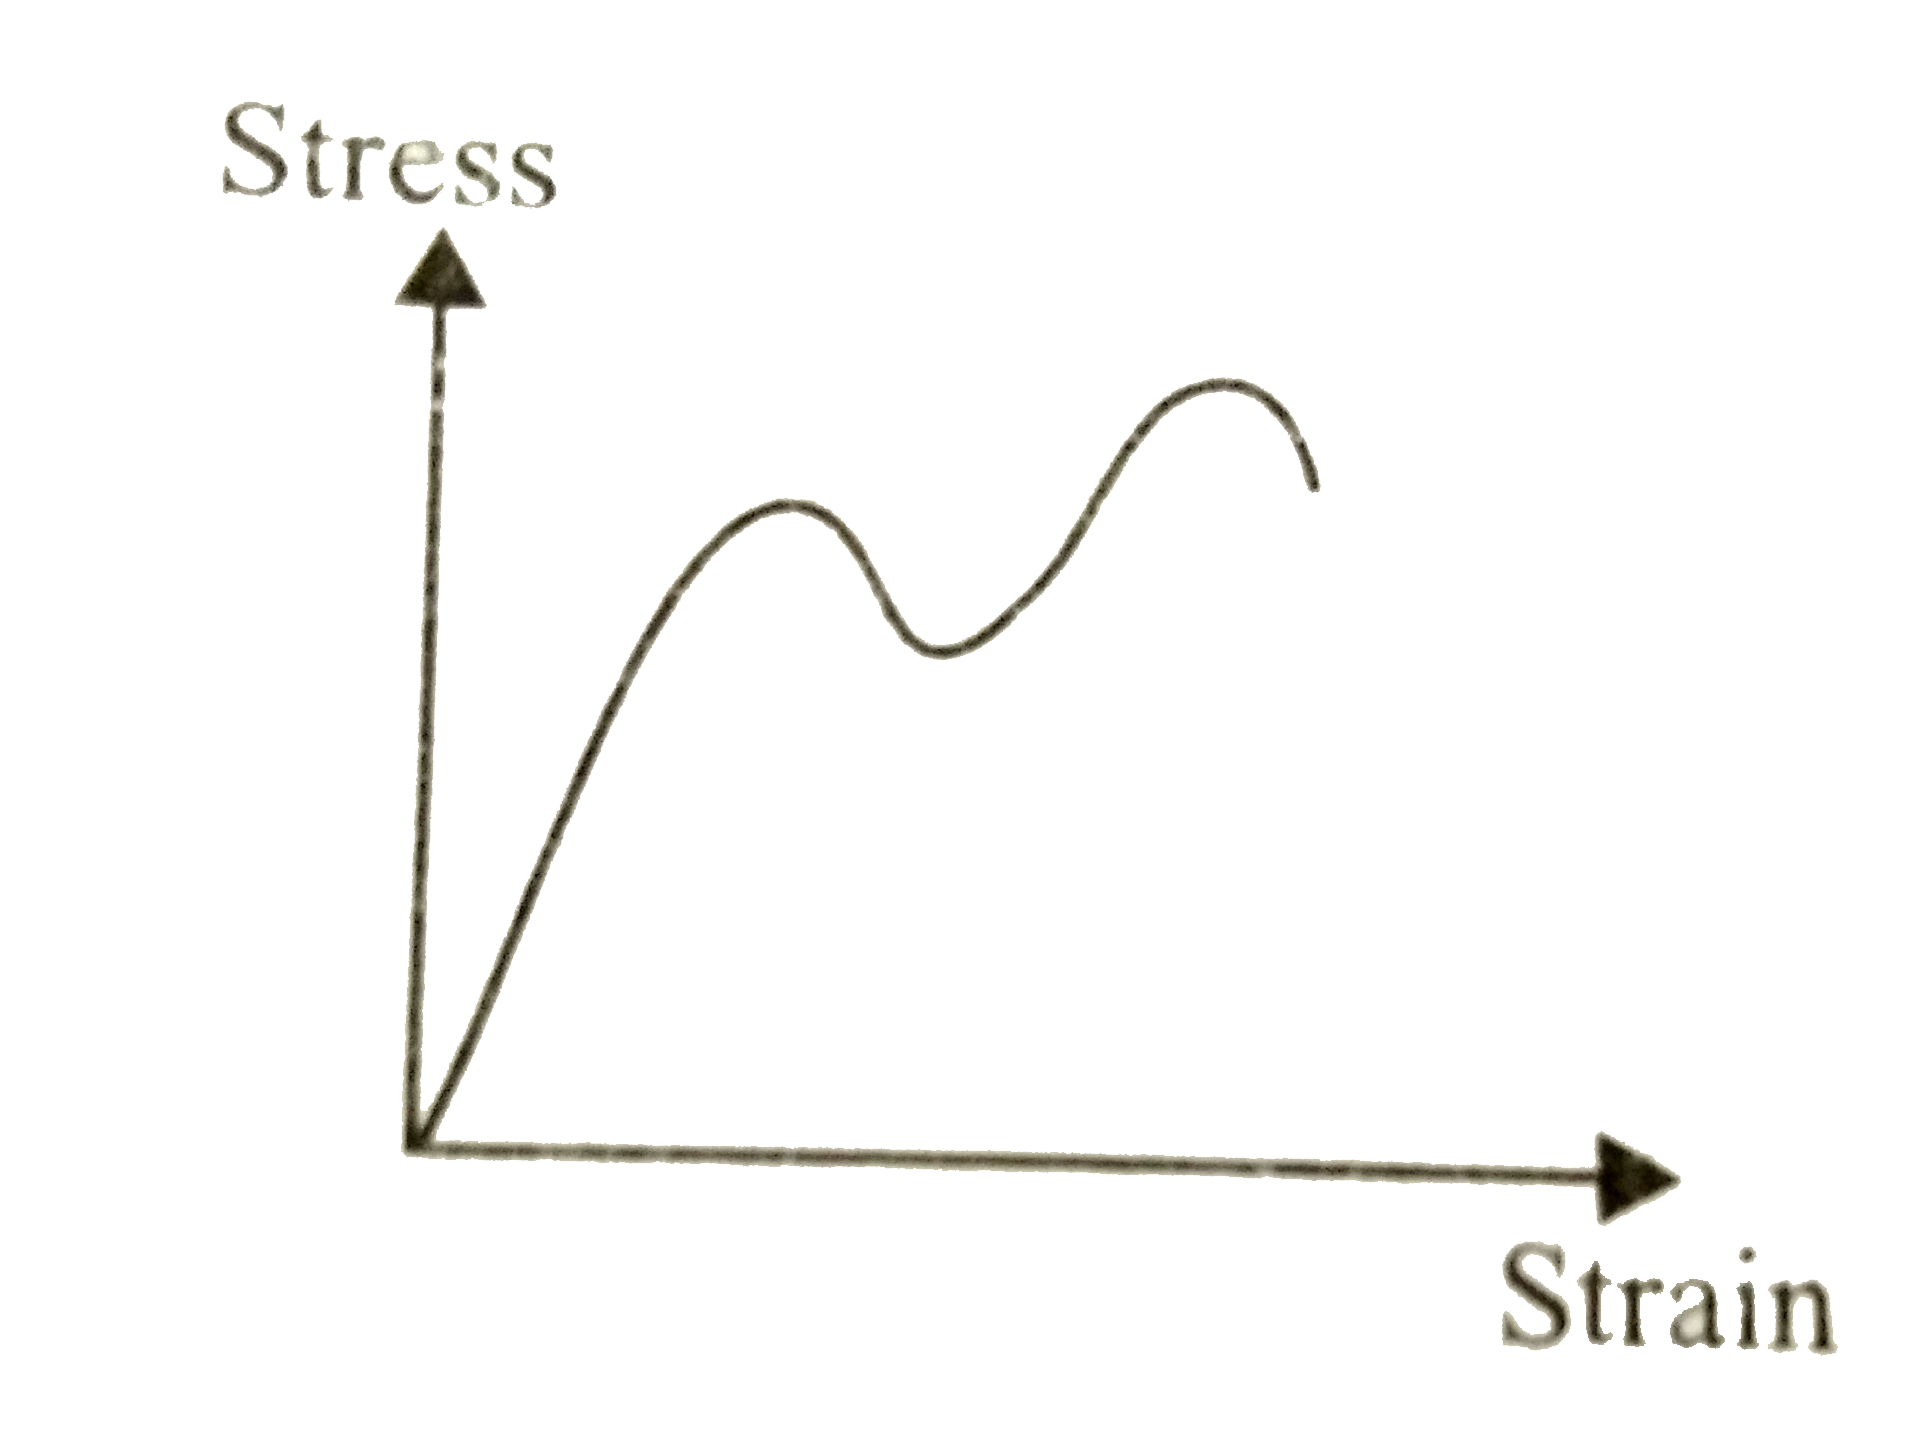
The graph shown the variation with times t of the velocity v of an object . Which one of the following graphs best represents the variation of acceleration a of the object with time t?
 View Solution
The equation of a tangent to the parabola y2=8xisy=x+2 . The point on this line from which the other tangent to the parabola is perpendicular to the given tangent is (1) (−1,1) (2) (0,2) (3) (2,4) (4) (−2,0)
View SolutionThe current (I) in the inductance is varying with time according to the plot shown in figure.
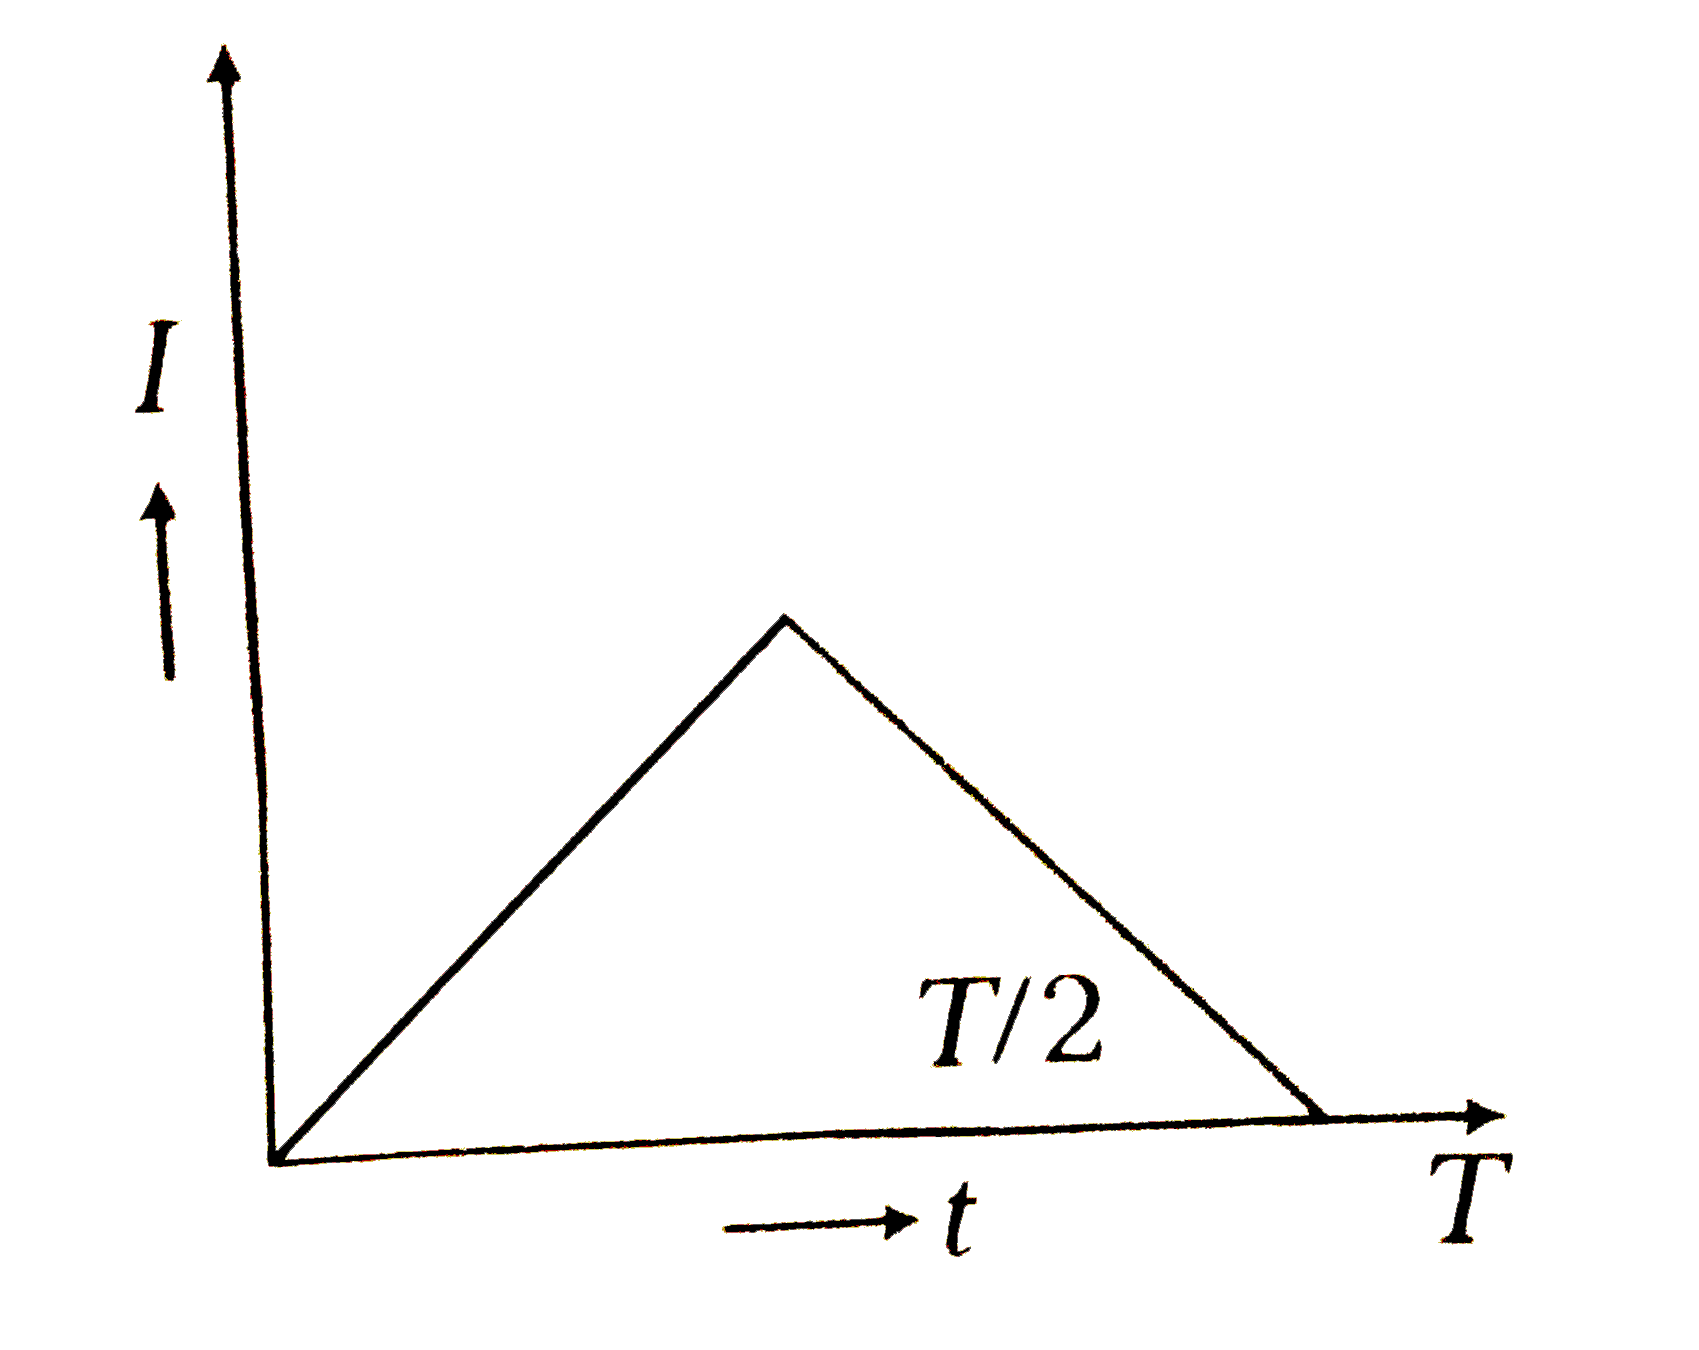
Which one of the following is the corrcet variation of voltage with time in the coil ?View SolutionThe current (I) in the inductance is varying with time according to the plot shown in figure.
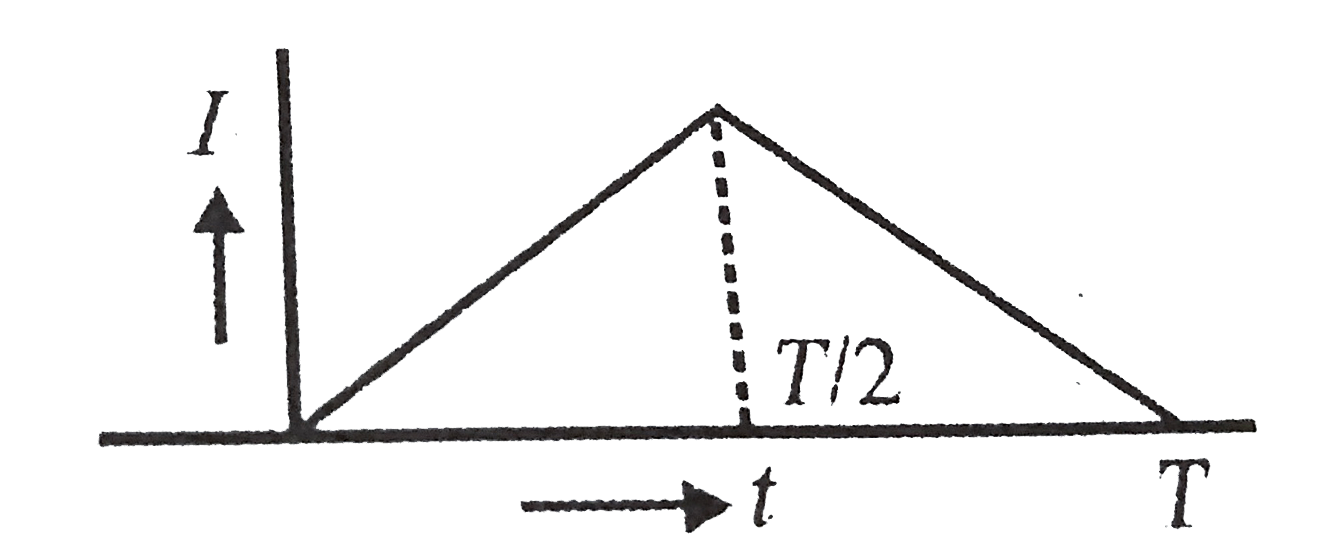
Which one of the following is the correct variation of voltage with time in the coil?View SolutionThe current i in an induction coil varies with time according to the graph shown in figure. Which of the following graph shows induced emf in the coil with time:
View SolutionThe graph below shws the velocity versus time graph for a body
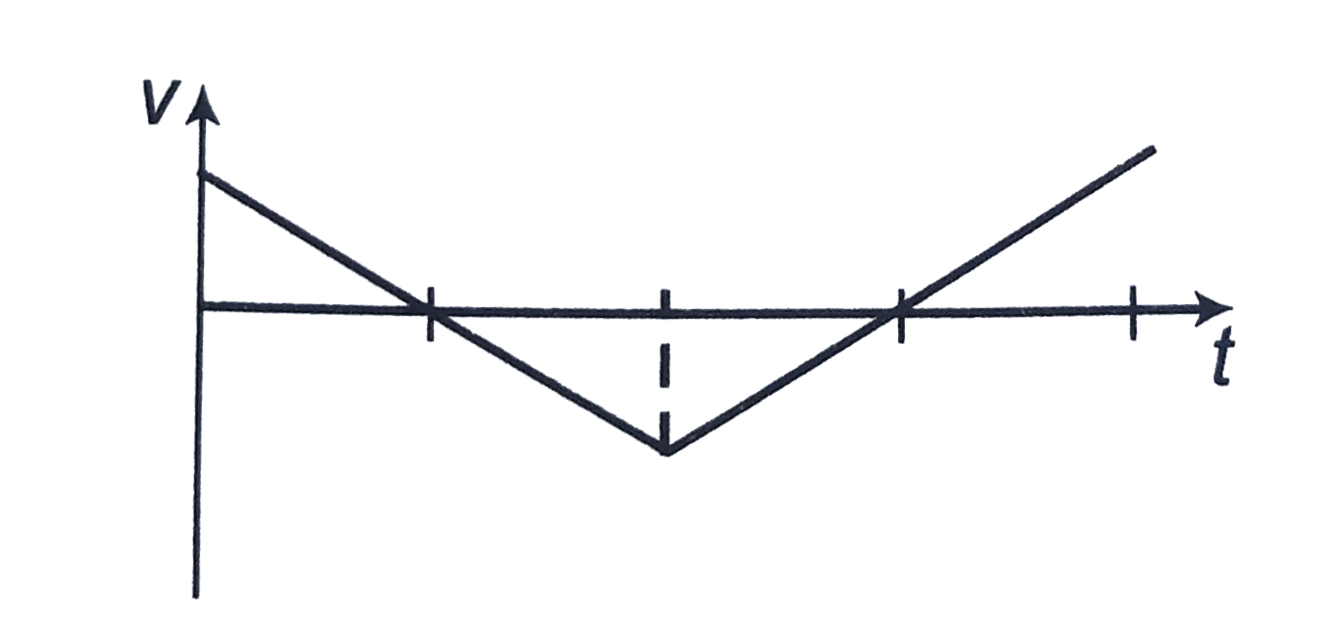
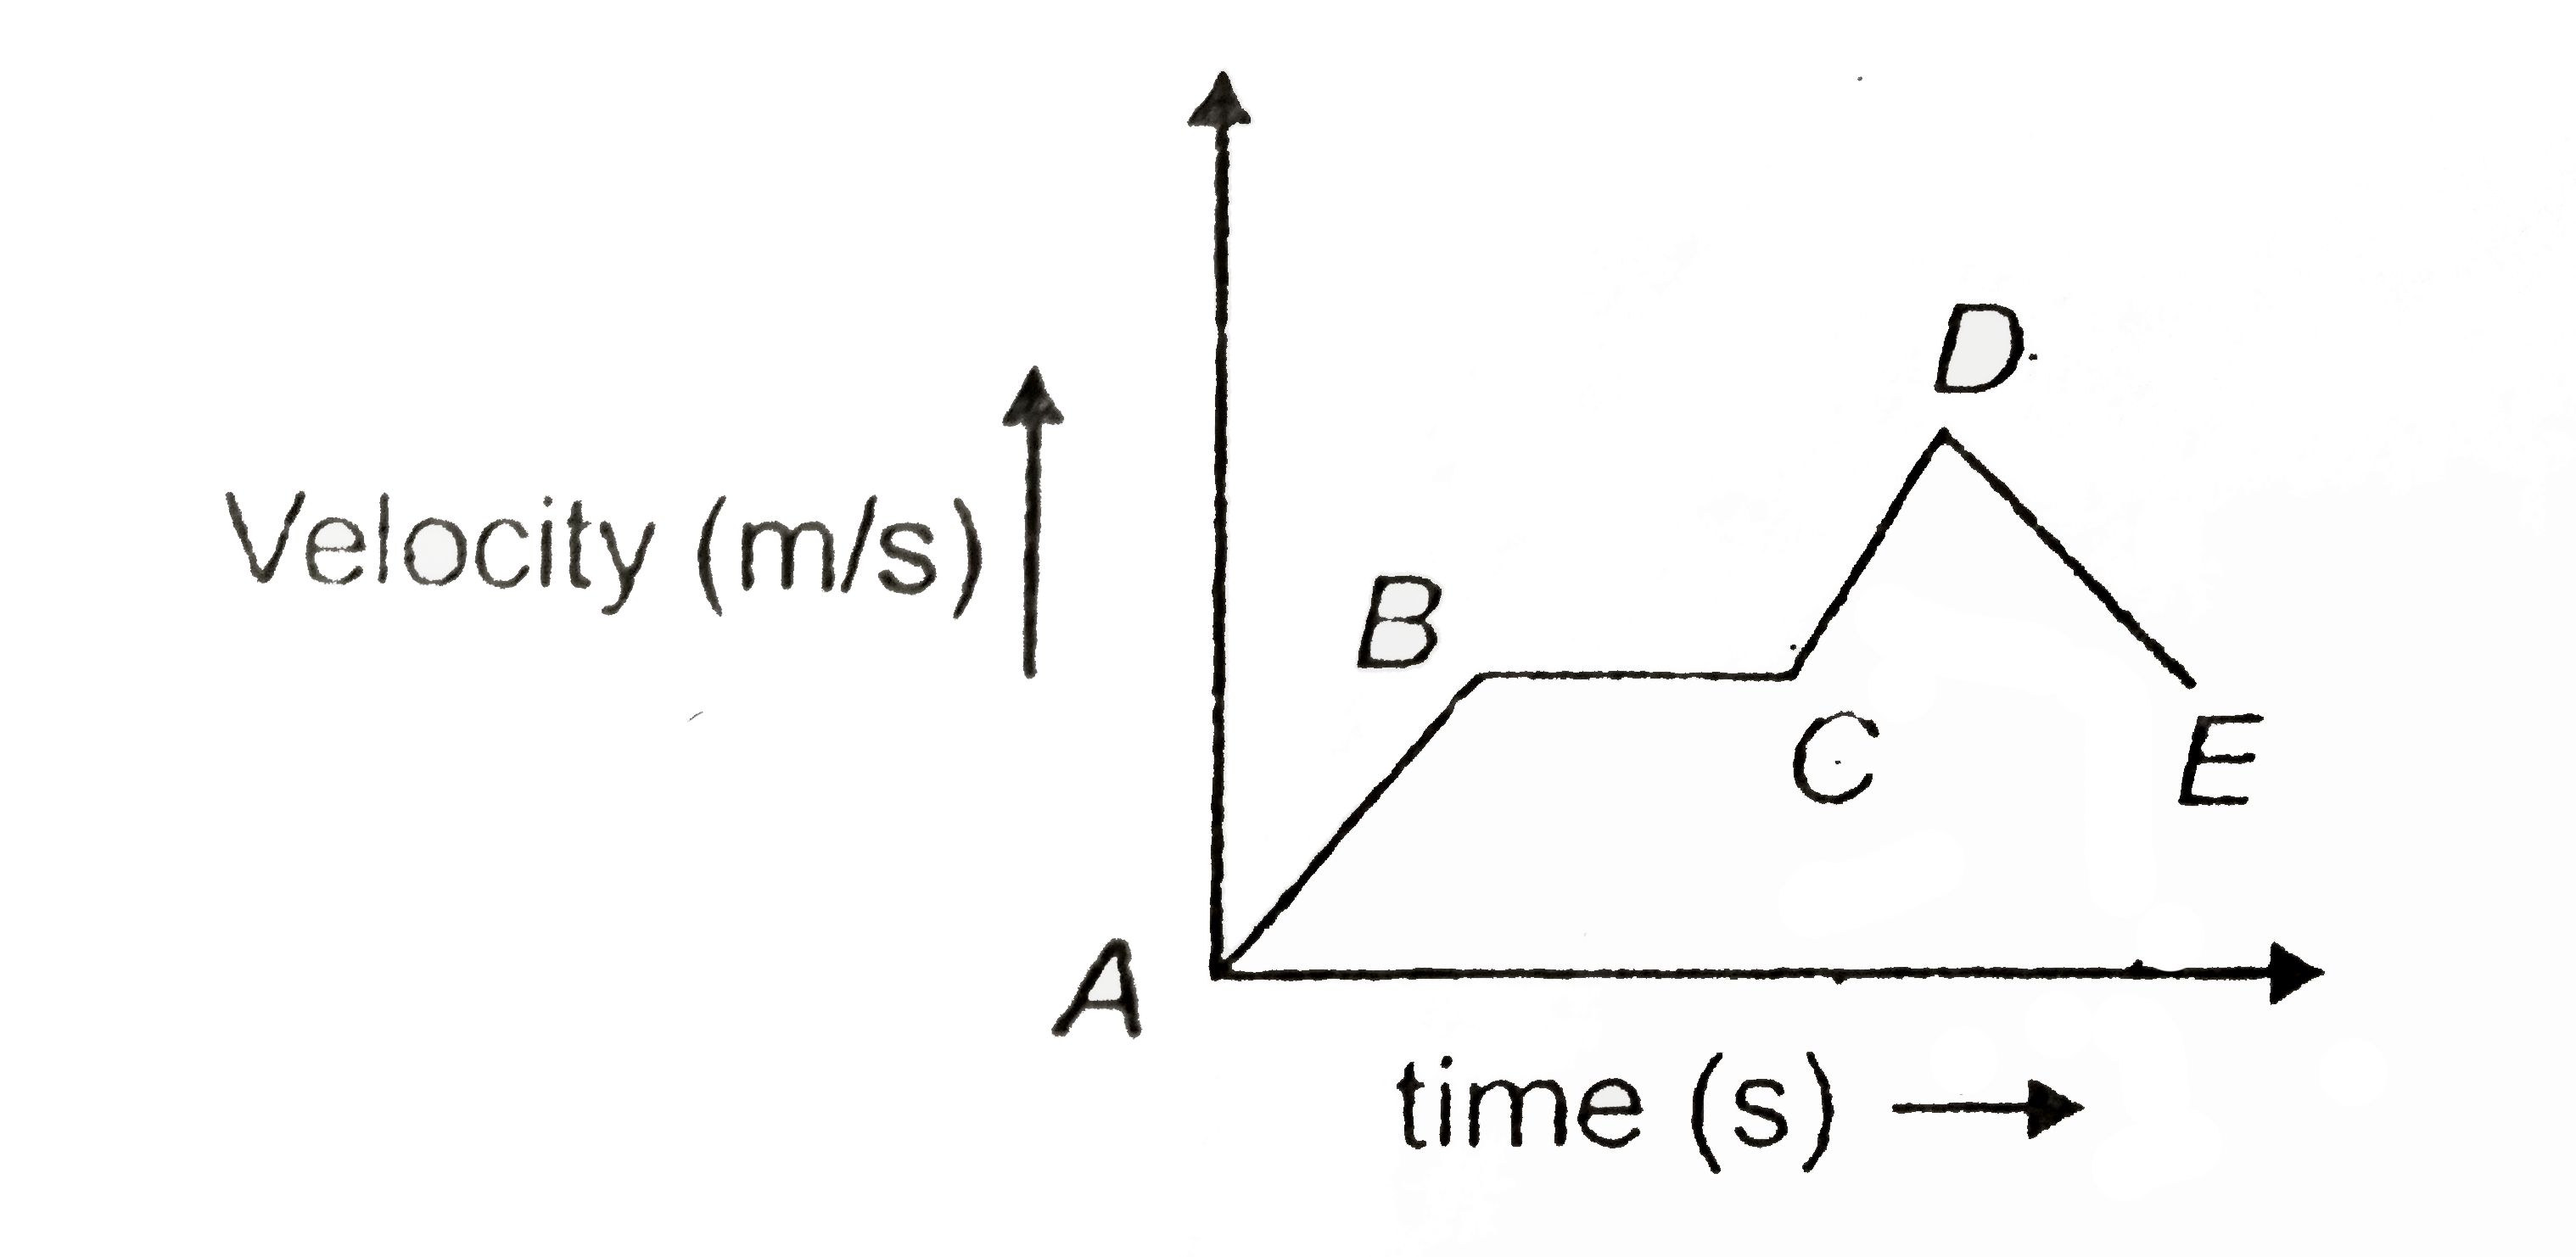
Which of the following graph represents the corresponding acceleration v//s time graph?View SolutionThe velocity-time graph of an object is shown below. The part of the graph showing zero acceleration is
 View Solution
