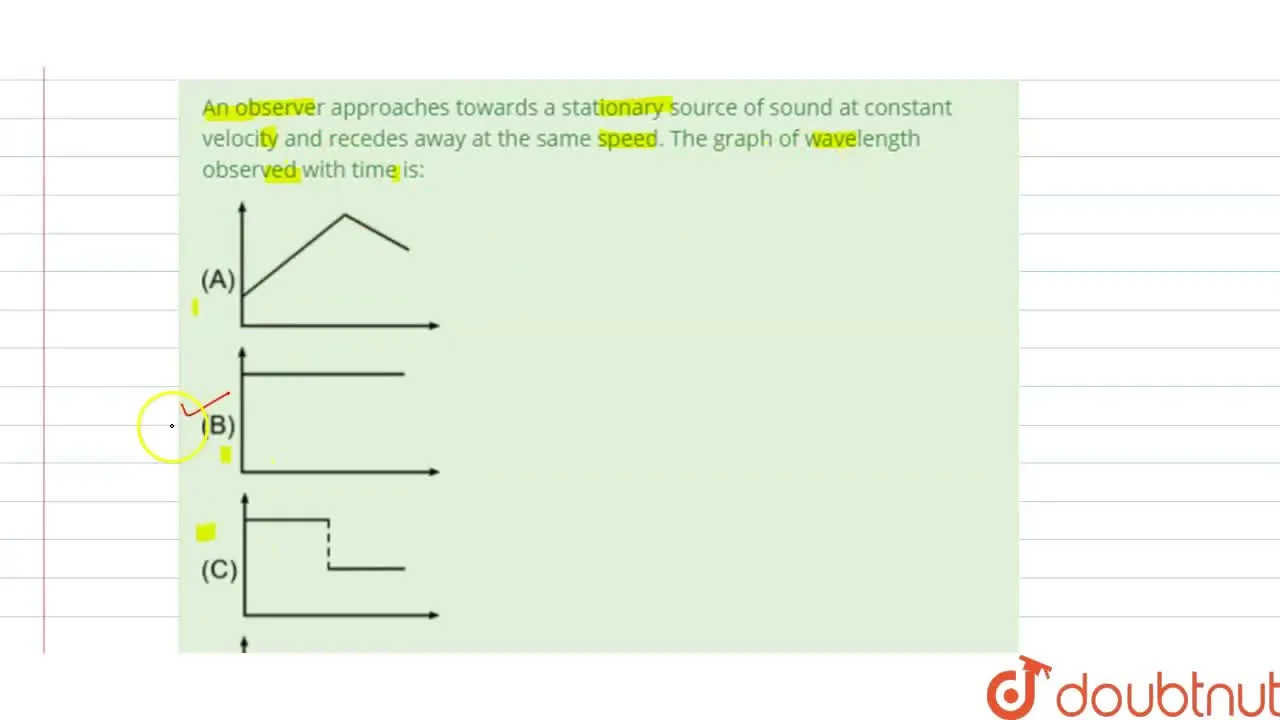
An observer approaches towards a stationary source of sound at constant velocity and recedes away at the same speed. The graph of wavelength observed with time is:
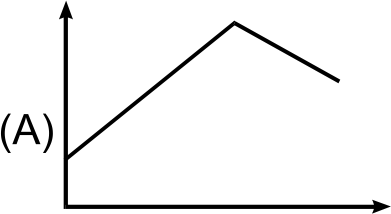
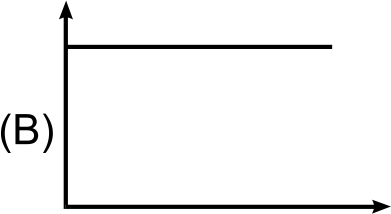
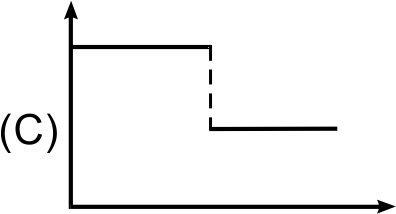
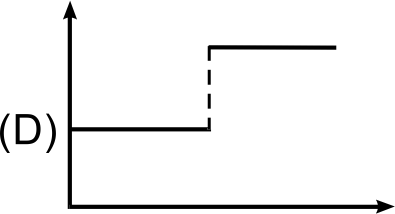
Wavelength remains same during approach and recede.
Related Playlists
Similar Questions
An observer moves towards a stationary source of sound. The percentage change in the apparent frequency is
View SolutionAn observer moves towards a stationary source of sound with a speed (15)th of the speed of sound. The wavelength and frequency of the source emitted are λ and f, respectively. The apparent frequency and wavelength recorded by the observer are, respectively.
View SolutionAn observer moves towards a stationary source of sound with a velocity one-fifth of the velocity of sound. What is the percentage increase in the apparent frequency?
View SolutionAn observer is approaching with a speed v , towards a stationary source emitting sound waves of wavelength λ0 . The wavelength shift detected by the observer is ( Take c= speed of sound )
View SolutionTo an observer, the pitch of a stationary source of sound appears to be reduced by 20%. If the speed of sound is 340m/s then speed and direction of the observer is
View SolutionA source of sound moves towards an observer
View SolutionA source of sound moves towards an observe.
View Solutionthe frequency changes by 10 % as the source approaches a stationary observer with constant speed vs. What would be the percentage change in frequency as the sources reaccedes the observer with the same speed ? Given , that vs<<v(v= speed pf sound in air )
View SolutionWhen the observer moves towards the stationary source with velocity, v1, the apparent frequency of emitted note is f1. When the observer moves away from the source with velocity v1, the apparent frequency is f2. If v is the velocity of sound in air and f1f2 = 2,then vv1 = ?
View SolutionAn observer moves with a constant acceleration towards a fixed source and start decelerating as soon as it passes the sound source. The variation of frequency f by observer with time t is best shown by
View Solution

