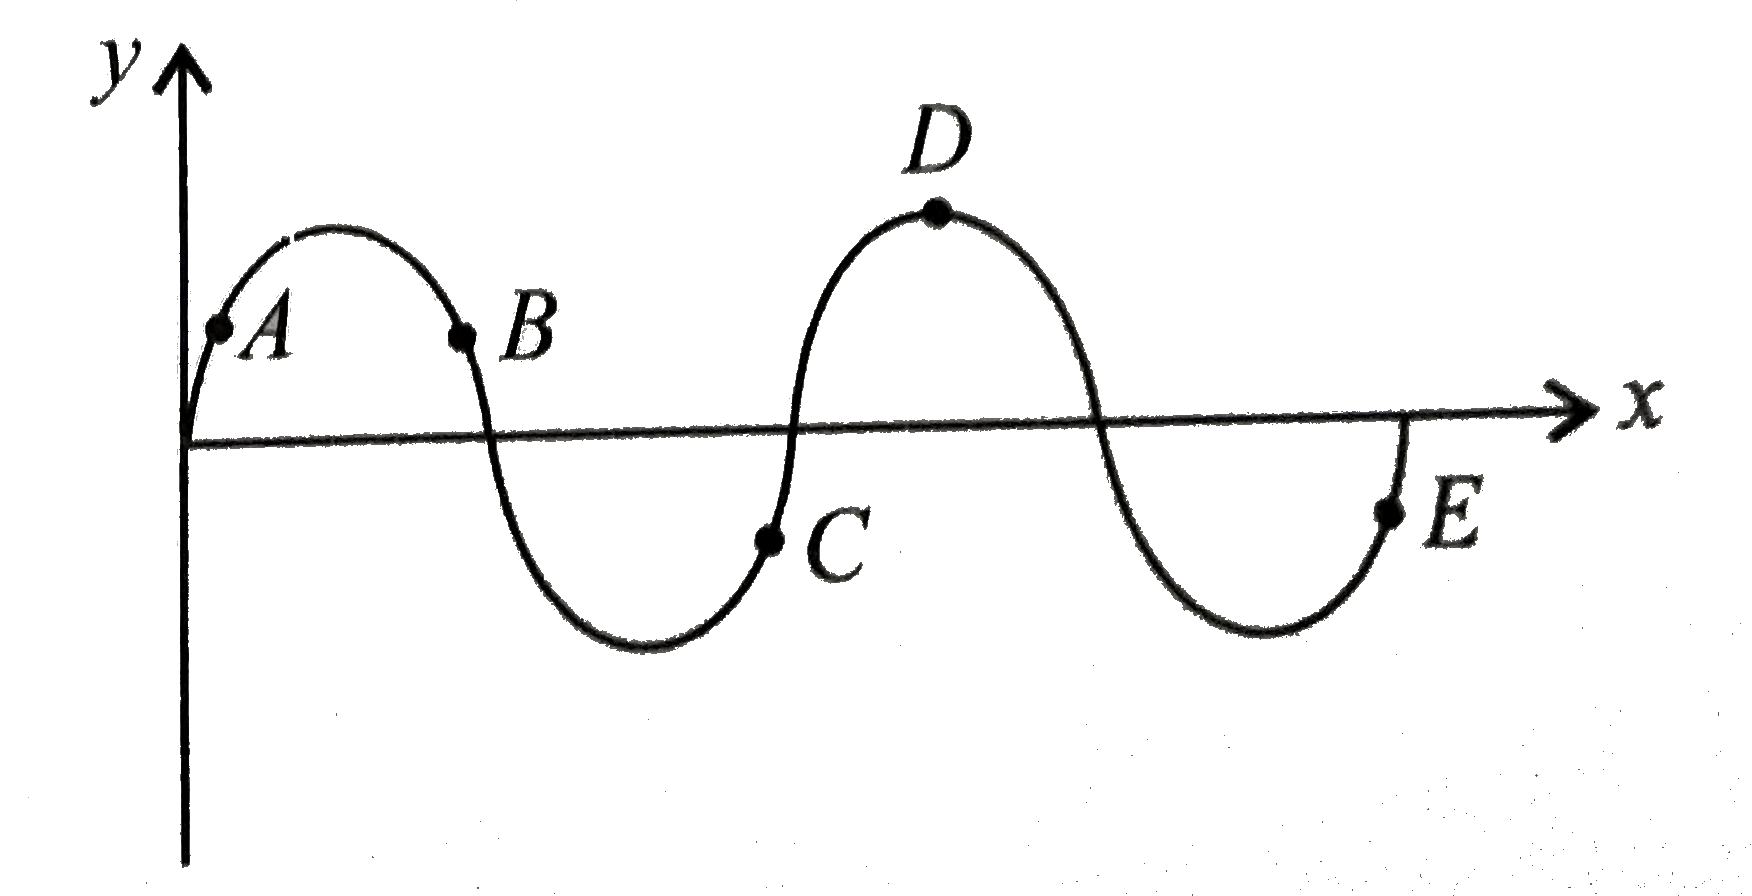
The diagram below (Fig. 15.13.1) show the propagation of a wave. Which points are in phase ?

A, B
B, C
B, D
E, B
The correct Answer is:D
Step by step video, text & image solution for The diagram below (Fig. 15.13.1) show the propagation of a wave. Which points are in phase ? by Physics experts to help you in doubts & scoring excellent marks in Class 11 exams.
Updated on:21/07/2023Topper's Solved these Questions
- COMPETITION CARE UNITBook:ICSEChapter:COMPETITION CARE UNITExercise:NDA EXAM QUESTIONS
Explore 55 Videos
- COMPETITION CARE UNITBook:ICSEChapter:COMPETITION CARE UNITExercise:OBJECTIVE QUESTIONS FROM PREVIOUS IAS EXAMINATIONS
Explore 50 Videos
- COMPETITION CARE UNITBook:ICSEChapter:COMPETITION CARE UNITExercise:OSCILLATIONS
Explore 23 Videos
- CIRCULAR MOTION Book:ICSEChapter:CIRCULAR MOTION Exercise:MODULE 2 (FROM ROTATIONAL KINETIC ENERGY , WORK ,POWER)
Explore 24 Videos
- DIMENSIONSBook:ICSEChapter:DIMENSIONSExercise:SELECTED PROBLEMS (FROM CONVERSIONS OF ONE SYSTEMS OF UNITS INTO ANOTHER)
Explore 9 Videos
Similar Questions
The diagram below in Fig. shows the arrangement of five different resistances connected to a battery of e.m.f. 1.8 V. Calculate :
the reading of ammeter A.
View SolutionThe diagram below in Fig. shows the arrangement of five different resistances connected to a battery of e.m.f. 1.8 V. Calculate :
the total resistance of the circuit,
View Solution
Knowledge Check
Figure shows a sinusoidal wave at a given instant.

Which points are in phase?AA,BBB,CCB,DDC,E
The diagram in Fig. shows a three-pin socket marked as 1, 2 and 3.

To which wire joined to 2 or 3, is the fuse connected ?
View SolutionUsing Huygen's construction, draw a figure showing the propagation of a plane wave reflecting at the interface of the two media. Show that the angle of incidene is equal to the angle of reflection.
View SolutionUsing Huygen's construction, draw a figure showing the propagation of a plane wave reflecting at the interface of the two media. Show that the angle of incidence is equal to the angle of reflection.
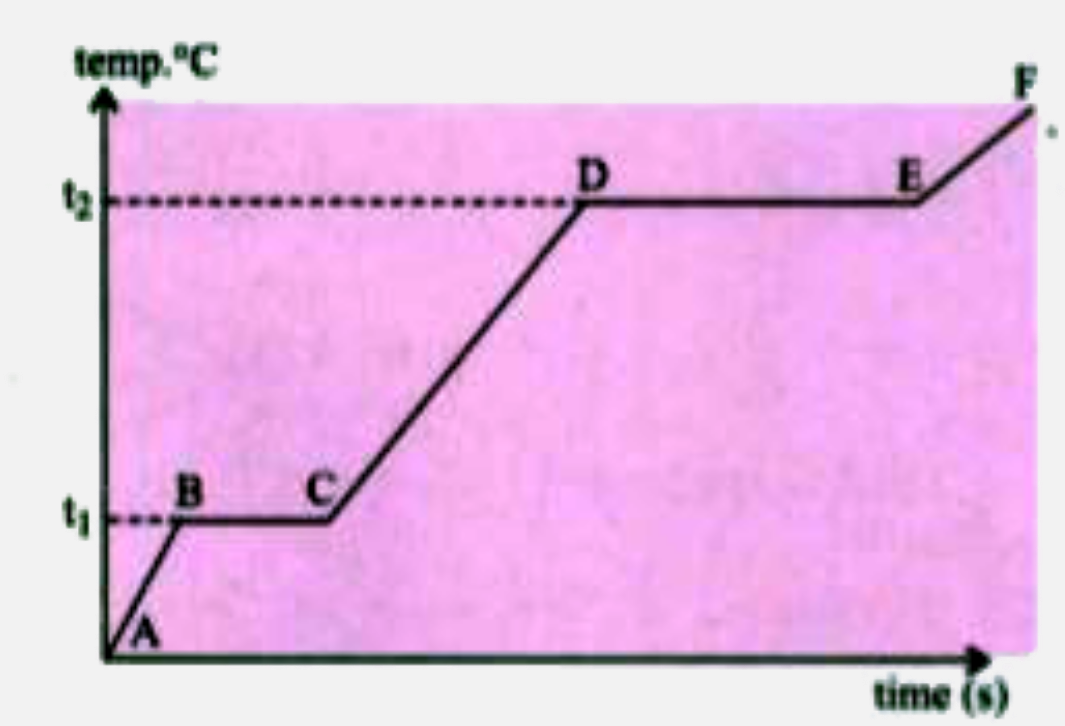
View SolutionThe diagram below shows the change of phases of a substance on a temperature vs time graph on heating the substance at a constant rate.

What is the boiling and melting point of the substance ?
View SolutionThe diagram given below (Fig.) shows a bulb connected with a cell having terminals A and B. Mark the direction of current in the bulb.
View SolutionThe diagram in Fig. 11.8 below shows the change of phases of a substance on a temperature-time graph on heating the substances at a constant rate.
(a) What do the parts AB, BC, CD and DE represent?
(b) What is the melting point of the substance ?
(c) What is the boiling point of the substance ?
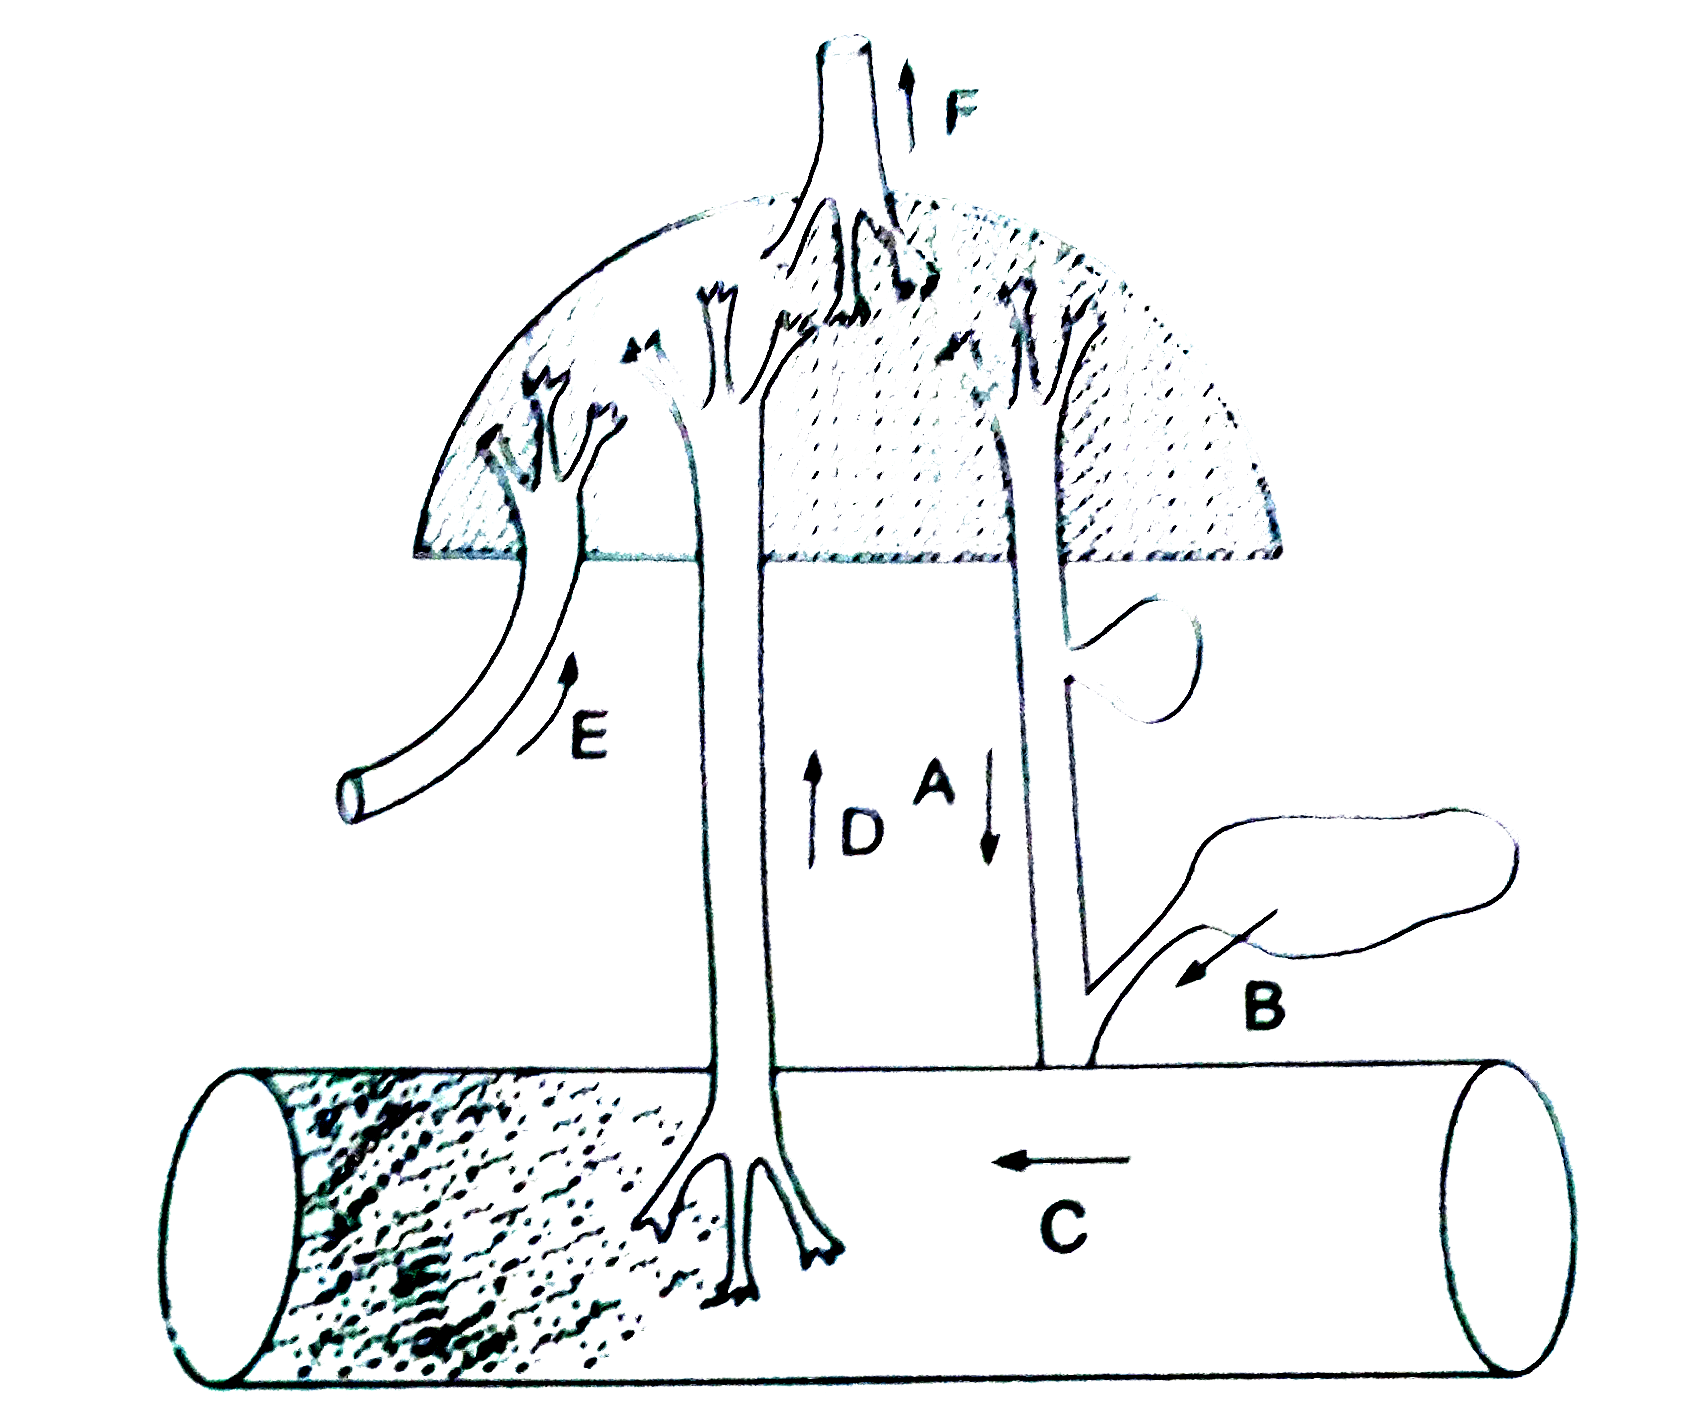
View SolutionThe diagram given below [Fig] shows how things get to and from the liver. They are labelled as A, B, C, D, E and F. Which one of the following labellings is correct

Choose the correct option
View Solution

