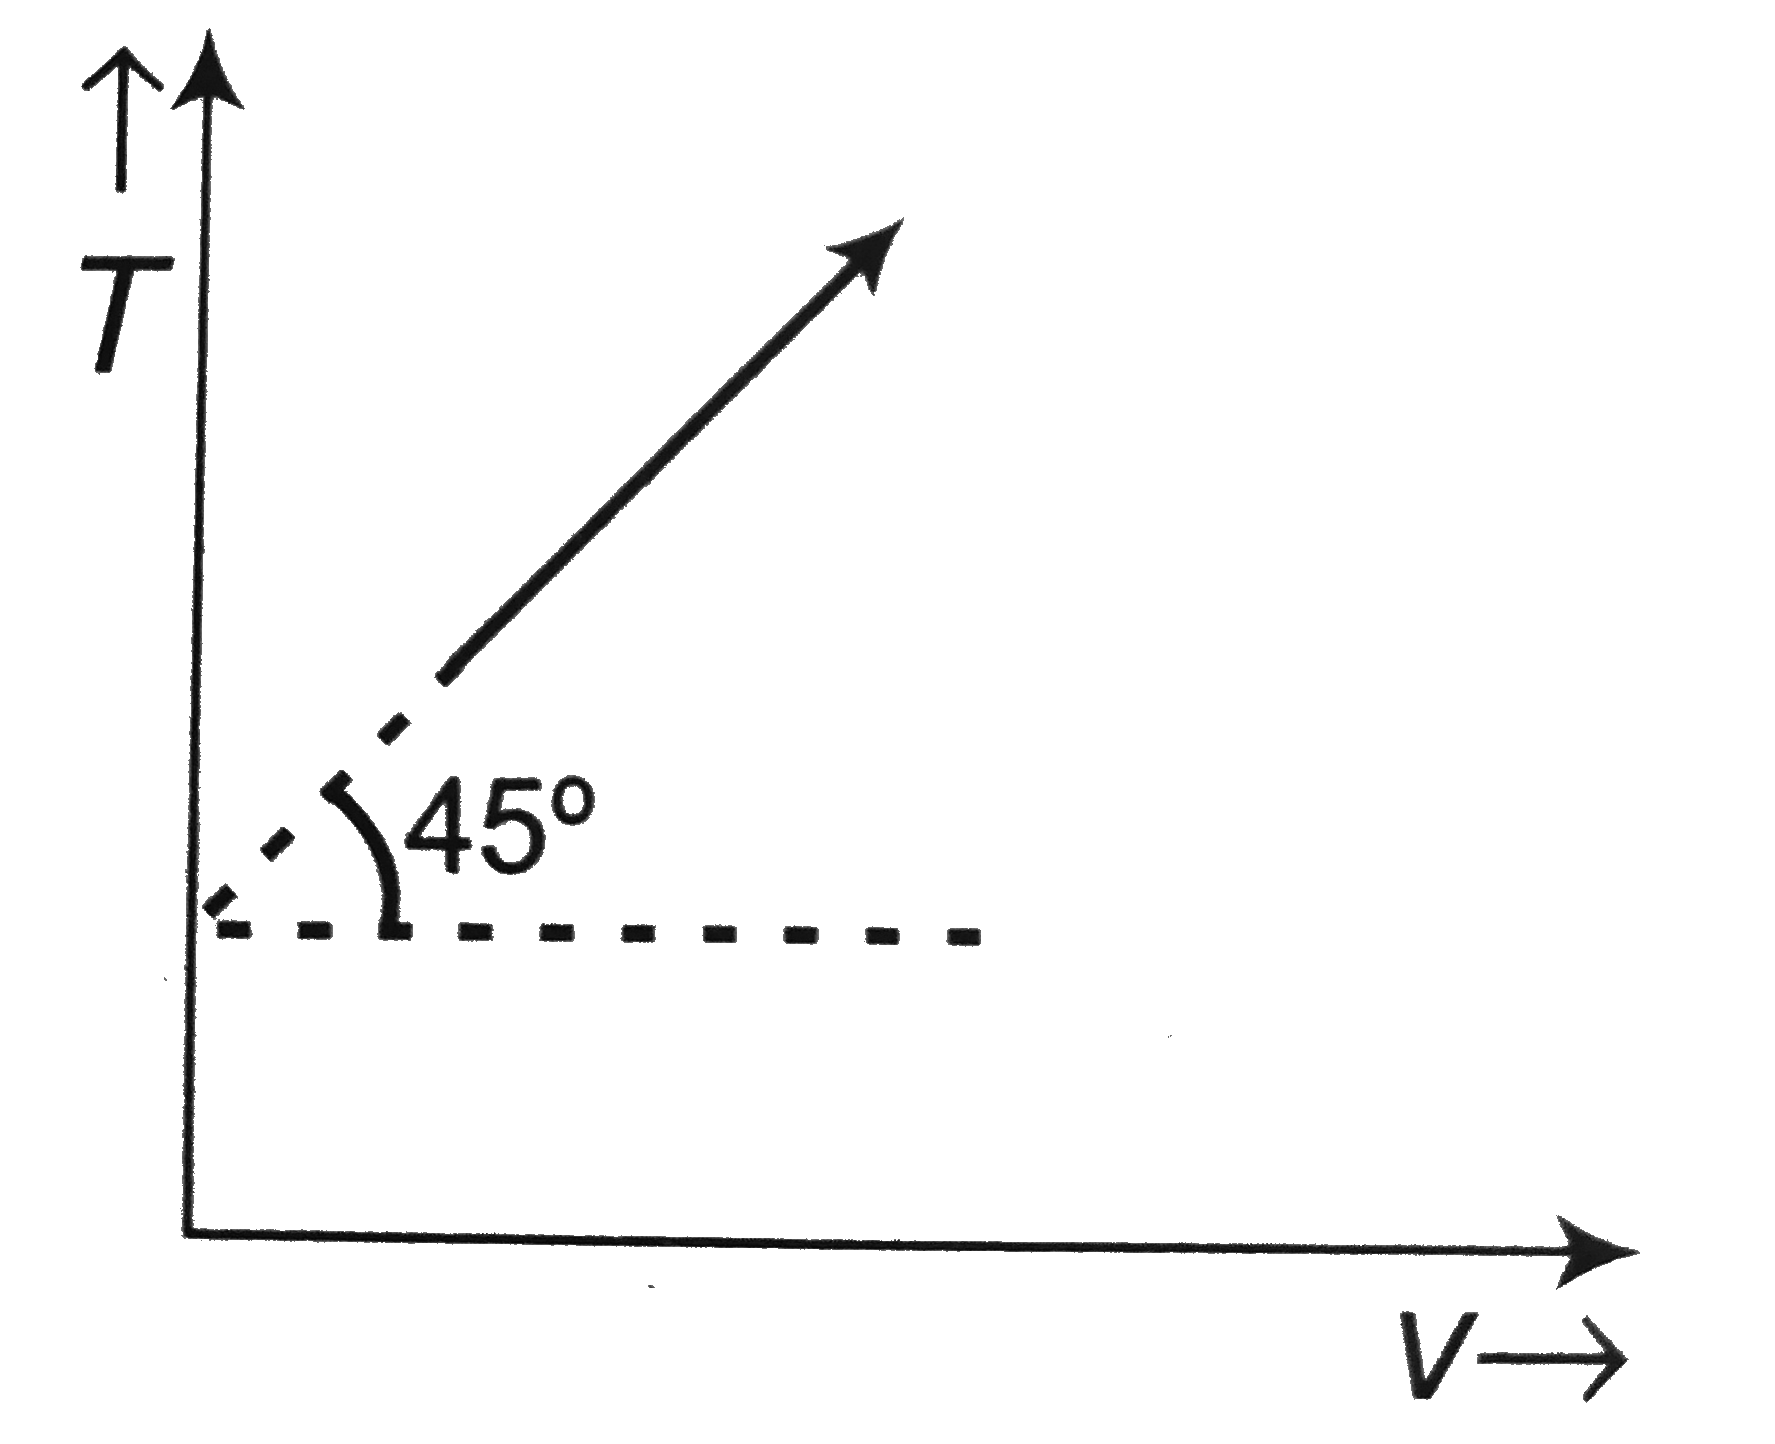
The given curve represents the variation of temperature as a function of volume for one mole of an ideal gas. Which of the following curves best represents the variation of pressure as a function of volume?
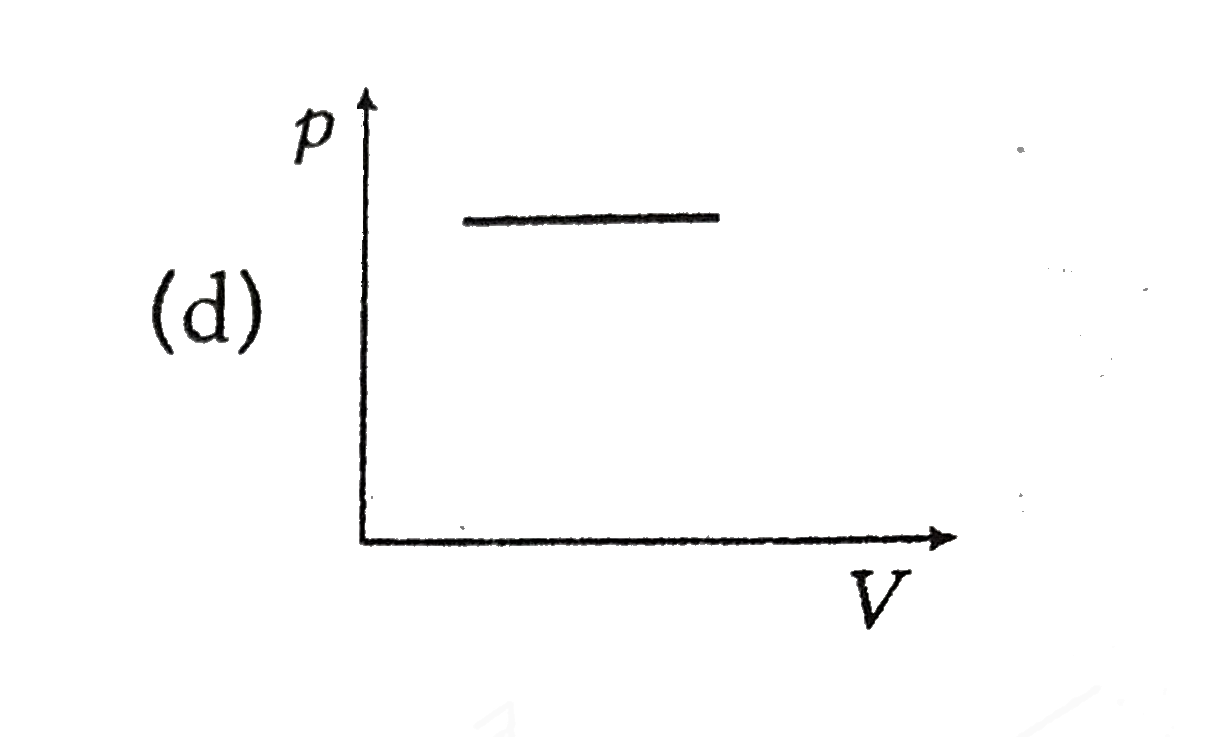
The correct Answer is:A
Slope o line is 1. Therefore T-V equation can be written as
T=V+To
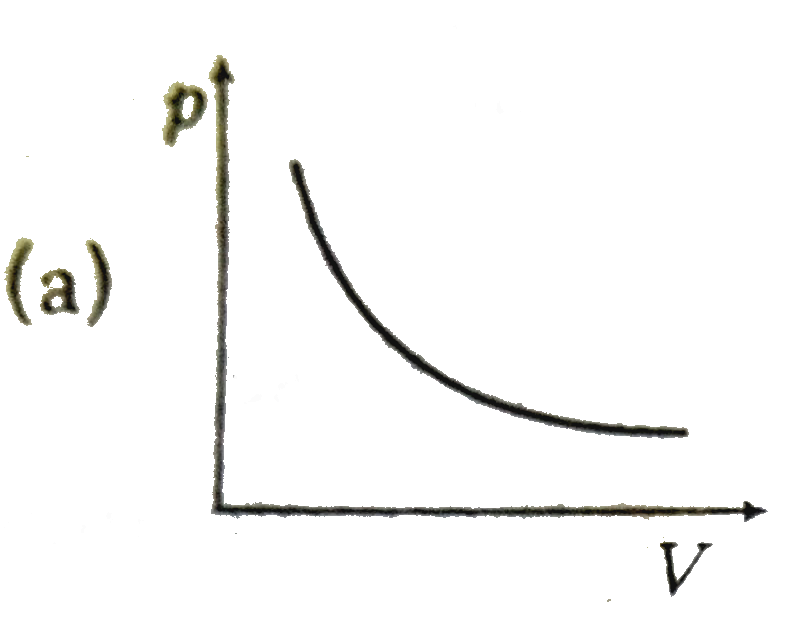
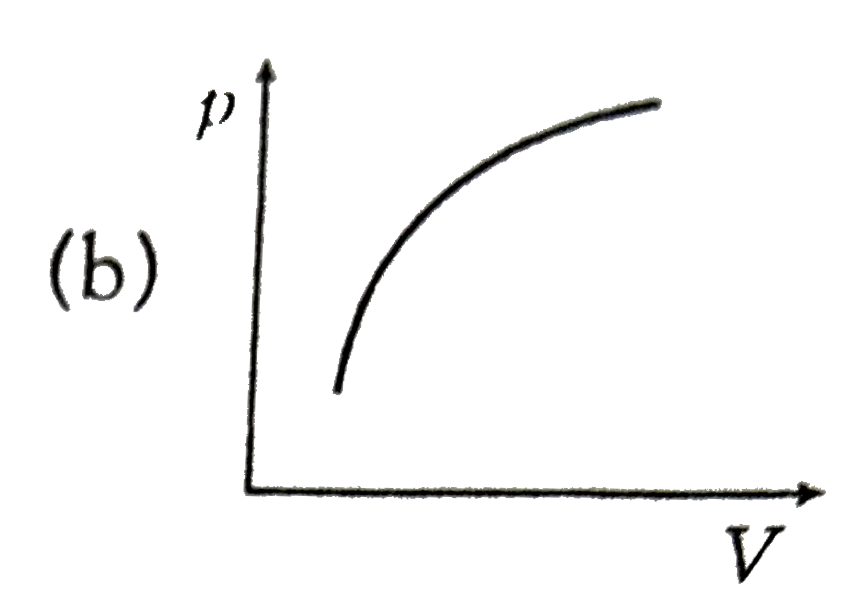
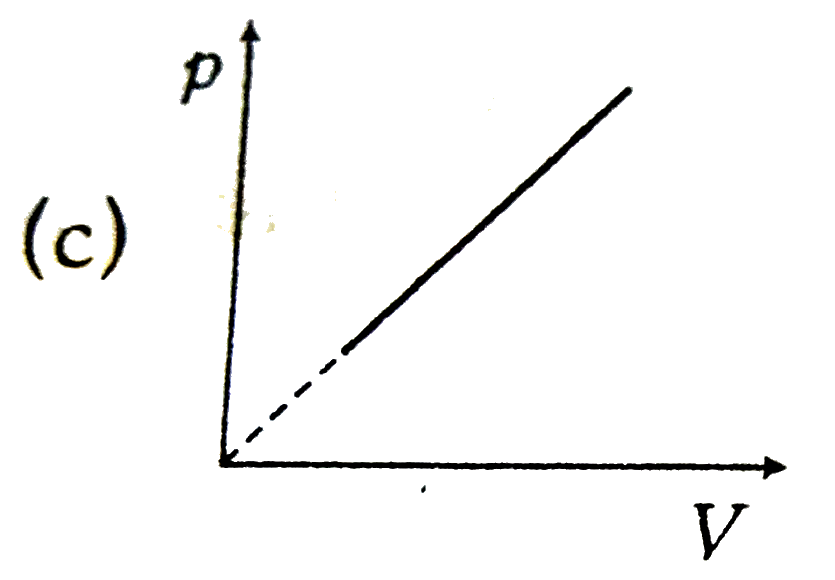
∴ pVnR=V+To∴p=(nR)+nRToV
∴ P versus V graph is a sort of rectangular hyperbole.
Topper's Solved these Questions
- THERMOMETRY THERMAL EXPANSION AND KINETIC THEORY OF GASESBOOK - DC PANDEY ENGLISHCHAPTER - THERMOMETRY THERMAL EXPANSION AND KINETIC THEORY OF GASESEXERCISE - B medical entrance special format questions
14 Videos
- THERMOMETRY THERMAL EXPANSION AND KINETIC THEORY OF GASESBOOK - DC PANDEY ENGLISHCHAPTER - THERMOMETRY THERMAL EXPANSION AND KINETIC THEORY OF GASESEXERCISE - Match the columns
5 Videos
- THERMOMETRY THERMAL EXPANSION AND KINETIC THEORY OF GASESBOOK - DC PANDEY ENGLISHCHAPTER - THERMOMETRY THERMAL EXPANSION AND KINETIC THEORY OF GASESEXERCISE - Check point 14.4
25 Videos
- SUPERPOSITION OF WAVESBOOK - DC PANDEY ENGLISHCHAPTER - SUPERPOSITION OF WAVESEXERCISE - Level 2 Subjective
8 Videos
- THERMOMETRY,THERMAL EXPANSION & KINETIC THEORY OF GASESBOOK - DC PANDEY ENGLISHCHAPTER - THERMOMETRY,THERMAL EXPANSION & KINETIC THEORY OF GASESEXERCISE - Level 2 Subjective
9 Videos
Similar Questions
Which of the following P-V curve best represents. As isothermal process?
View SolutionWhich of the following graphs best represents the variation of acceleration 'a' with displacement x?
View SolutionWhich of the following curve represent variation of density of water with temperature best-
View SolutionWhich of the following curve represents the variation of λM with √C for AgNO3?
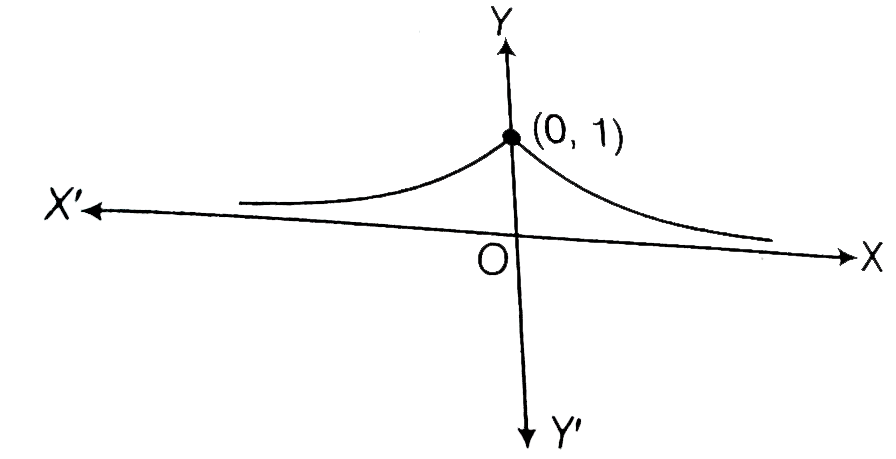
View SolutionWhich one of the following function best represents the graphs as shown below?
View SolutionA train is moving towards a stationary observer. Which of the following curve best represents the frequency recived by observer f as a function of time?
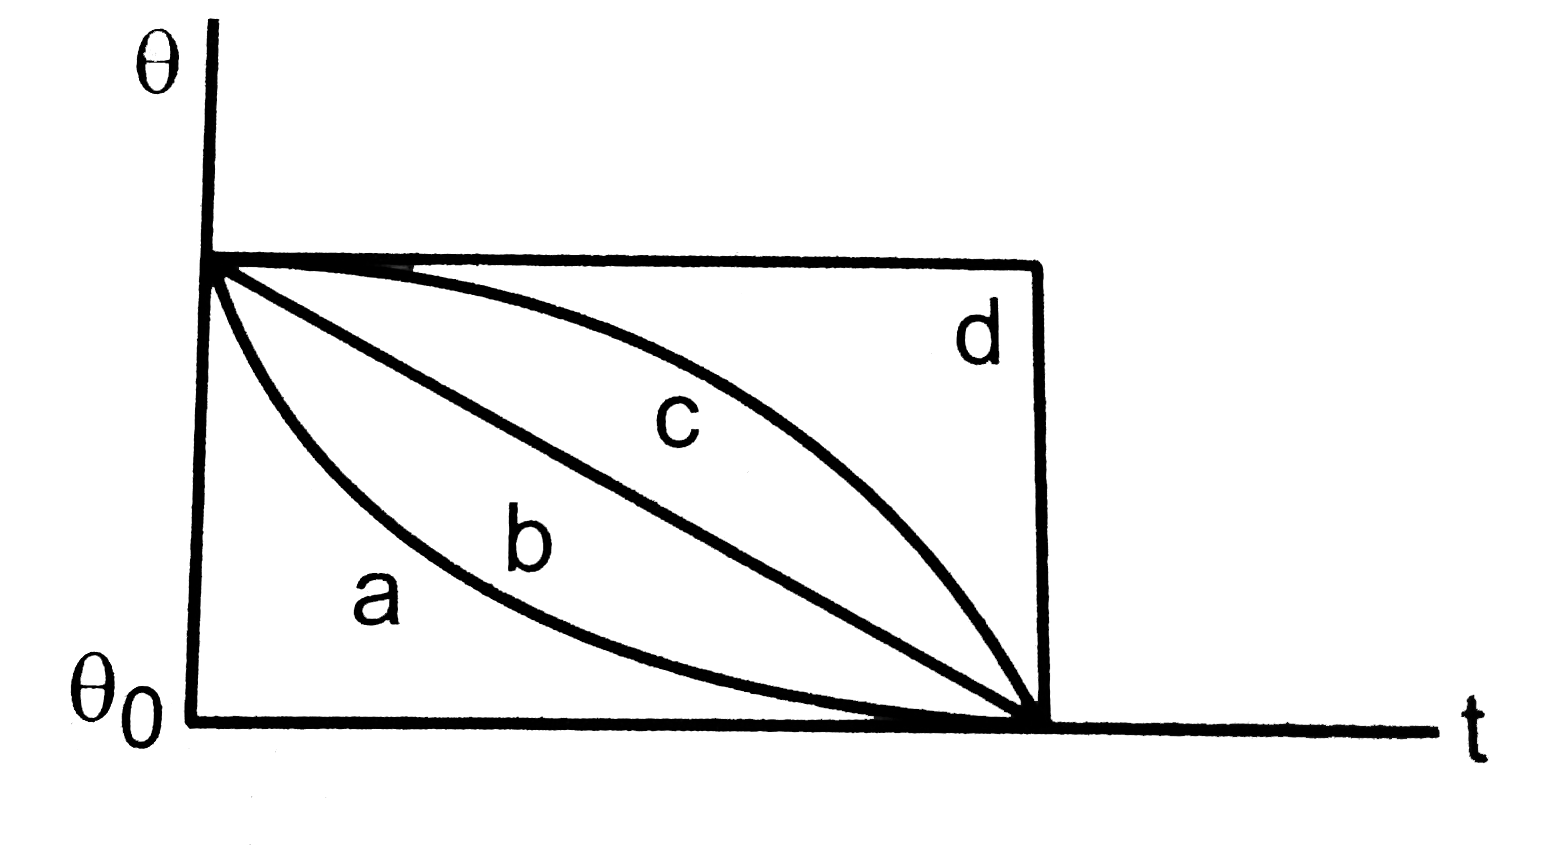
View SolutionA hot liquid is kept in a big room. Its temperature is plotted as a function of time. Which of the following curves may represent the plot?
View SolutionThe graph shown the variation with times t of the velocity v of an object . Which one of the following graphs best represents the variation of acceleration a of the object with time t?

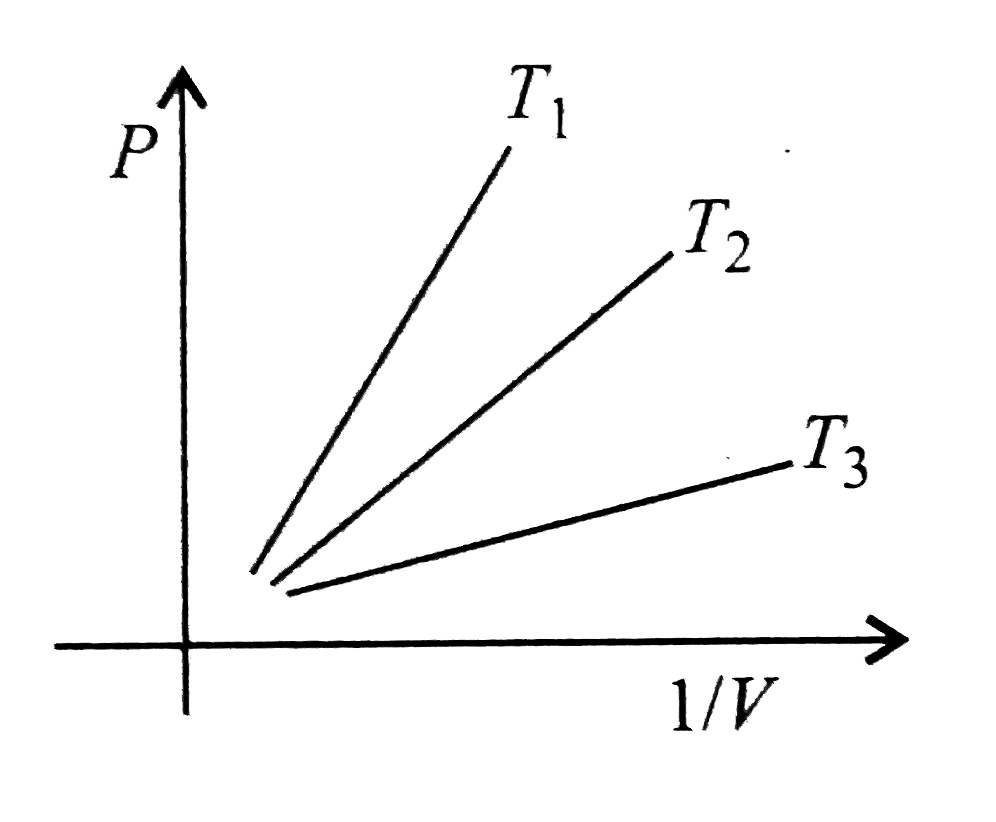
View SolutionThe curve drawn below shows the variations of P as a function of 1/V for a fixed mass and temperature of an ideal gas. It follows from the curve that:
View SolutionWhich of the following curve is correct for a given amount of an ideal gas at constant pressure?
View Solution
