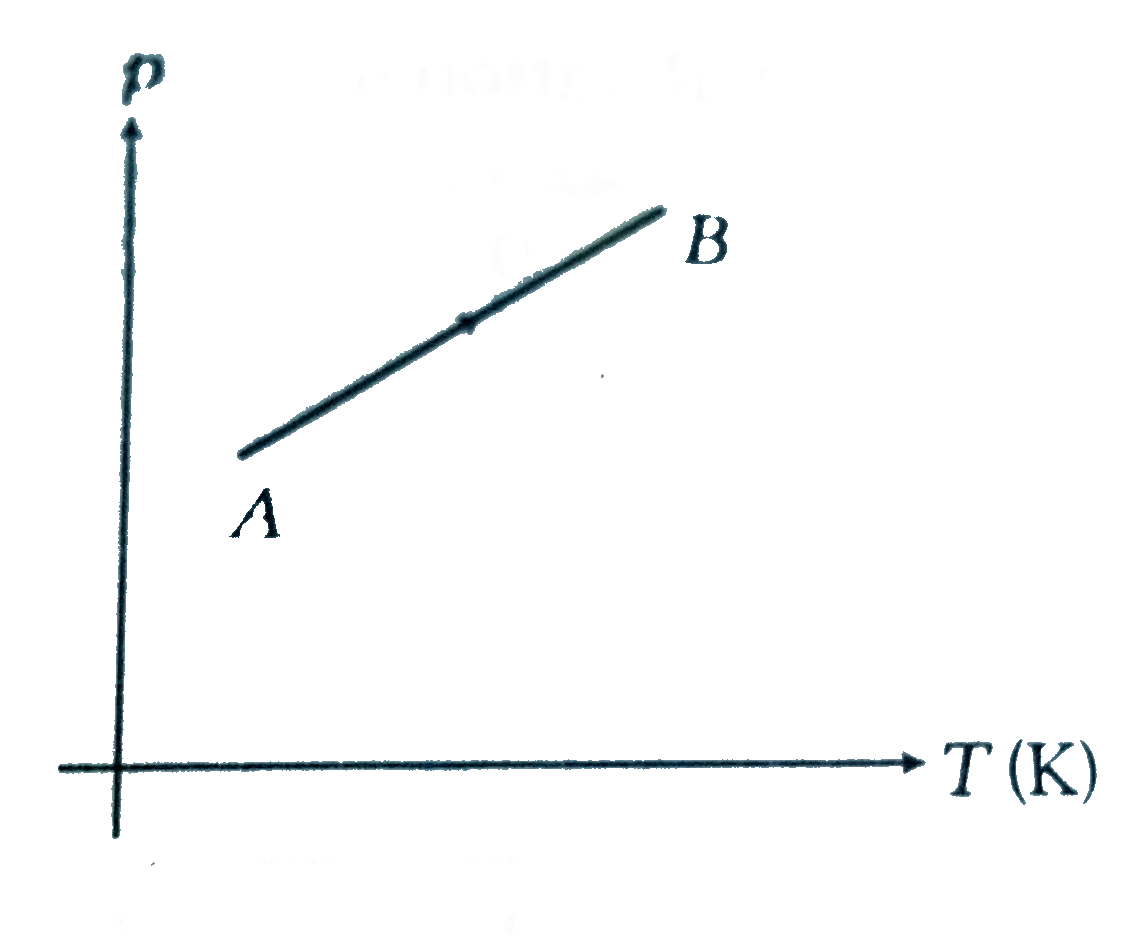
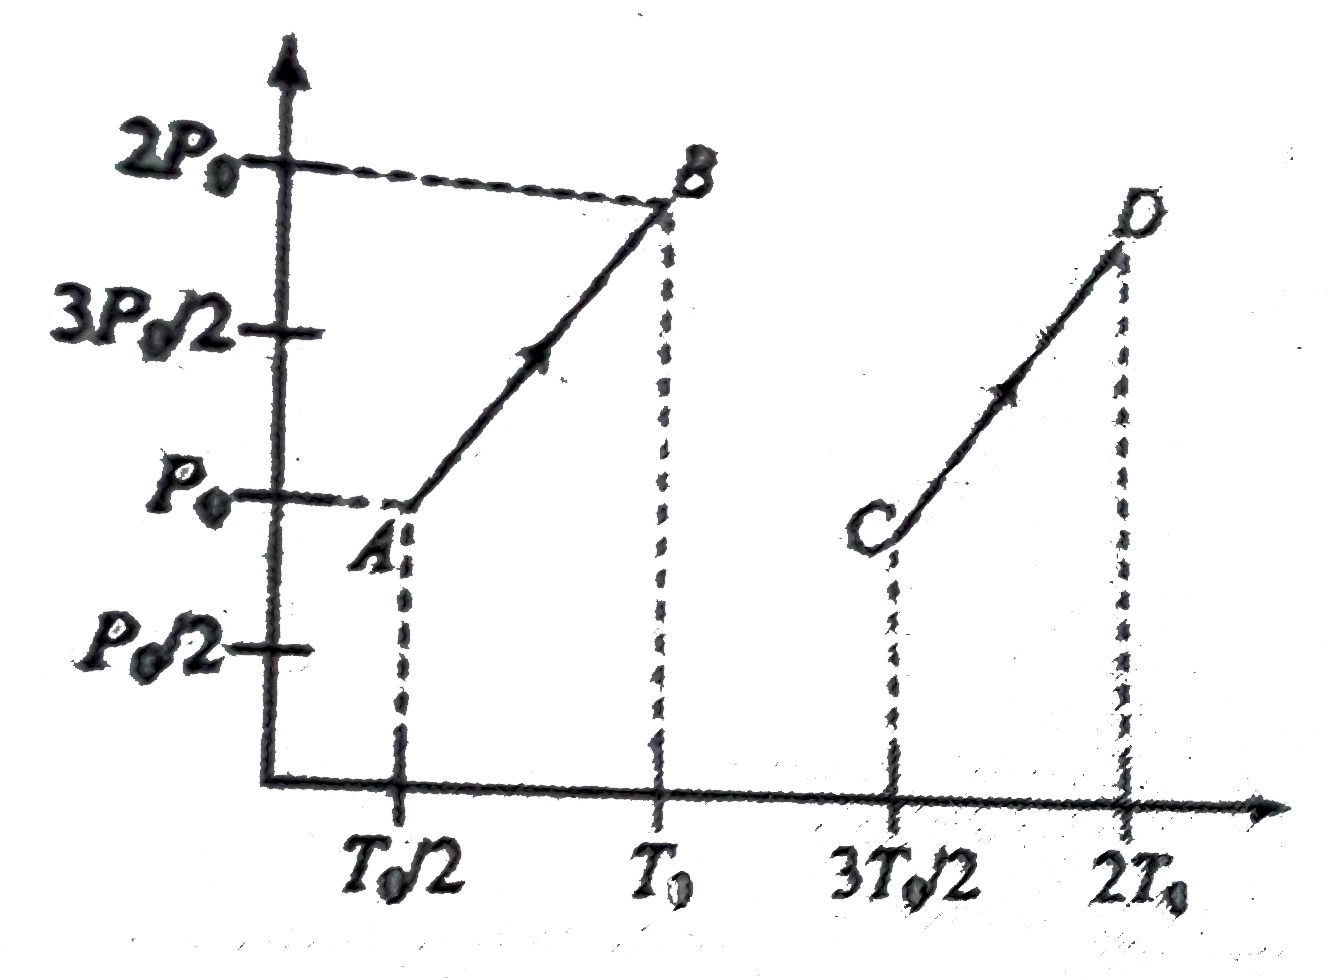
The p-T graph for the given mass of an ideal gas is shown in figure. What inference can be drawn regarding the change in volume (whether it is constant, increasing or decreasing) ?
remained constant
decreased
increased
changed erratically
The correct Answer is:C
p-T equation from the graph should be like.
p= aT +b (a and b are positive constants )
∴ pT=a+bT⇒T2>T1
∴ (pR)2>(pT)1or(Tp)2>(Tp)1
or ∴ V2>V1asV∝Yp
Topper's Solved these Questions
- THERMOMETRY THERMAL EXPANSION AND KINETIC THEORY OF GASESBOOK - DC PANDEY ENGLISHCHAPTER - THERMOMETRY THERMAL EXPANSION AND KINETIC THEORY OF GASESEXERCISE - B medical entrance special format questions
14 Videos
- THERMOMETRY THERMAL EXPANSION AND KINETIC THEORY OF GASESBOOK - DC PANDEY ENGLISHCHAPTER - THERMOMETRY THERMAL EXPANSION AND KINETIC THEORY OF GASESEXERCISE - Match the columns
5 Videos
- THERMOMETRY THERMAL EXPANSION AND KINETIC THEORY OF GASESBOOK - DC PANDEY ENGLISHCHAPTER - THERMOMETRY THERMAL EXPANSION AND KINETIC THEORY OF GASESEXERCISE - Check point 14.4
25 Videos
- SUPERPOSITION OF WAVESBOOK - DC PANDEY ENGLISHCHAPTER - SUPERPOSITION OF WAVESEXERCISE - Level 2 Subjective
8 Videos
- THERMOMETRY,THERMAL EXPANSION & KINETIC THEORY OF GASESBOOK - DC PANDEY ENGLISHCHAPTER - THERMOMETRY,THERMAL EXPANSION & KINETIC THEORY OF GASESEXERCISE - Level 2 Subjective
9 Videos
Similar Questions
The p−T graph for the given mass of an ideal gas is shown in figure. What inference can be drawn regarding the change in Volume (whtherit is constant, increasing or decreasing) ?
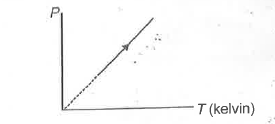
View SolutionThe graph of pressure and temperature for an ideal gas is as shown in figure. The given process is
View Solution
Knowledge Check
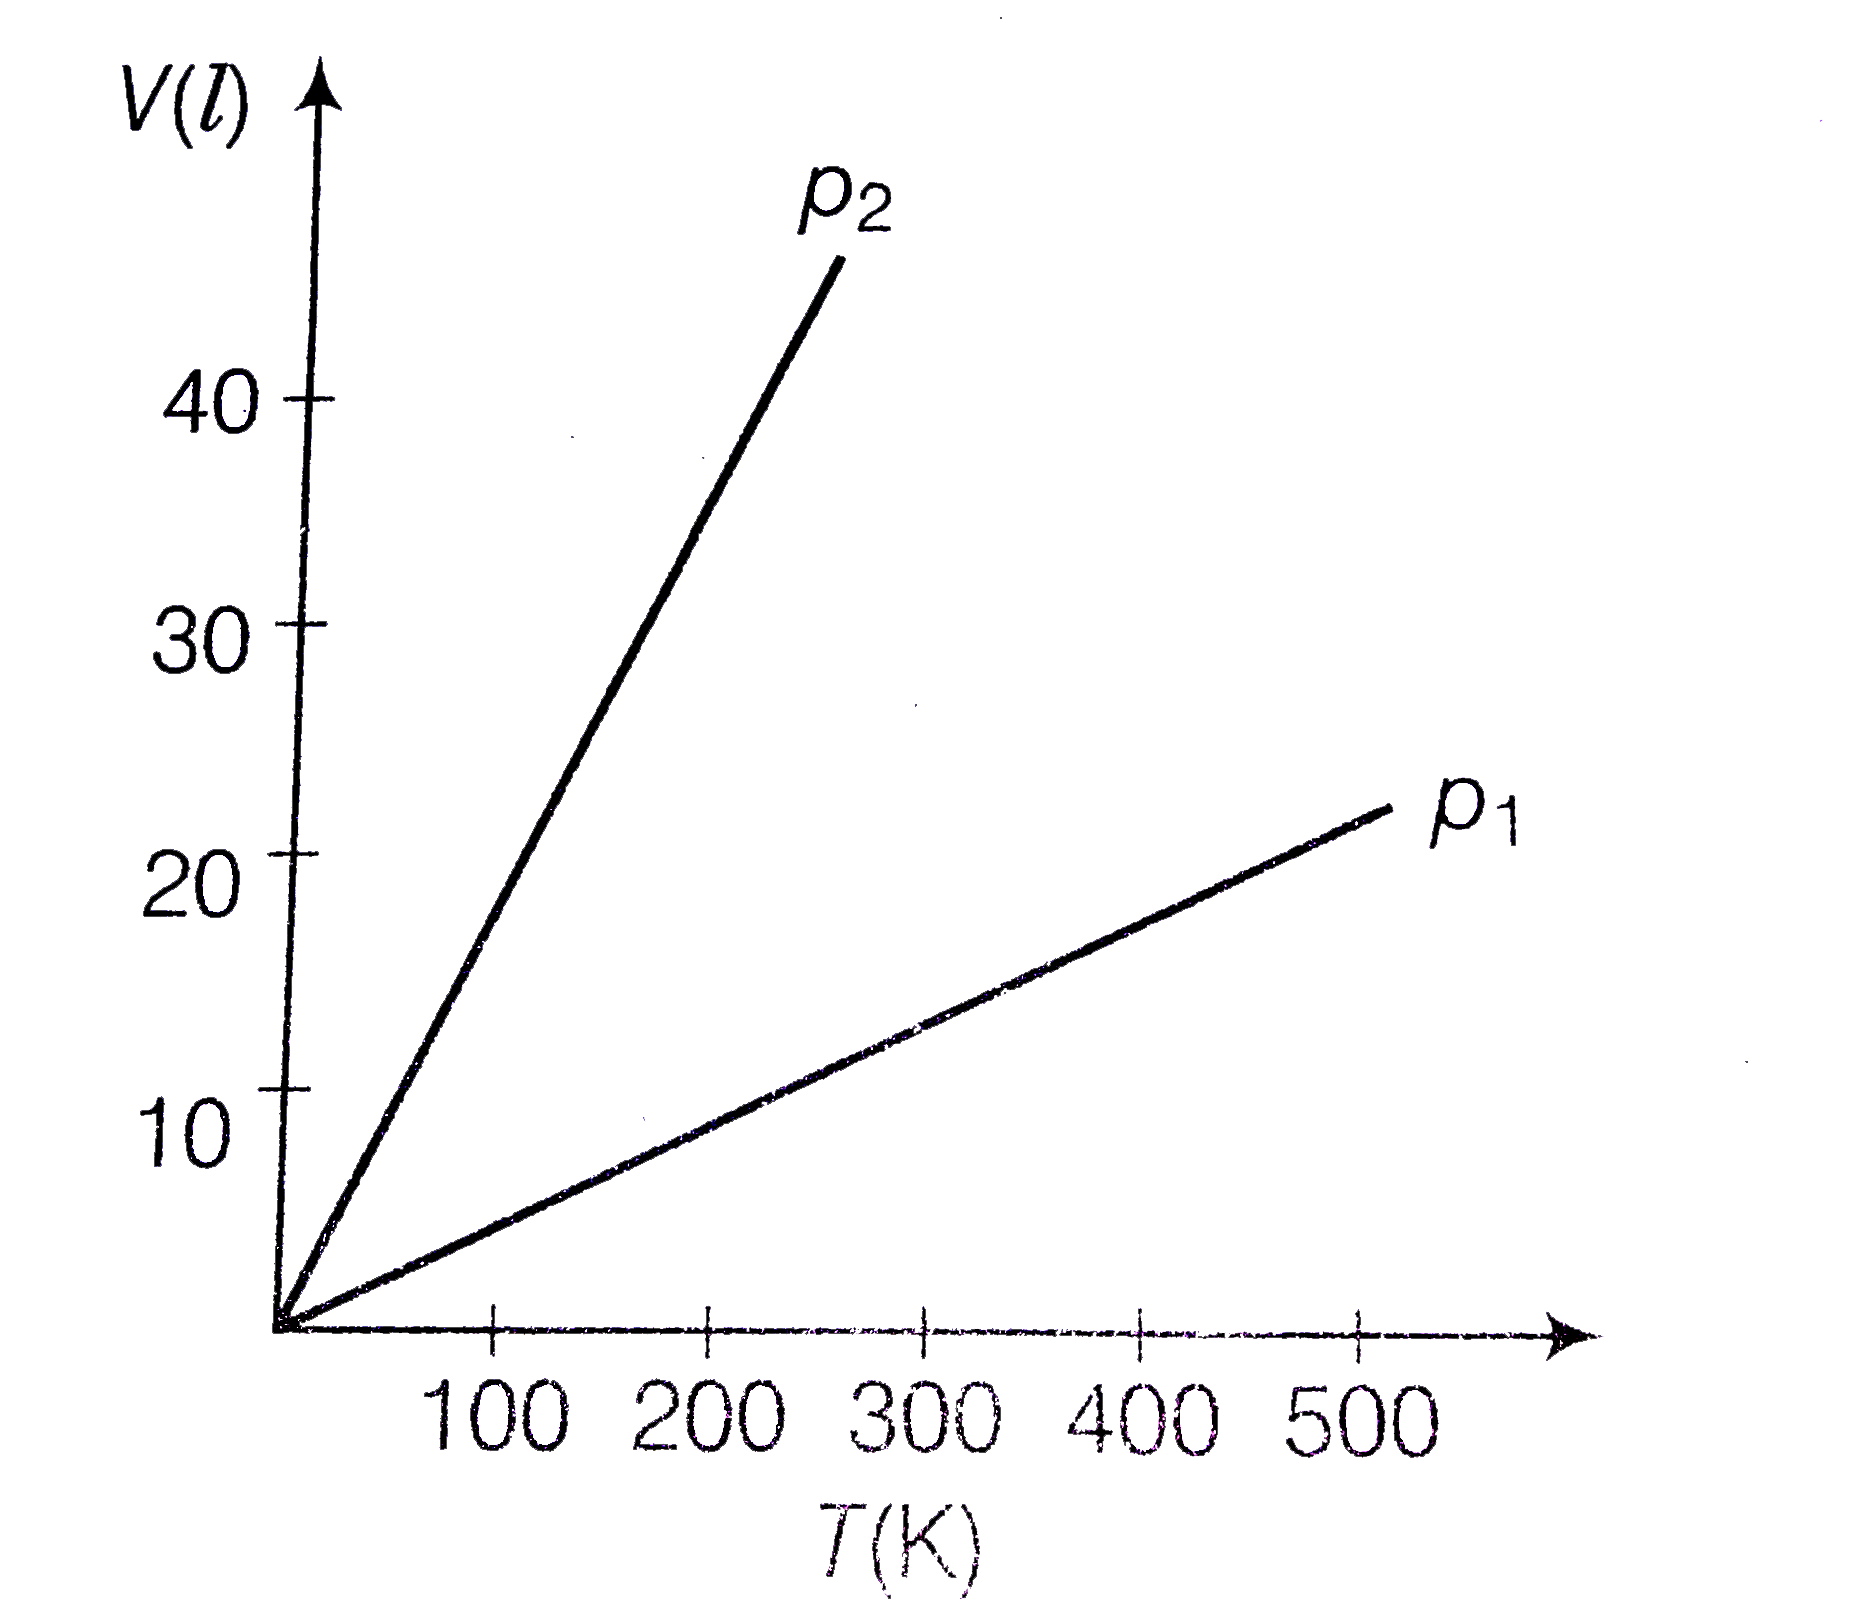
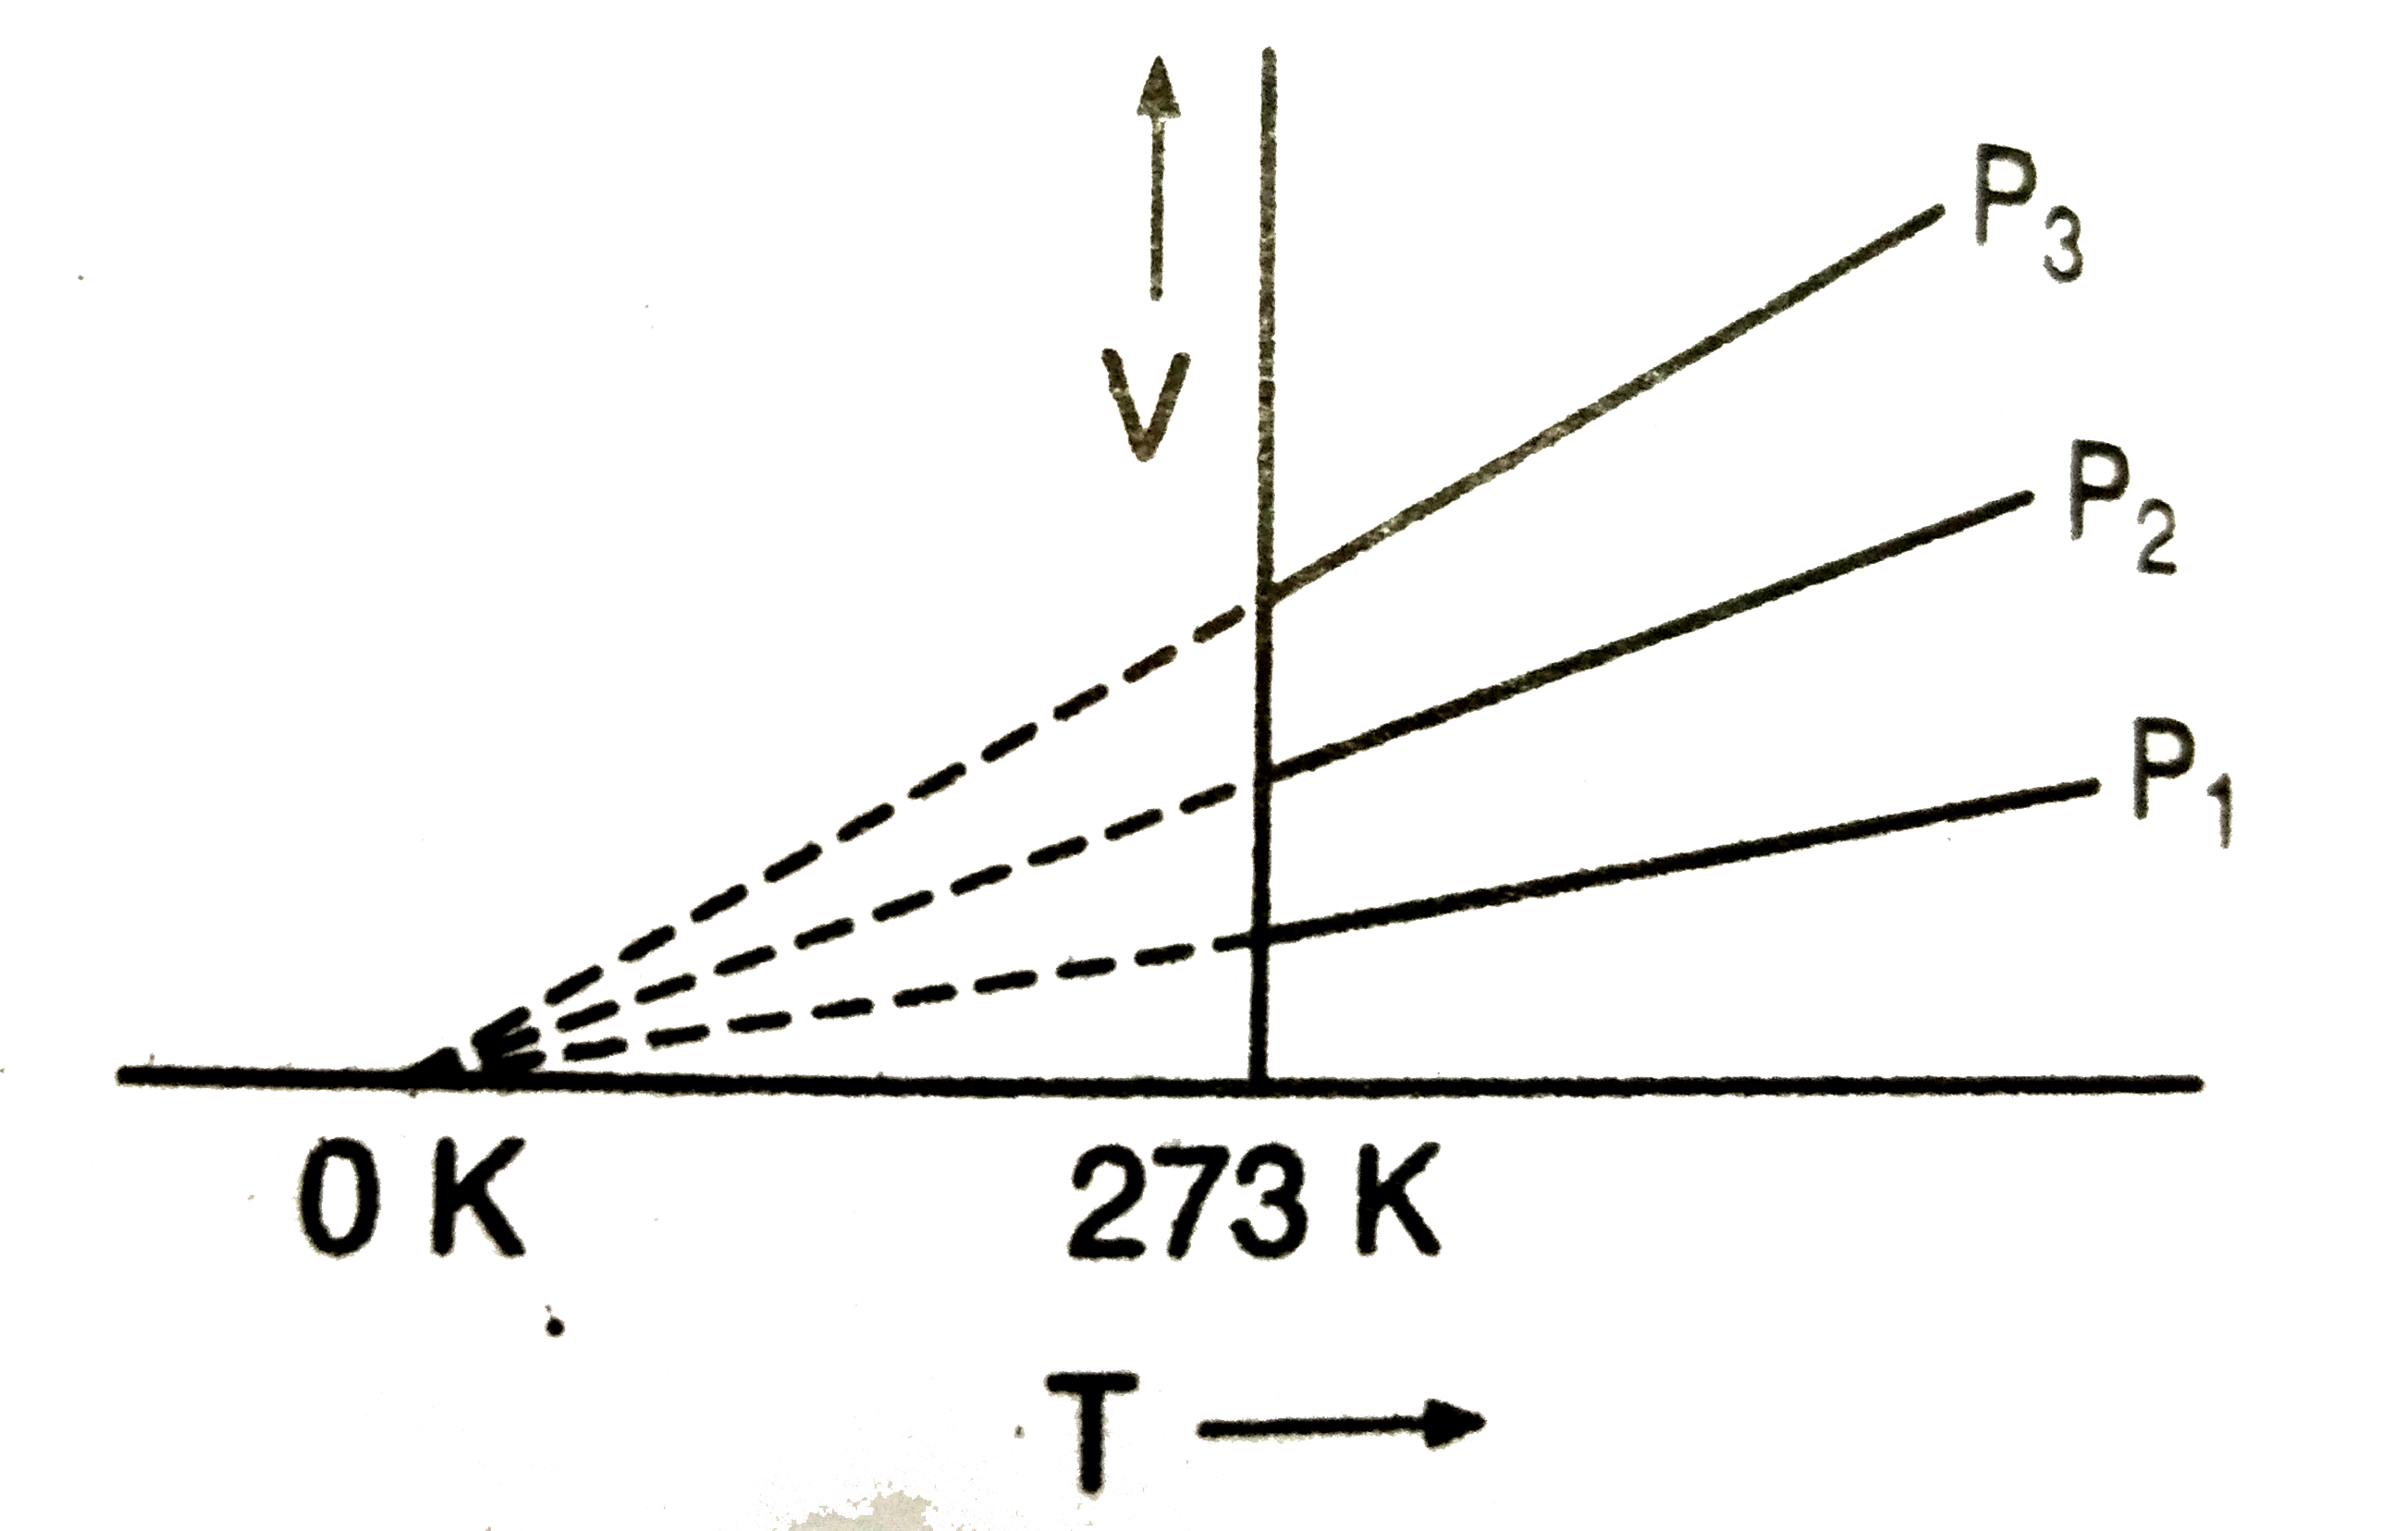
Volume versus temperature graphs for a given mass of an ideal gas are shown in figure. At two different values of constant pressure. What can be inferred about relation between P1 and P2 ?
 AP1>P2BP1=P2CP1<P2Ddata is insufficient
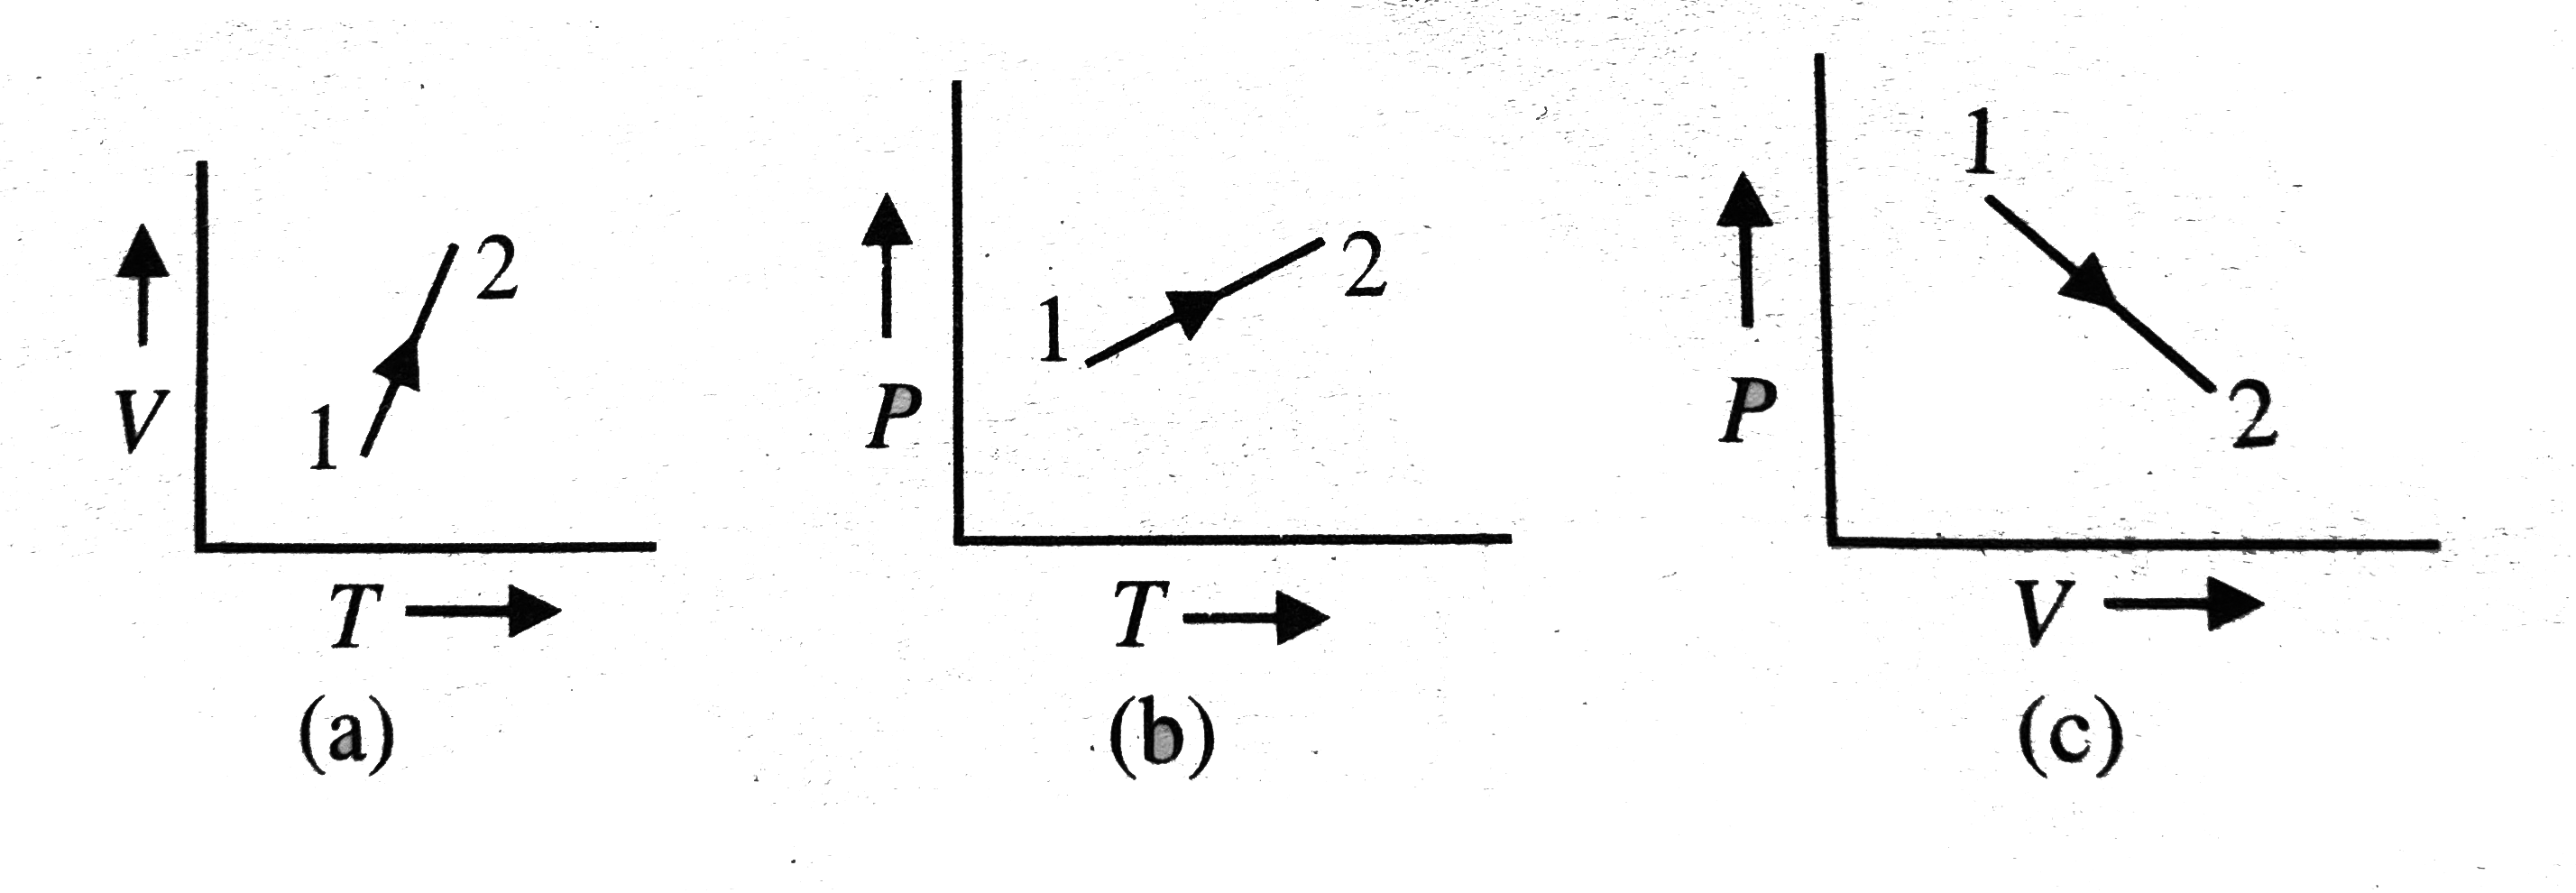
The three diagrams below depict three different processes for a given mass of an ideal gas. What information can be drawn regarding the change of (a) pressure, (b) volume and (c ) temperature of the gas from the plots as shown in Fig., respectively.
View SolutionVolume versus temperature graphs for a given mass of an ideal gas are shown in figure. At two different values of constant pressure. What can be inferred about relation between P1 and P2 ?

View SolutionVolume versus temperature graphs for a given mass of an ideal gas are shown in figure. At two different values of constant pressure. What can be inferred about relation between P1 and P2 ?

View SolutionThe pressure of a given mass of a gas contained in a vessel at constant temperature is reduced to half. Calculte the change in volume of the gas
View SolutionThe raise in the temperature of a given mass of an ideal gas at constant pressure and at temperature 27∘ to double its volume is
View SolutionThe volume-temperature graphs of a given mass of an ideal gas at constant pressure are shown below. What is the correct order of pressure ?
View SolutionP-T graph for same number of moles of two ideal gases are shown . Find the path along which volume decreases .
View Solution
