Volume versus temperature graphs for a given mass of an ideal gas are shown in figure. At two different values of constant pressure. What can be inferred about relation between P1 and P2 ?
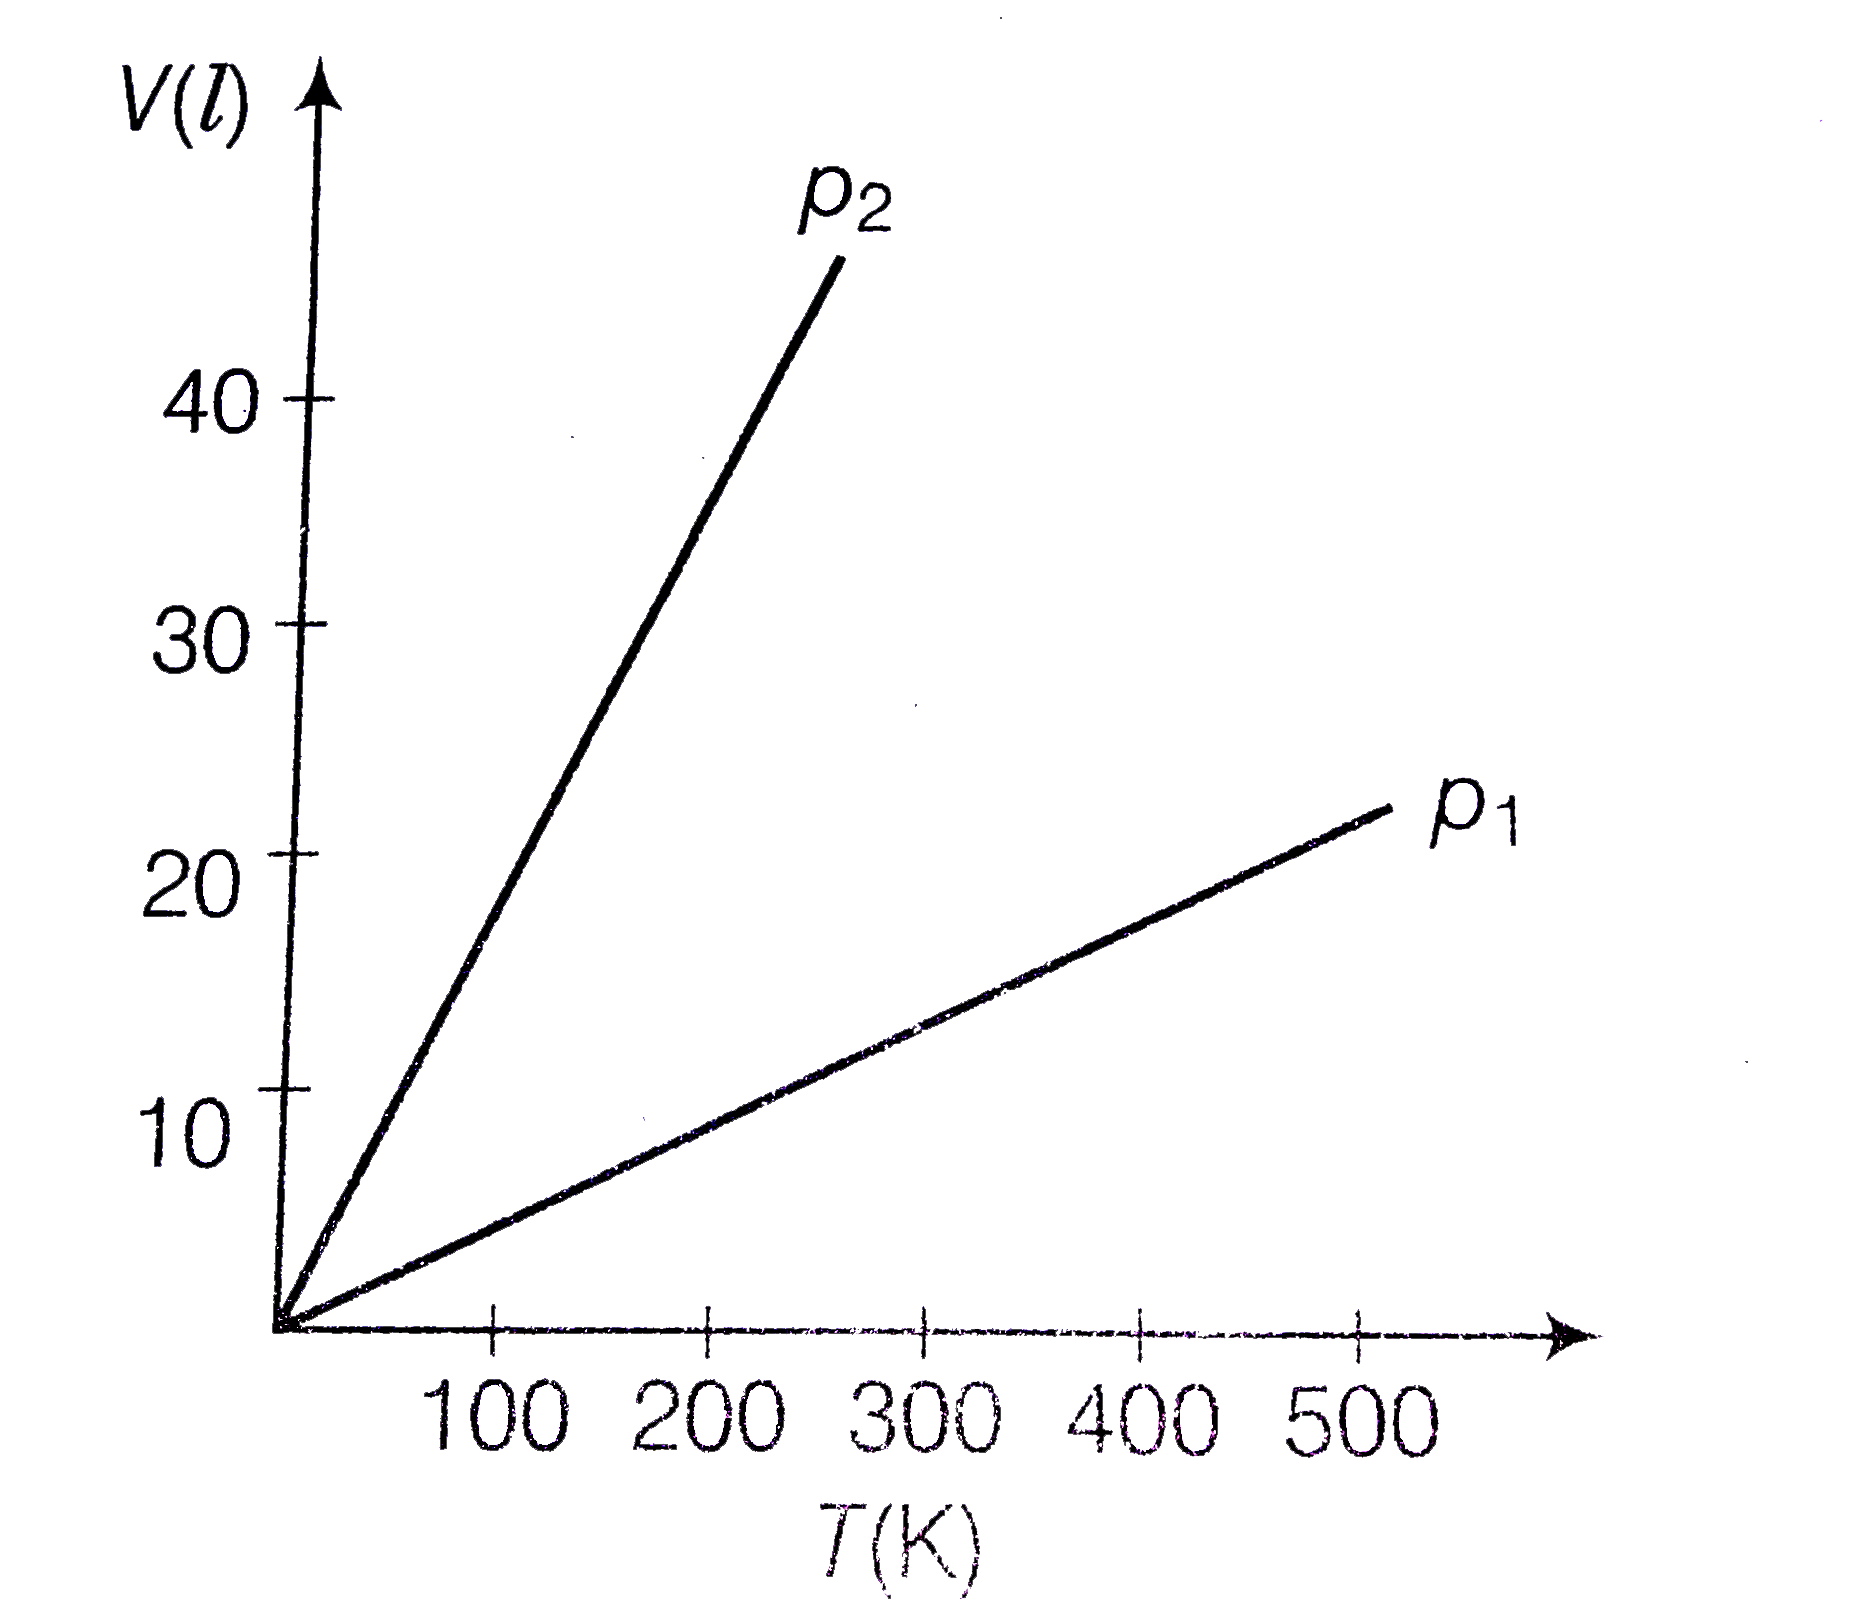
p1>p2
p1=p2
p1<p2
Data is insufficient
The correct Answer is:A
We know for an ideal gas,
pV=nRT⇒V=(nRp)T
Slope of V-T graph, m =dVdT=nRp [m = slope of V-t graph]
⇒ m∝1p [nR=constant]
⇒ p∝1m
Hence, p1p2=m2m1<1⎡⎢
⎢
⎢
⎢⎣p=pressure, V = volumen=number of moles of gasesR=gas constantT=temperature⎤⎥
⎥
⎥
⎥⎦
where, m1 is slope of the graph corresponding to p1 and similarly m2 is slope corresponding to p2.
⇒ p2<p1orp1>p2
Topper's Solved these Questions
- THERMOMETRY THERMAL EXPANSION AND KINETIC THEORY OF GASESBook:DC PANDEY ENGLISHChapter:THERMOMETRY THERMAL EXPANSION AND KINETIC THEORY OF GASESExercise:B medical entrance special format questions
Explore 14 Videos
- THERMOMETRY THERMAL EXPANSION AND KINETIC THEORY OF GASESBook:DC PANDEY ENGLISHChapter:THERMOMETRY THERMAL EXPANSION AND KINETIC THEORY OF GASESExercise:Match the columns
Explore 5 Videos
- THERMOMETRY THERMAL EXPANSION AND KINETIC THEORY OF GASESBook:DC PANDEY ENGLISHChapter:THERMOMETRY THERMAL EXPANSION AND KINETIC THEORY OF GASESExercise:Check point 14.4
Explore 25 Videos
- SUPERPOSITION OF WAVESBook:DC PANDEY ENGLISHChapter:SUPERPOSITION OF WAVESExercise:Level 2 Subjective
Explore 8 Videos
- THERMOMETRY,THERMAL EXPANSION & KINETIC THEORY OF GASESBook:DC PANDEY ENGLISHChapter:THERMOMETRY,THERMAL EXPANSION & KINETIC THEORY OF GASESExercise:Level 2 Subjective
Explore 9 Videos
Similar Questions
Pressure versus temperature graphs of an ideal gas are as shown in figure. Choose the wrong statement
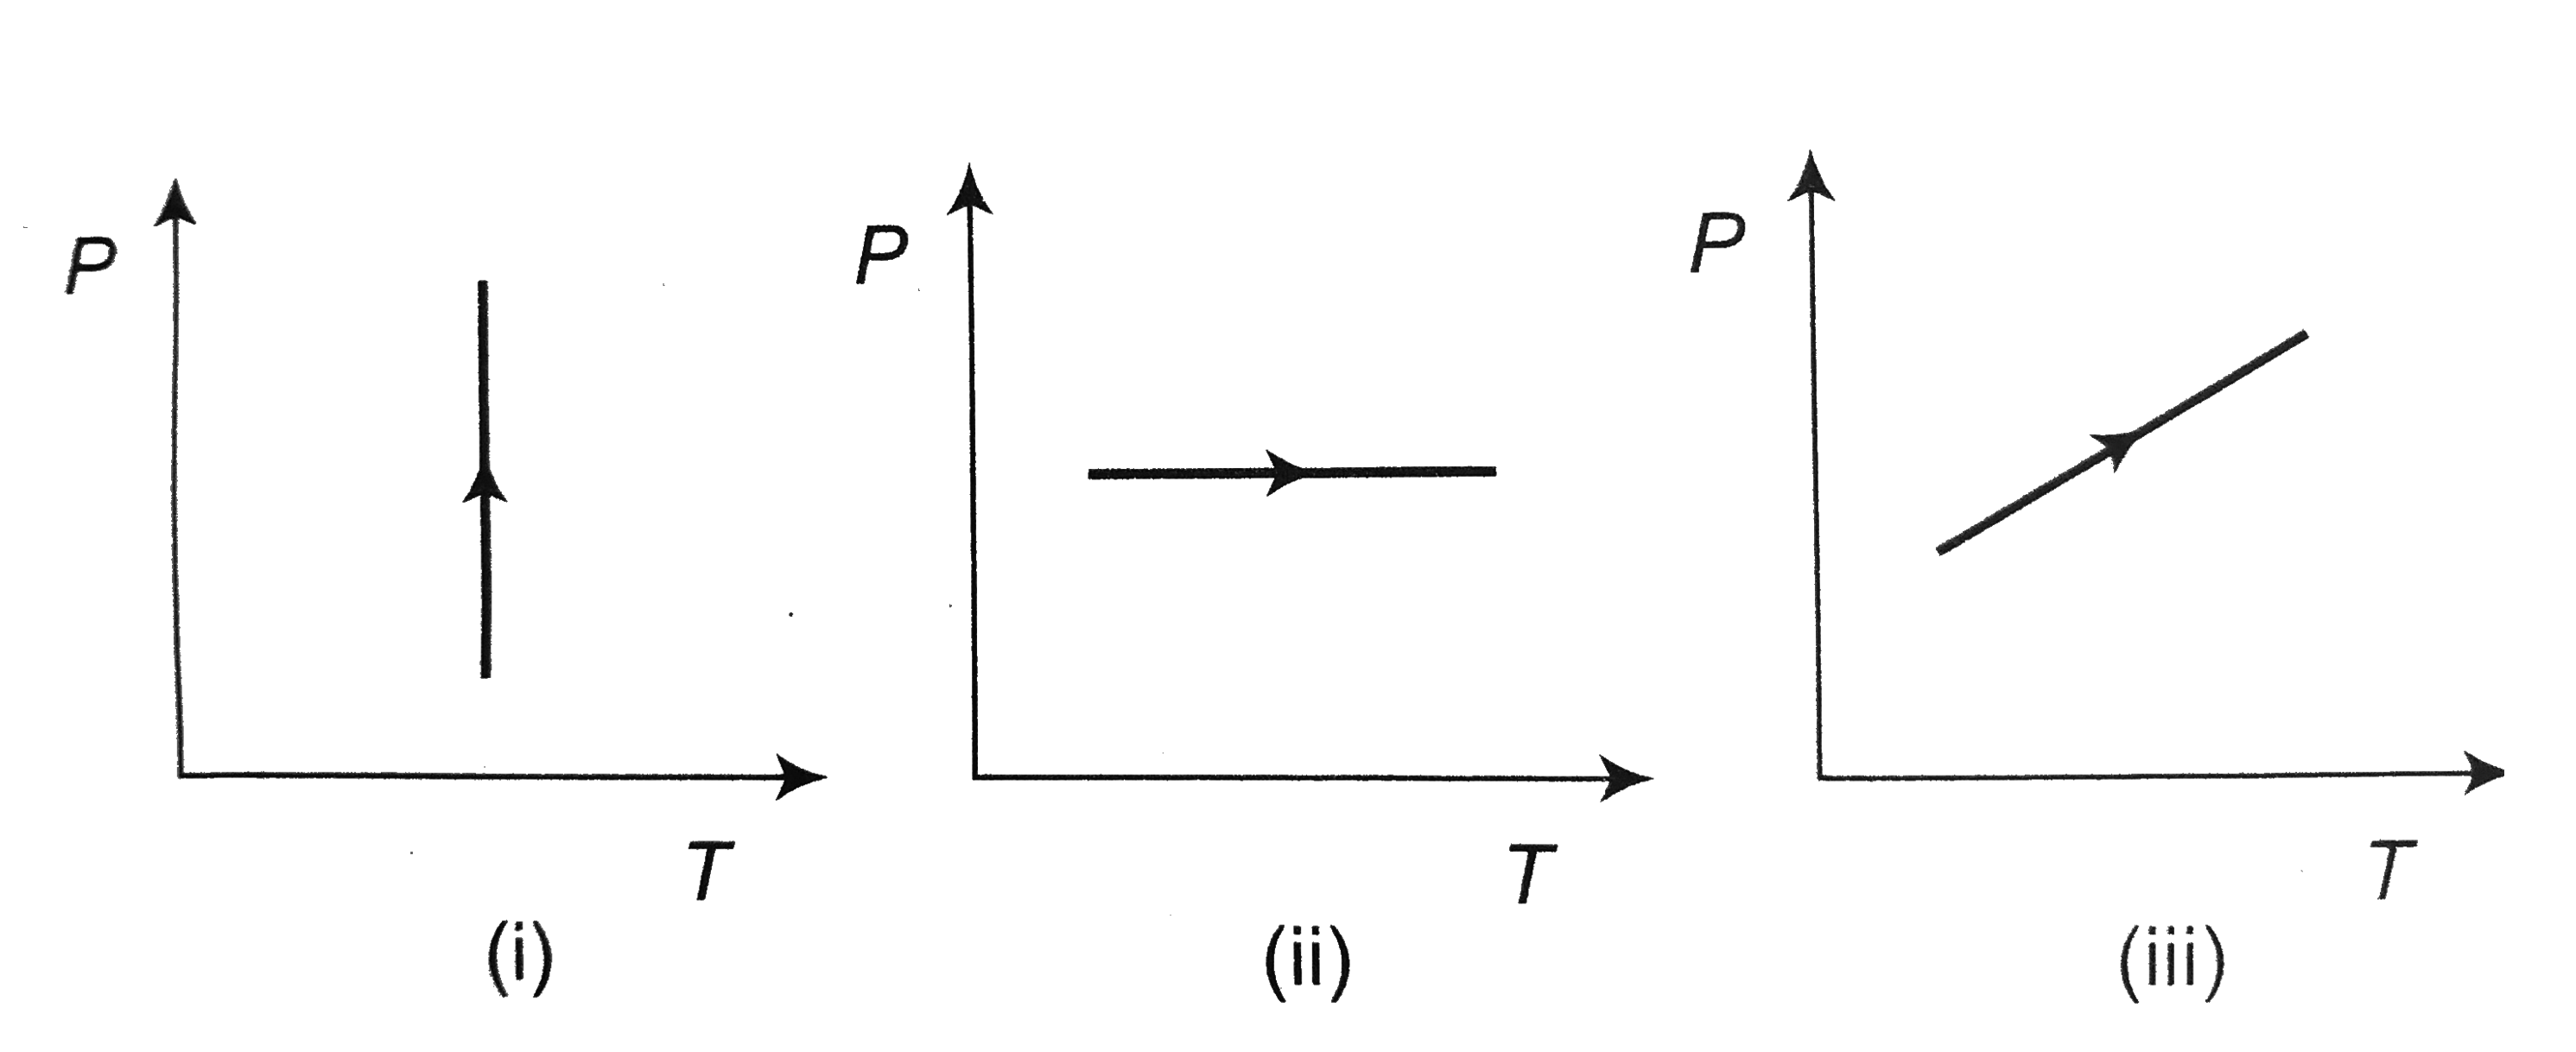
View SolutionPressure versus temperature graphs of an ideal gas are as shown in figure. Choose the wrong statement

View SolutionPressure versus density graph of an ideal gas is shown in figure
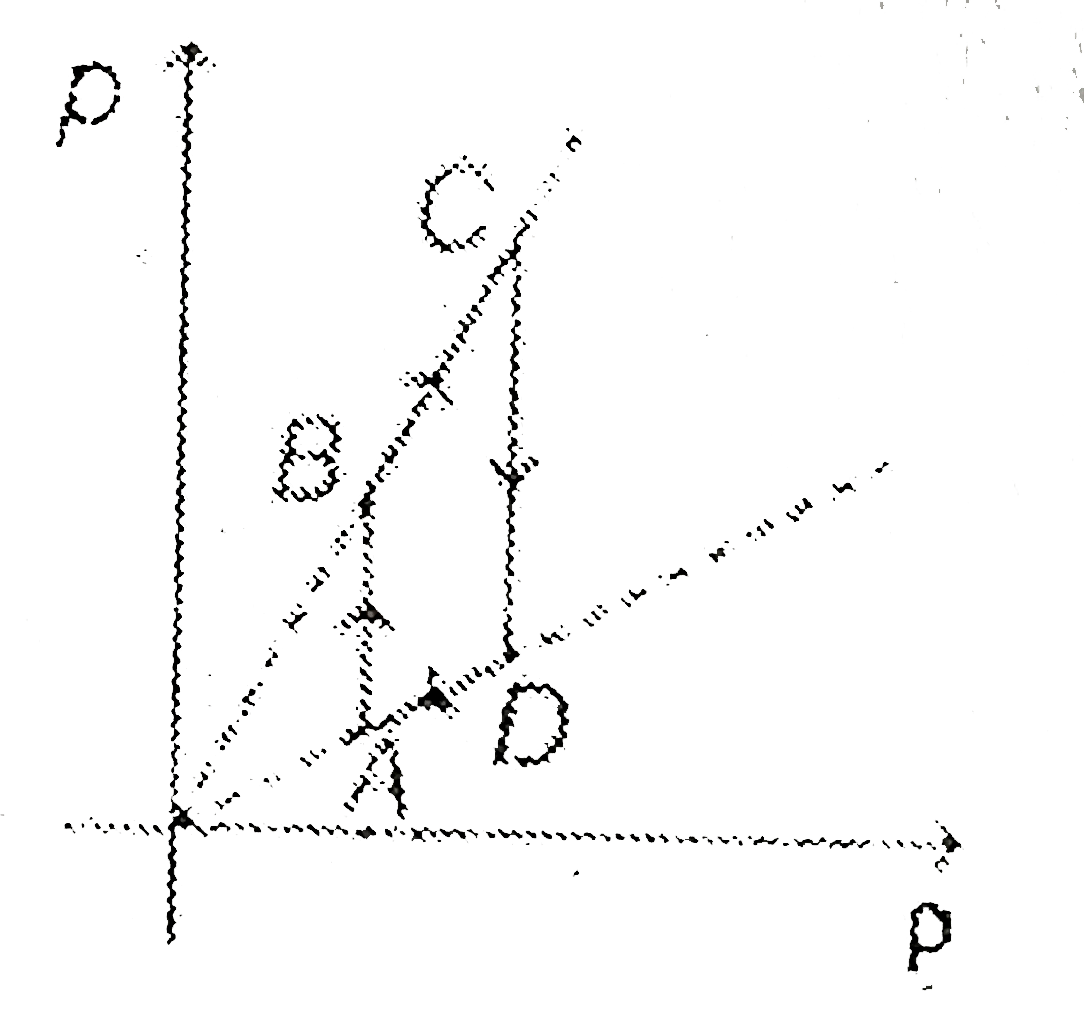
View SolutionThe volume-temperature graphs of a given mass of an ideal gas at constant pressure are shown below. What is the correct order of pressure ?
View SolutionFigure shows volume - temperature (V-T) graph for same mass of an ideal gas at two different pressures P1and P2. Hence
View SolutionPressure versus temperature graph of an ideal gas is shown in figure. Density of the gas at point A is ρ0. Density at B will be
View SolutionThe graph of pressure and temperature for an ideal gas is as shown in figure. The given process is
View SolutionVolume versus temperature graph of two moles of helium gas is as shown in figure. The ratio of heat absorbed and the work done by the gas in process 1−2 is
View SolutionVolume versus temperature graph of two moles of helium gas is as shown in figure. The ratio of heat absorbed and the work done by the gas in process 1−2 is

View SolutionTemperature versus pressure graph of an ideal gas is shown in Fig. During the process AB
View Solution

