Which of the following curve represents the variation of λM with √C for AgNO3?
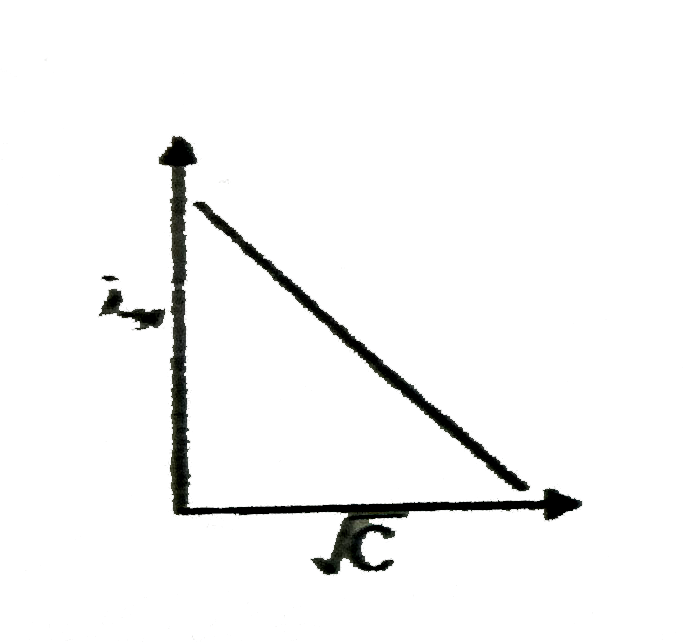
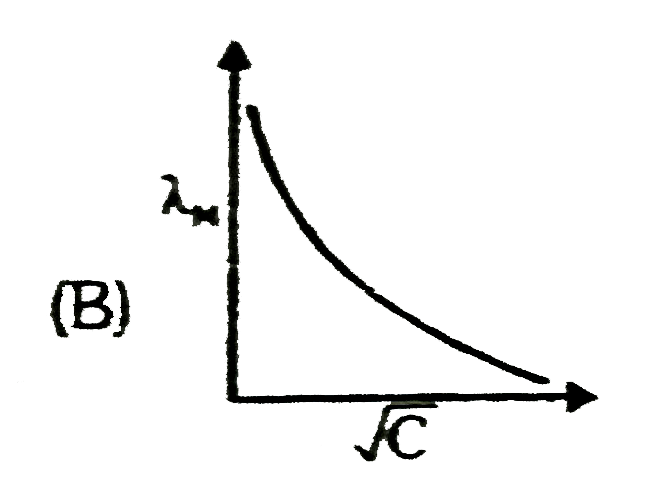
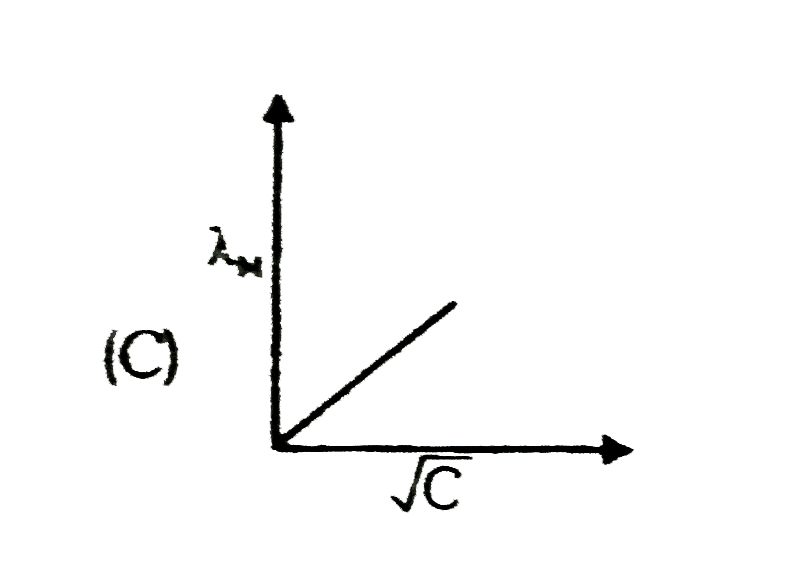
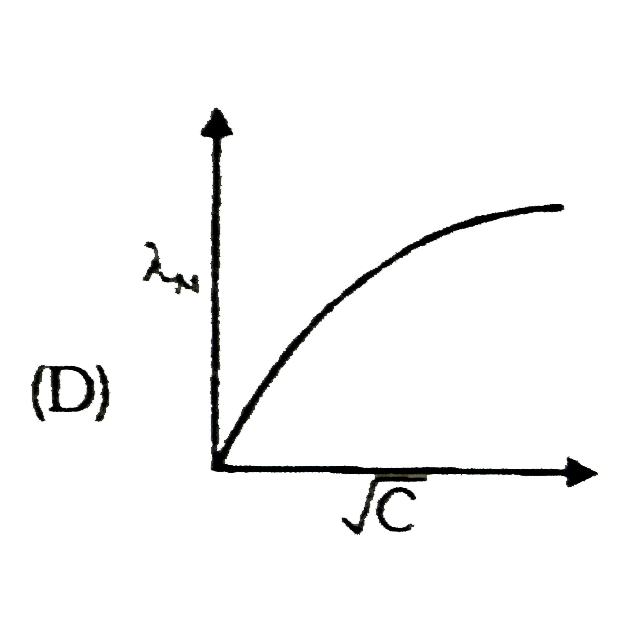
The correct Answer is:A
To determine the variation of λm with √C for AgNO3, we can follow these steps:
1. Understand the Relationship: The relationship given is:
λm=λm0−B√C
where λm is the molar conductivity, λm0 is the molar conductivity at infinite dilution, B is a constant, and C is the concentration.
2. Rearranging the Equation: We can rearrange the equation to express it in a linear form:
λm=λm0−B√C
This can be rewritten as:
λm=−B√C+λm0
This is in the form of y=mx+c, where:
- y is λm
- x is √C
- m (slope) is −B
- c (y-intercept) is λm0
3. Identify the Characteristics of the Graph:
- The slope m=−B indicates that the slope is negative.
- The y-intercept is λm0, which is the value of λm when √C=0.
4. Plotting the Graph:
- On the graph, plot λm on the y-axis and √C on the x-axis.
- Since the slope is negative, the line will slope downwards from left to right.
- The line will start at λm0 on the y-axis when √C=0.
5. Conclusion: The graph will show a straight line that decreases as √C increases, confirming that λm decreases with increasing concentration.
Final Answer:
The correct curve that represents the variation of λm with √C for AgNO3 is a straight line with a negative slope starting from λm0.
λm=λm0−B√C
where λm is the molar conductivity, λm0 is the molar conductivity at infinite dilution, B is a constant, and C is the concentration.
λm=λm0−B√C
This can be rewritten as:
λm=−B√C+λm0
This is in the form of y=mx+c, where:
- y is λm
- x is √C
- m (slope) is −B
- c (y-intercept) is λm0
- The slope m=−B indicates that the slope is negative.
- The y-intercept is λm0, which is the value of λm when √C=0.
- On the graph, plot λm on the y-axis and √C on the x-axis.
- Since the slope is negative, the line will slope downwards from left to right.
- The line will start at λm0 on the y-axis when √C=0.
The correct curve that represents the variation of λm with √C for AgNO3 is a straight line with a negative slope starting from λm0.
Topper's Solved these Questions
- ELECTROCHEMISTRYBOOK - ALLENCHAPTER - ELECTROCHEMISTRYEXERCISE - EXERCISE-03
24 Videos
- ELECTROCHEMISTRYBOOK - ALLENCHAPTER - ELECTROCHEMISTRYEXERCISE - EXERCISE-04 [A]
55 Videos
- ELECTROCHEMISTRYBOOK - ALLENCHAPTER - ELECTROCHEMISTRYEXERCISE - Part (II) EXERCISE-01
44 Videos
- CHEMISTRY AT A GLANCEBOOK - ALLENCHAPTER - CHEMISTRY AT A GLANCEEXERCISE - ORGANIC CHEMISTRY
472 Videos
- HYDROCARBONBOOK - ALLENCHAPTER - HYDROCARBONEXERCISE - MCQ
15 Videos
Similar Questions
Knowledge Check
Which of the following curve gives the variation of Λmwith√C for CH3COOH ?
A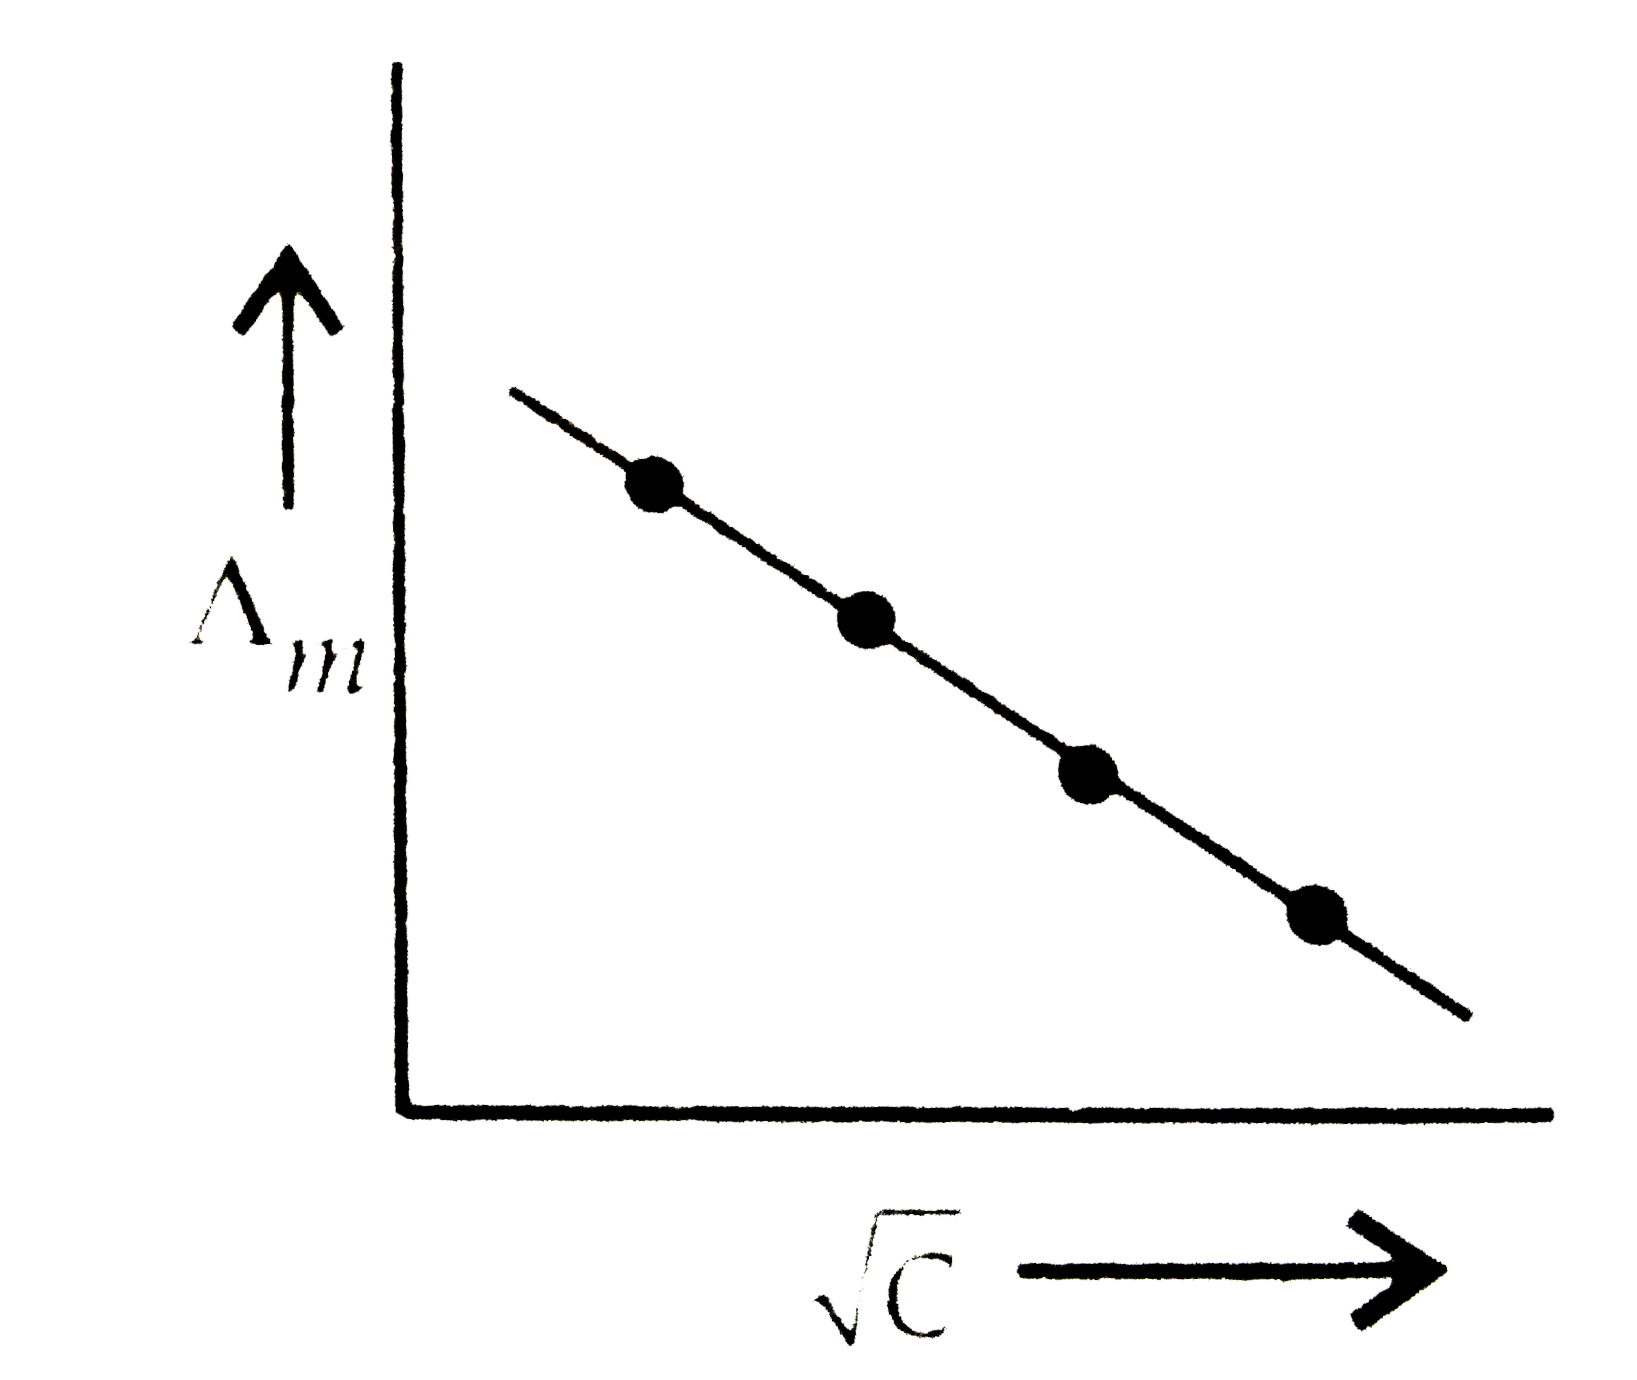 B
B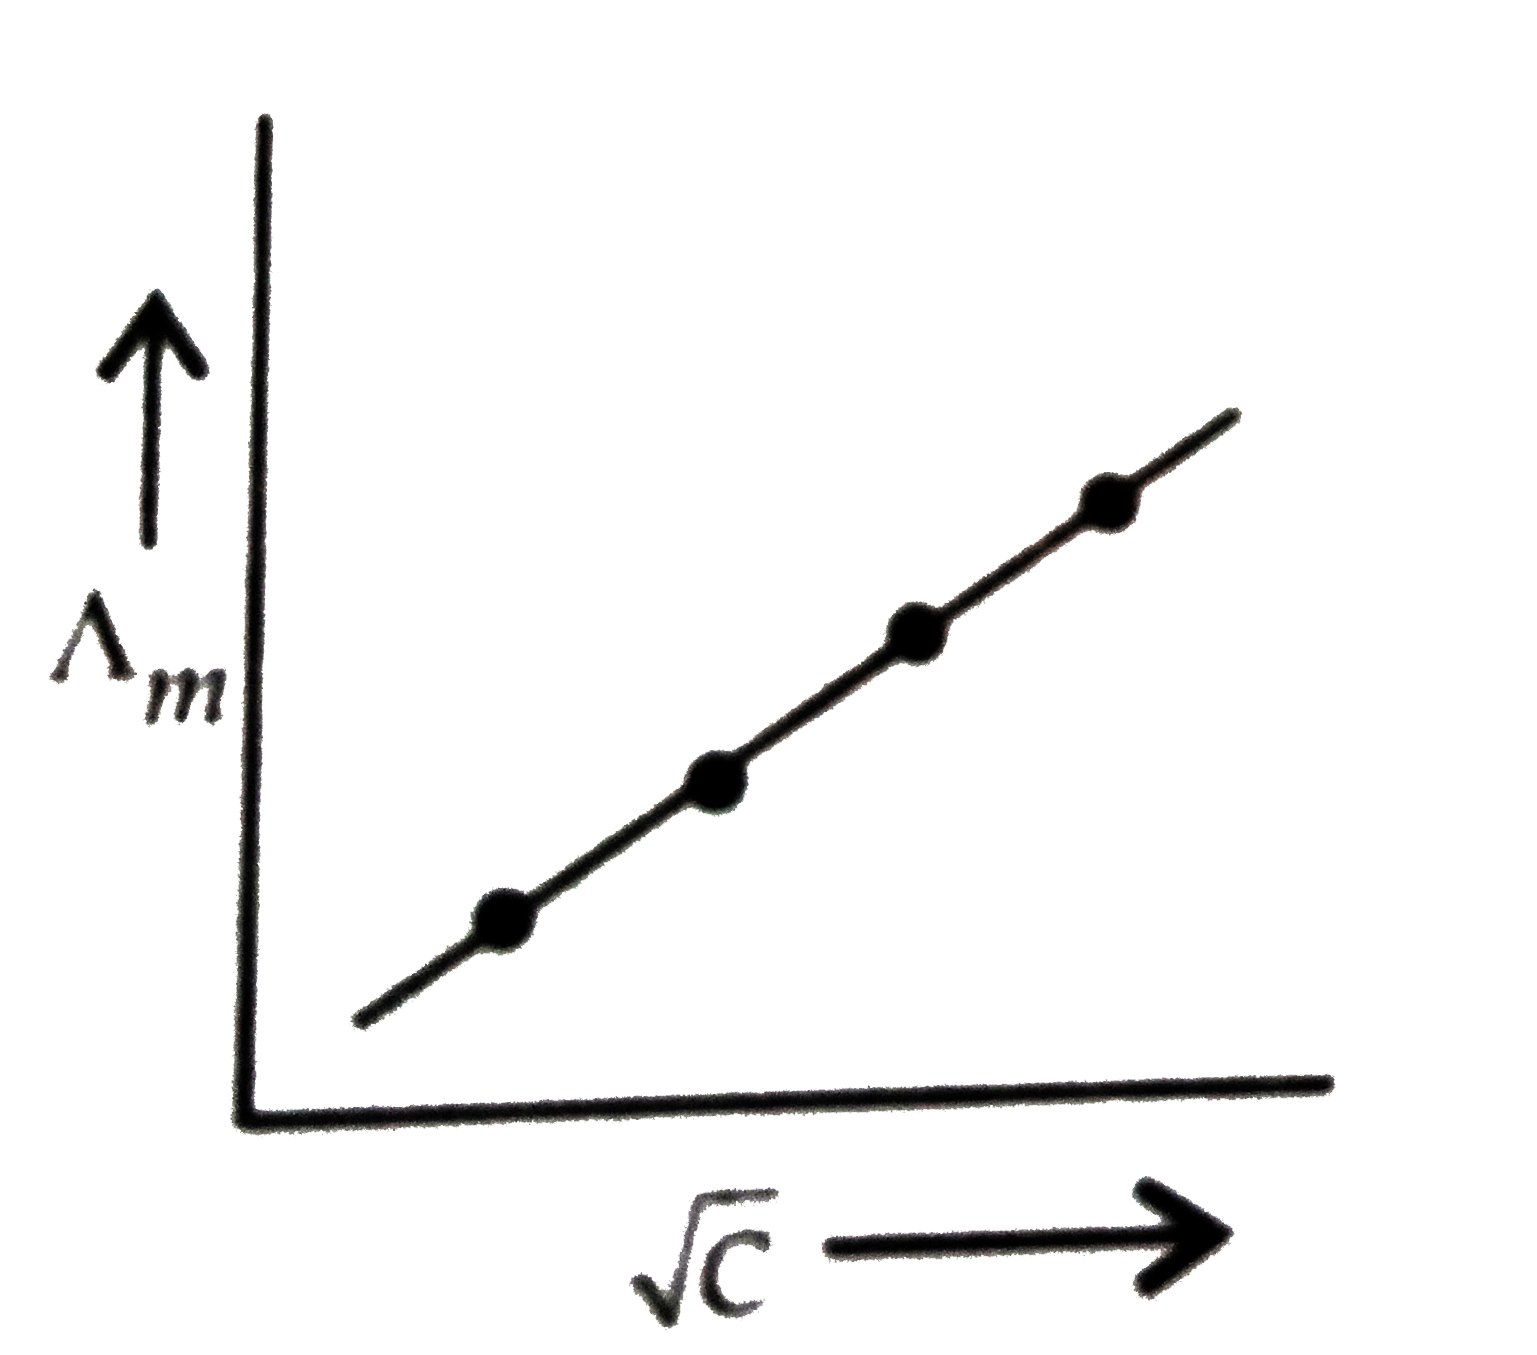 C
C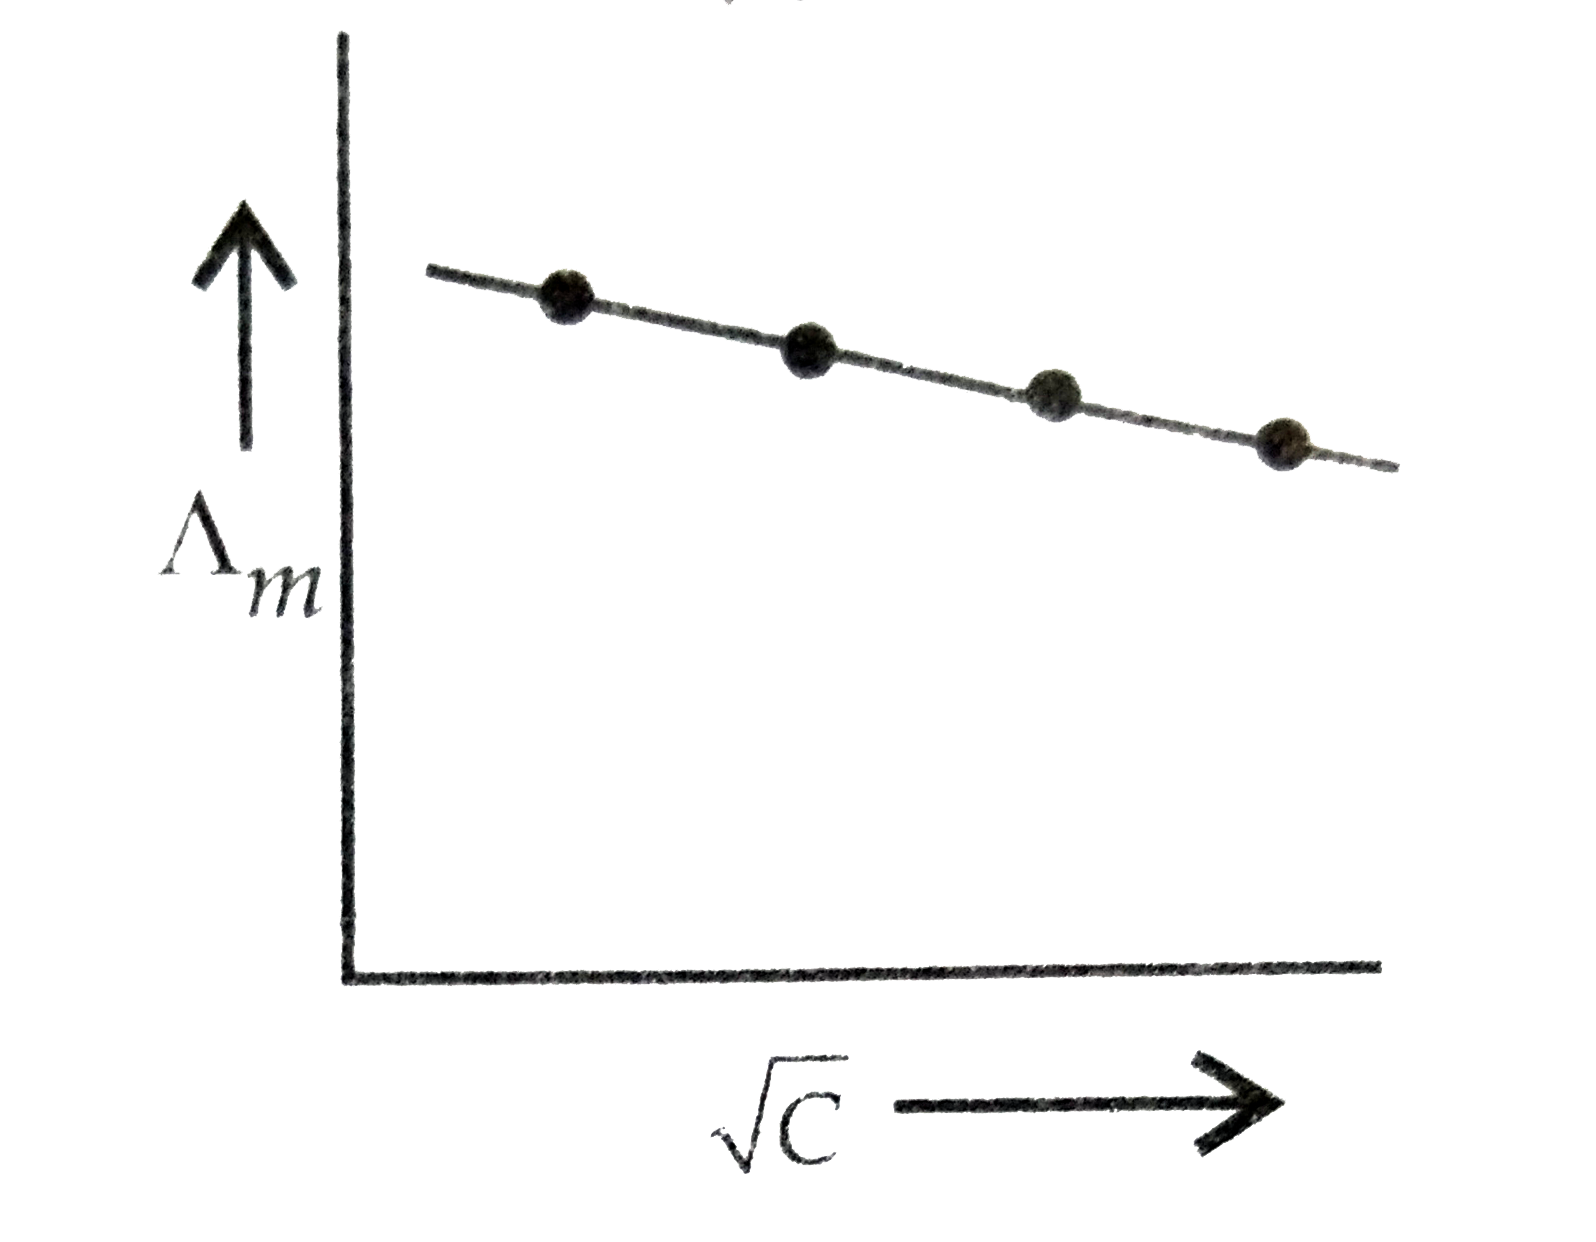 DNone of these
Which of the following may represent the curve x = 2y+ 3?
View SolutionWhich of the following graphs correctly represents the variation of g on the - Earth?
View SolutionA point source of light is used in an experiment on photoelectric effect . Which of the following curves best represents the variation of photo current (i) with distance (d) of the source from the emitter ?

View SolutionWhich of the following curve represent variation of density of water with temperature best-
View SolutionWhich of the following represents logistic growth curve?
View SolutionWhich of the following can represent the curve x2=−2y ?
View SolutionWhich of the following curve will represent the variation of conductance C during titration of CH3COOH by gradual addition of NaOH solution (V)
View Solution
