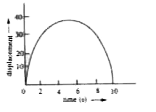
The displacement-time graph of a moving object is shown in figure. Which of the velocity-time graphs shown in figure could represent the motion of the same body ?
 Solution in Telugu
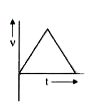


The correct Answer is:C
Step by step video, text & image solution for The displacement-time graph of a moving object is shown in figure. Which of the velocity-time graphs shown in figure could represent the motion of the same body ? by Physics experts to help you in doubts & scoring excellent marks in Class 11 exams.
Updated on:21/07/2023Topper's Solved these Questions
- KINEMATICSBOOK - AAKASH SERIESCHAPTER - KINEMATICSEXERCISE - LECTURE SHEET (EXERCISE-III) ( Graphs) ( More than One Correct answer Type Questions)
1 Videos
- KINEMATICSBOOK - AAKASH SERIESCHAPTER - KINEMATICSEXERCISE - LECTURE SHEET (EXERCISE-III) ( Graphs) (Linked Comprehension Type Questions)
3 Videos
- KINEMATICSBOOK - AAKASH SERIESCHAPTER - KINEMATICSEXERCISE - LECTURE SHEET (EXERCISE - II) (Vertical Motion)( Integer Type Questions)
1 Videos
- HORIZONTAL CIRCULAR MOTIONBOOK - AAKASH SERIESCHAPTER - HORIZONTAL CIRCULAR MOTIONEXERCISE - ADDITIONAL PRACTICE EXERCISE (PRACTICE SHEET (ADVANCED) Integer Type Questions)
3 Videos
- KINETIC THEORY OF GASESBOOK - AAKASH SERIESCHAPTER - KINETIC THEORY OF GASESEXERCISE - Practice Exercise
15 Videos
Similar Questions
A jet plane starts from rest as S=0 and it is subjected to the acceleration shown

View SolutionThe velocity-time graph of a particle moving along a srtaight line is as shown in fig. The rate of acceleration and deceleration is constant and it is equal to 5ms−2. If the avrage velocity during the motion is 20ms−1, then
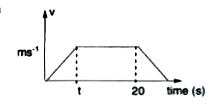
The maximum velocity of the particle is
View SolutionA particle is projected vertically upwards with speed 'u' in a medium in which the resistance to motion is proportional to square of speed. Initially net force is double to its weight. The time of ascent and maximum height are kπu48,pu24glog(2). The values of 'k' and 'p' are
View SolutionA vehicle whose wheel track is 1.7m wide and whose centre of gravity 1 m above the road and central between the wheels, taken a curve whose radius 50m, on a level road. The speed at which the inner wheel would leave the road is close to n×5m/s.
View SolutionThe kinetic energy of translation of 20gm of oxygen at 47∘C is (molecular wt. of oxygen is 32gm/mol and R=8.3 J/mol/K)
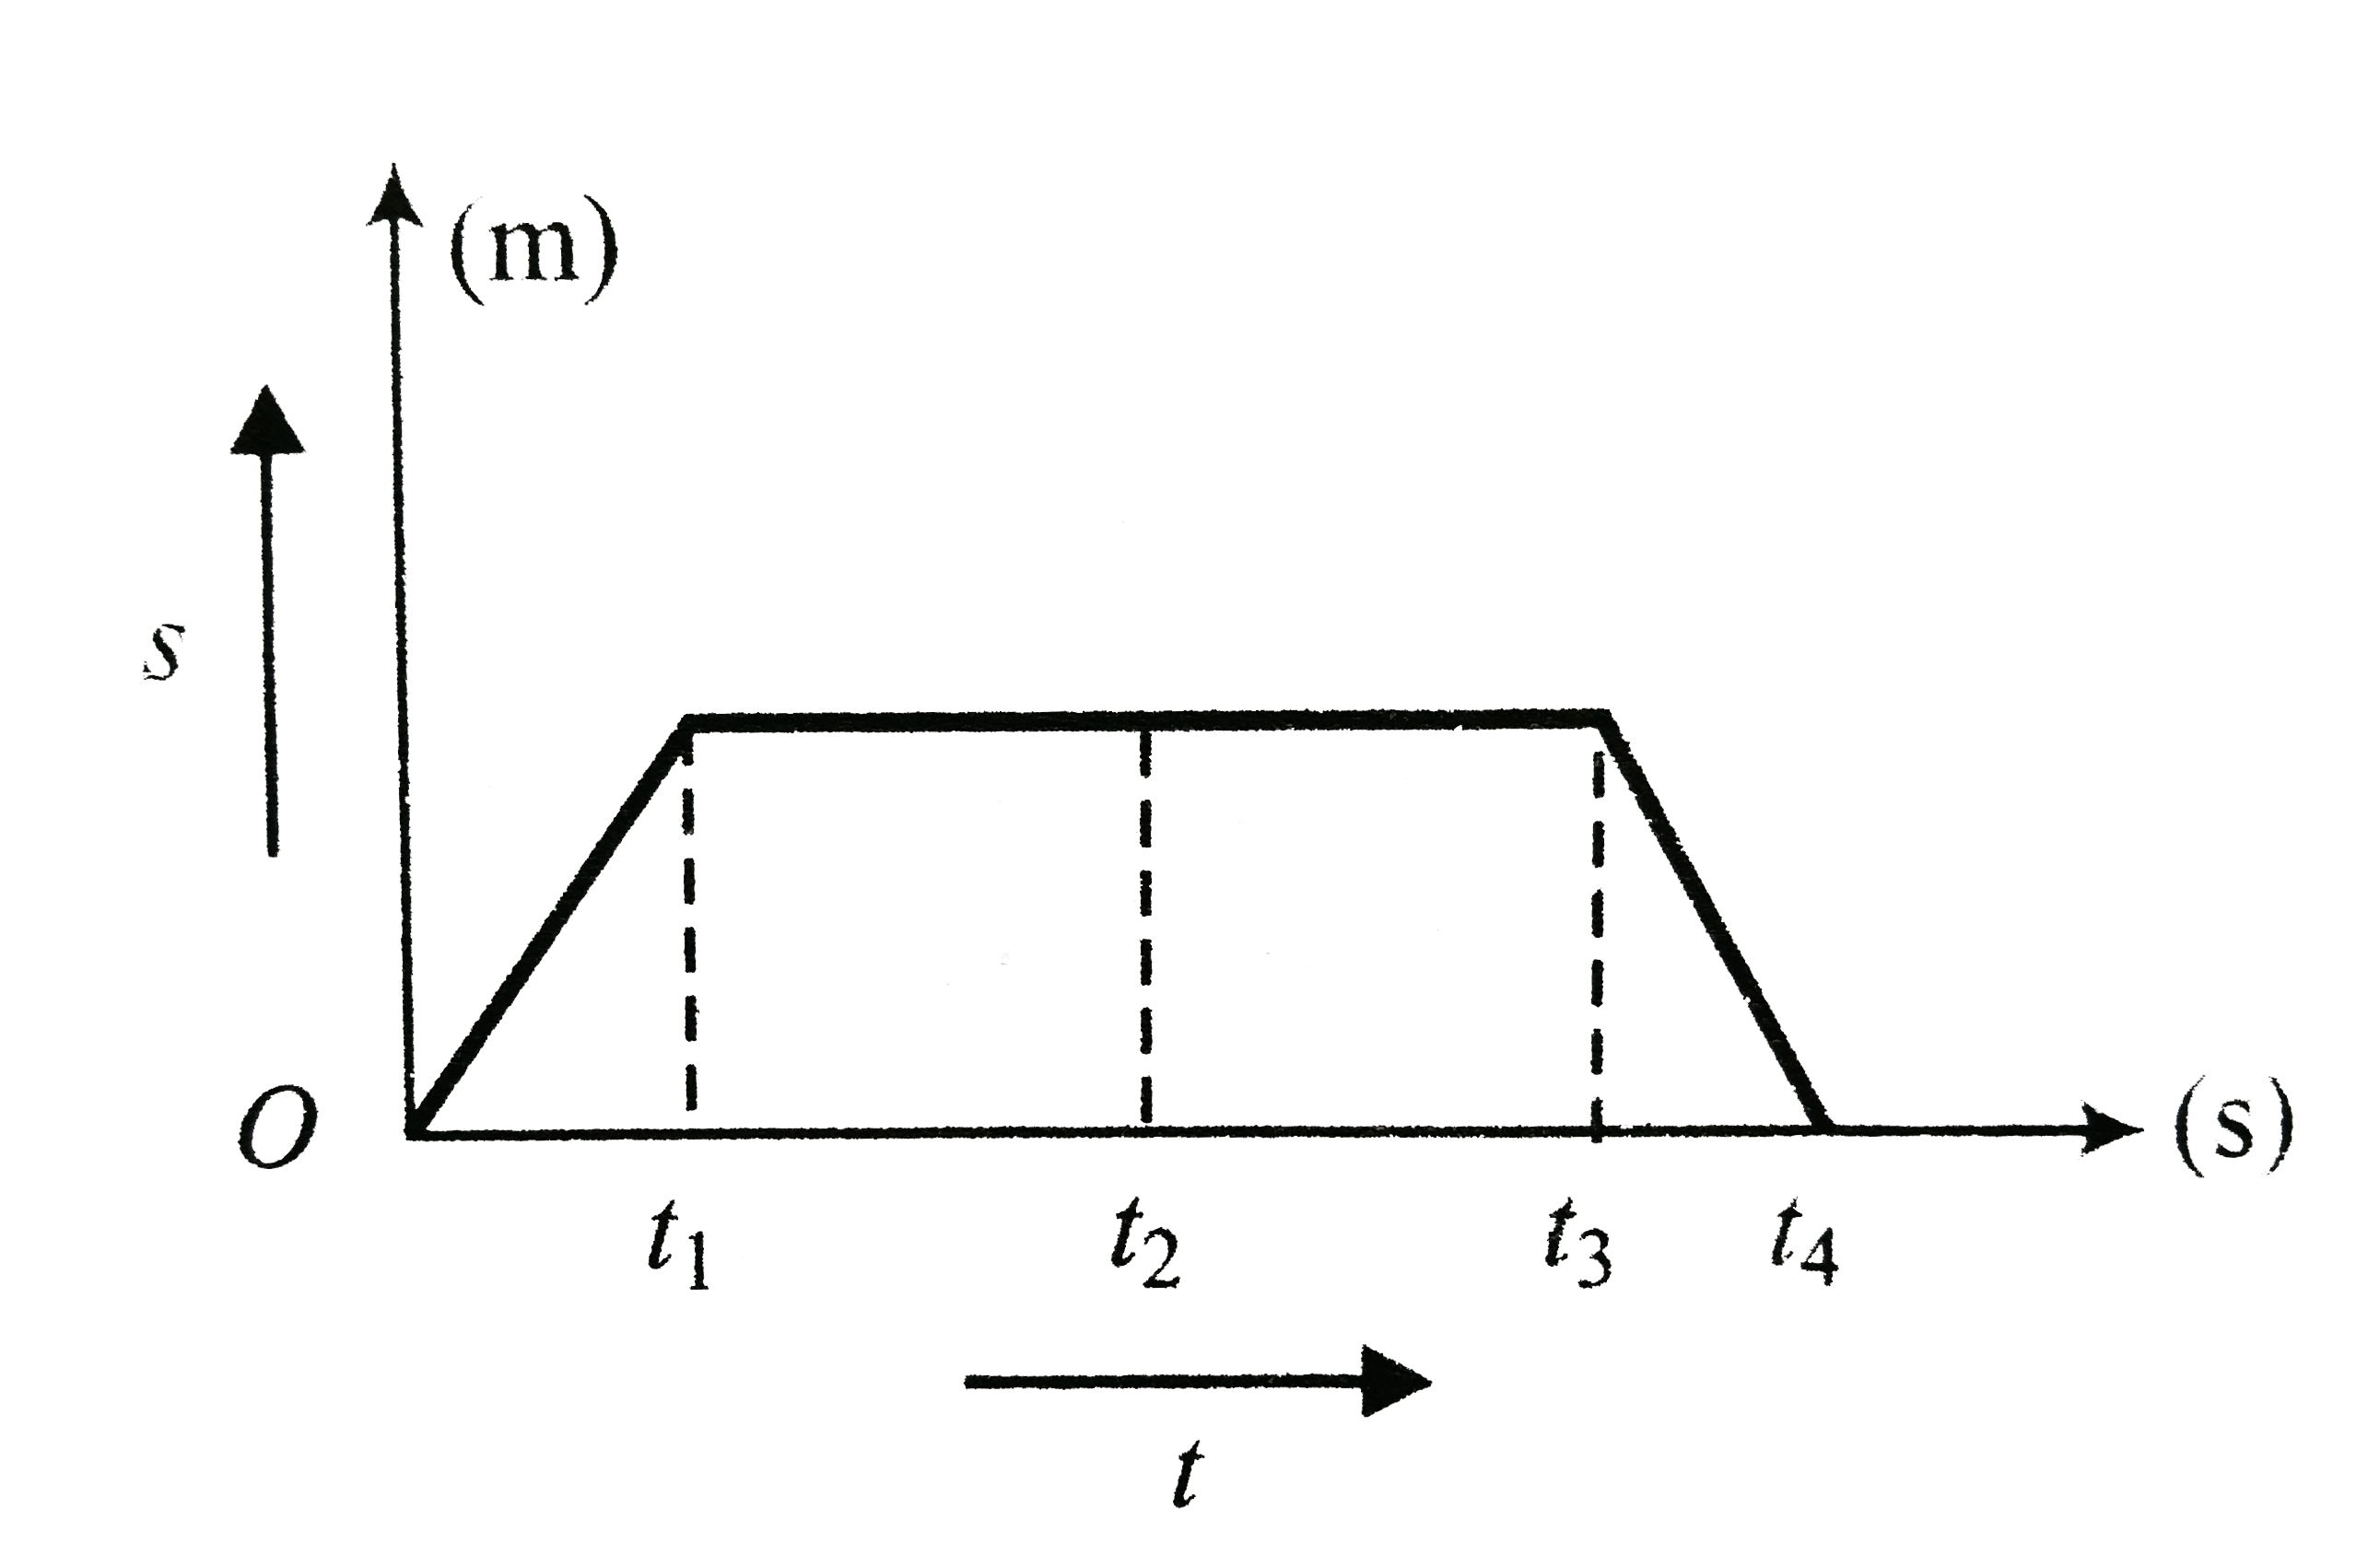
View SolutionThe displacement-time graph of a body is shown in.
 .
.
The velocity-time graph of the motion of the body will be .
View SolutionIf velocity-time graph of a body is as shown in figure, what is the nature of motion ?
View Solution
Figure shows the displacement tiime (x-t) graph of a body moving in a straight line which one of the graph shown in figure represents the velocity- time (v-t) graph of the motion of the body.
View SolutionThe velocity-time graph for a particle moving along X-axis is shown in the figure. The corresponding displacement-time graph is correctly shown by
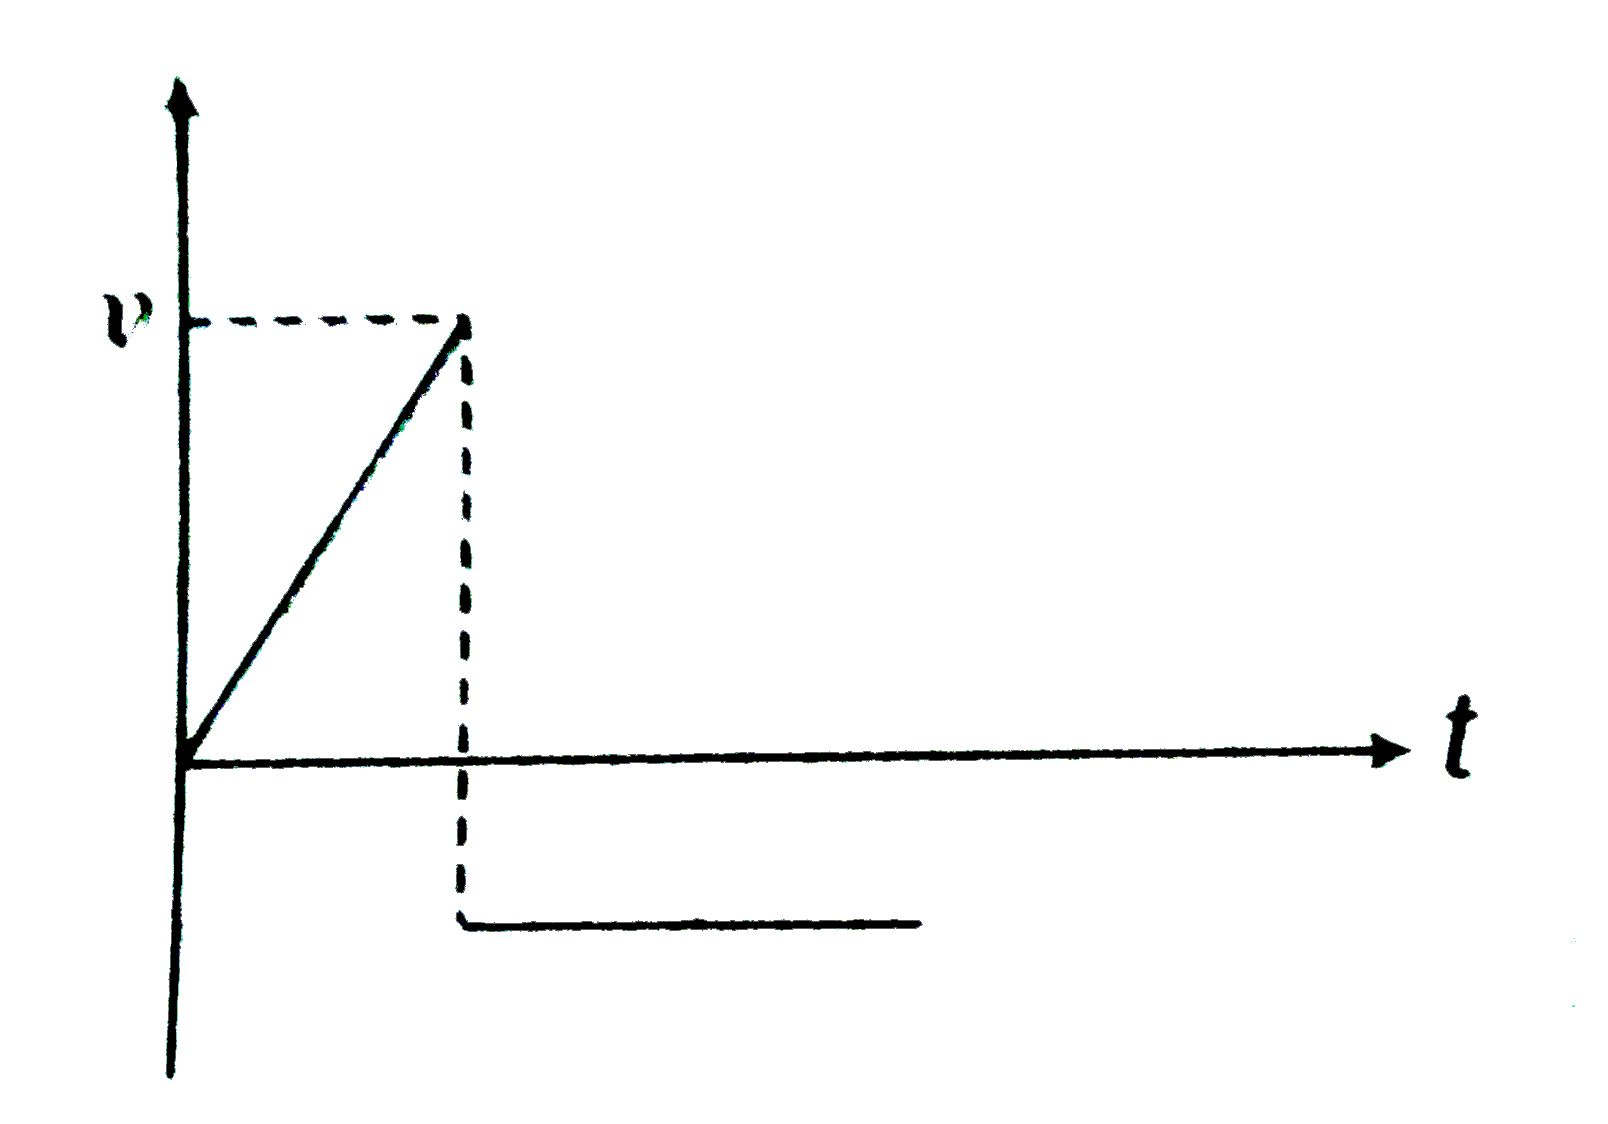
View SolutionThe velocity time graph for a particle moving along x-axis is shown in the figure. The corresponding displacement time graph is correctly shown by
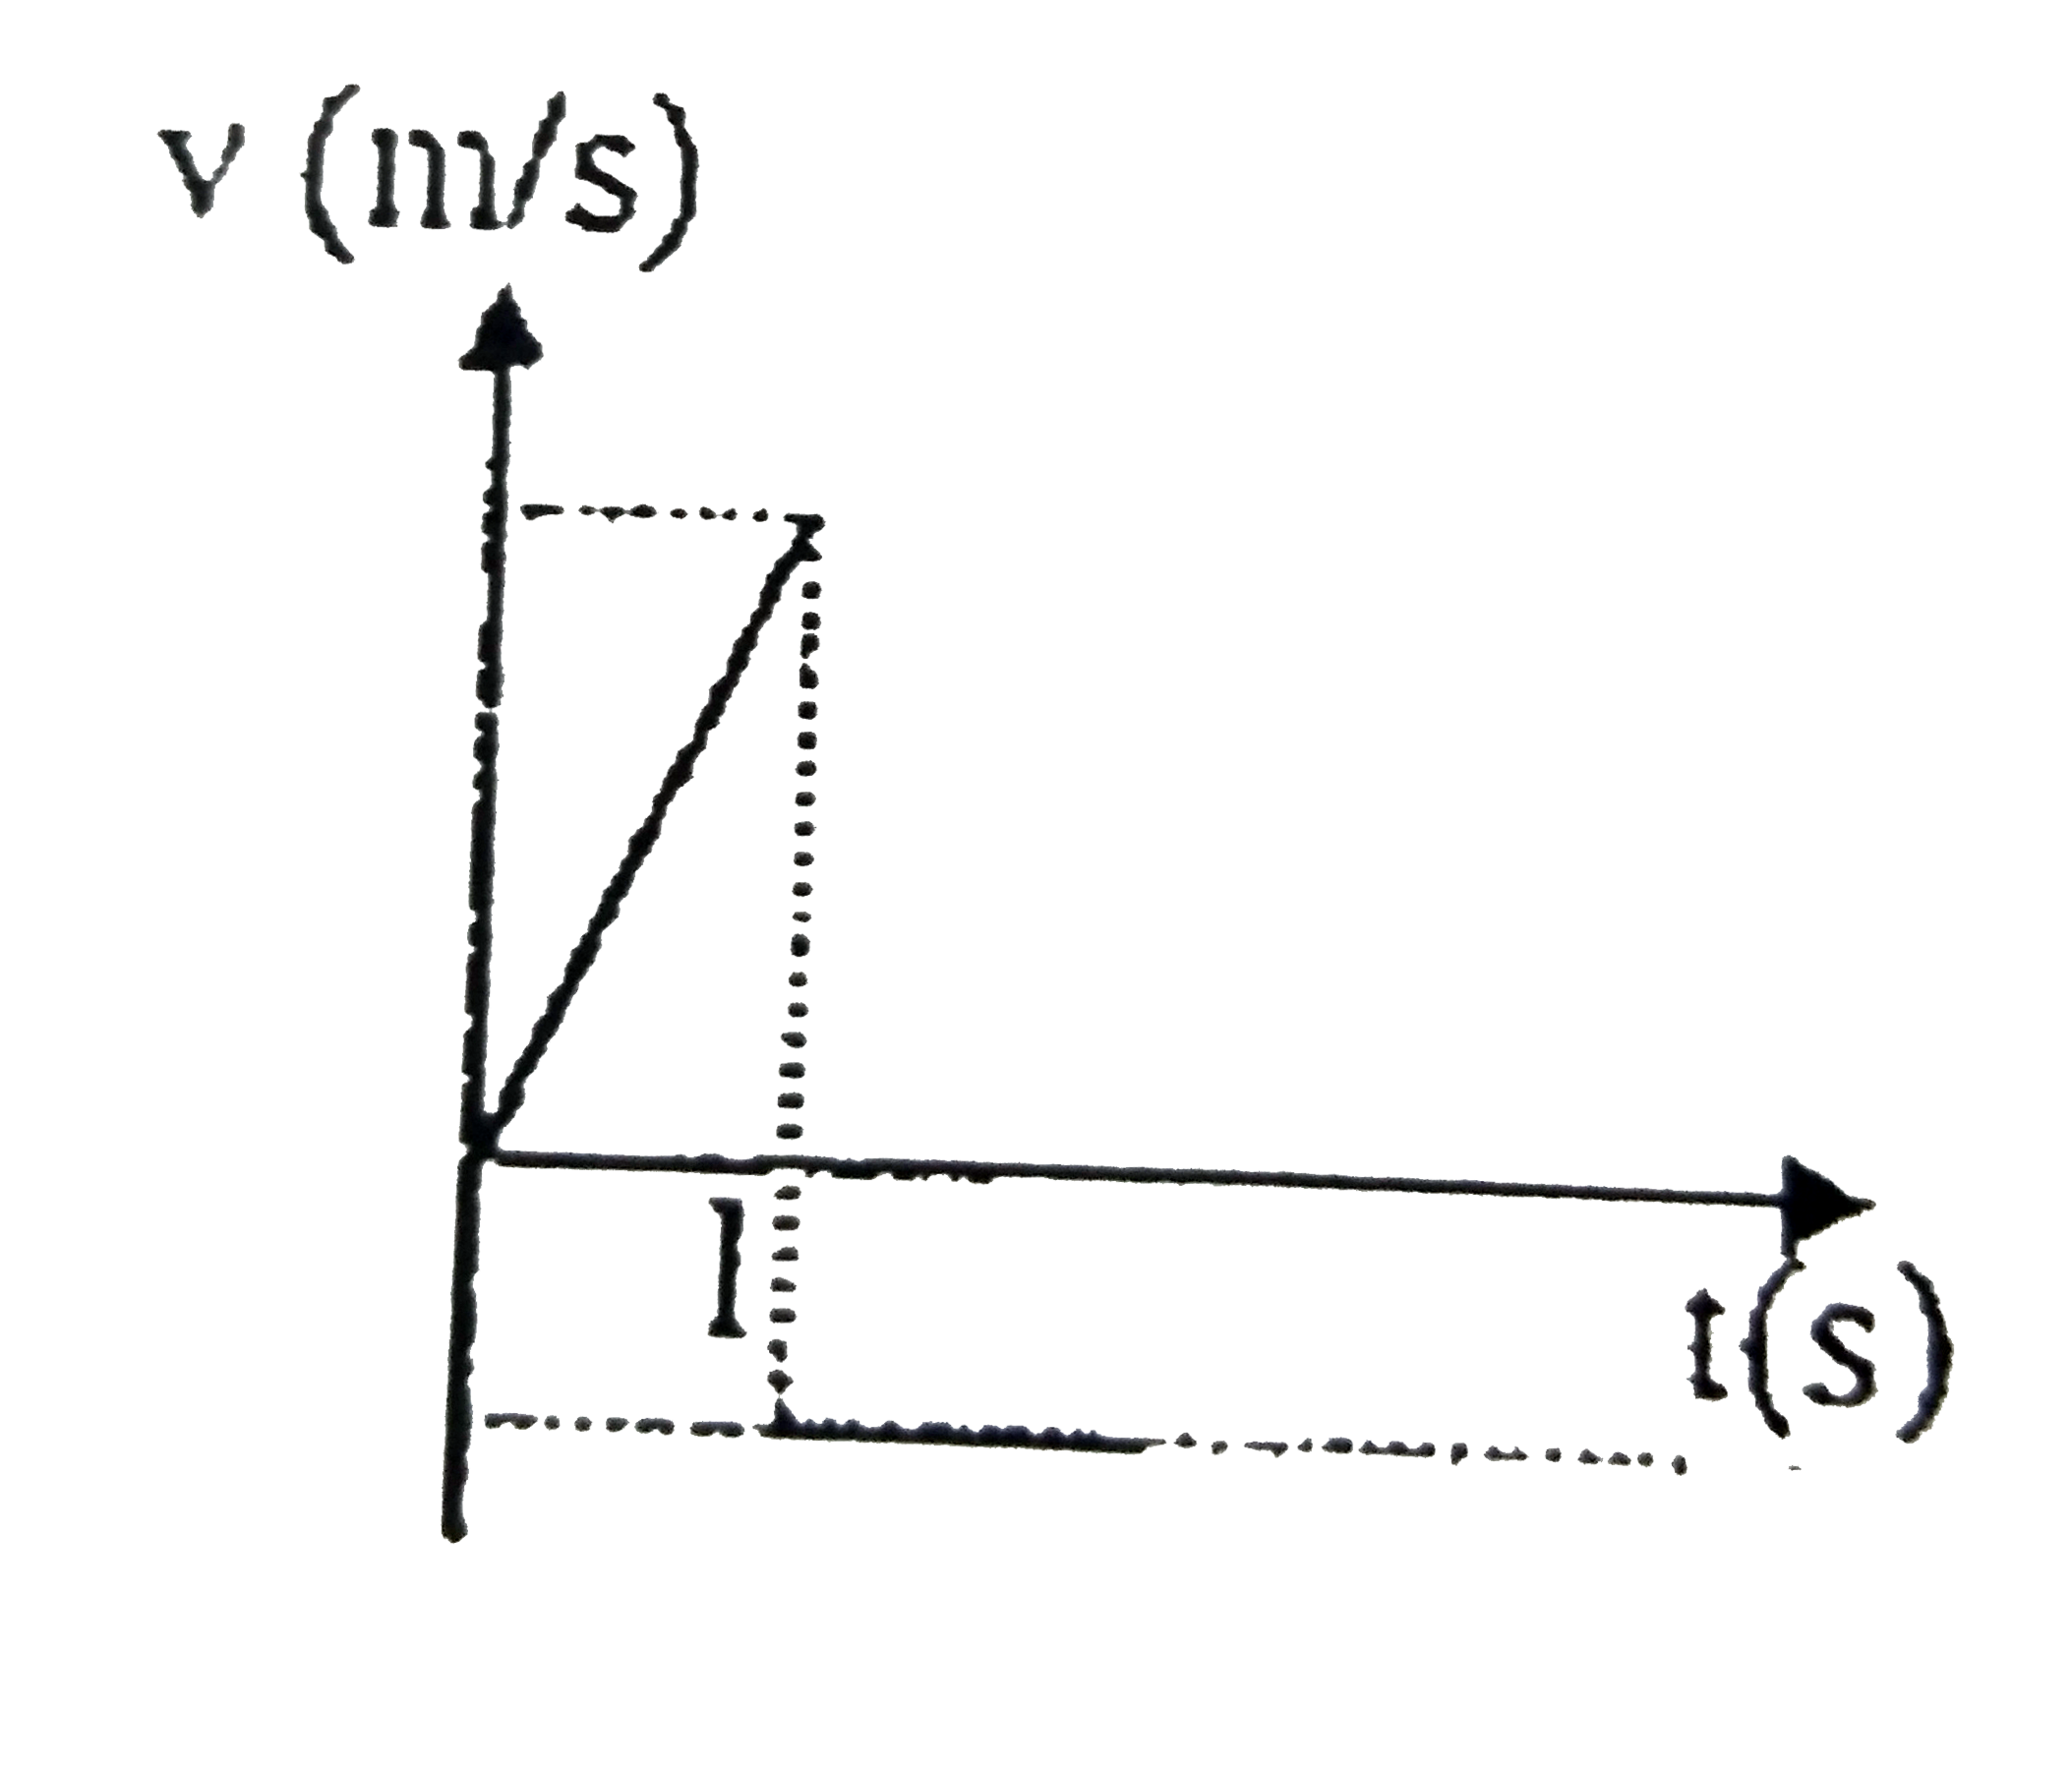
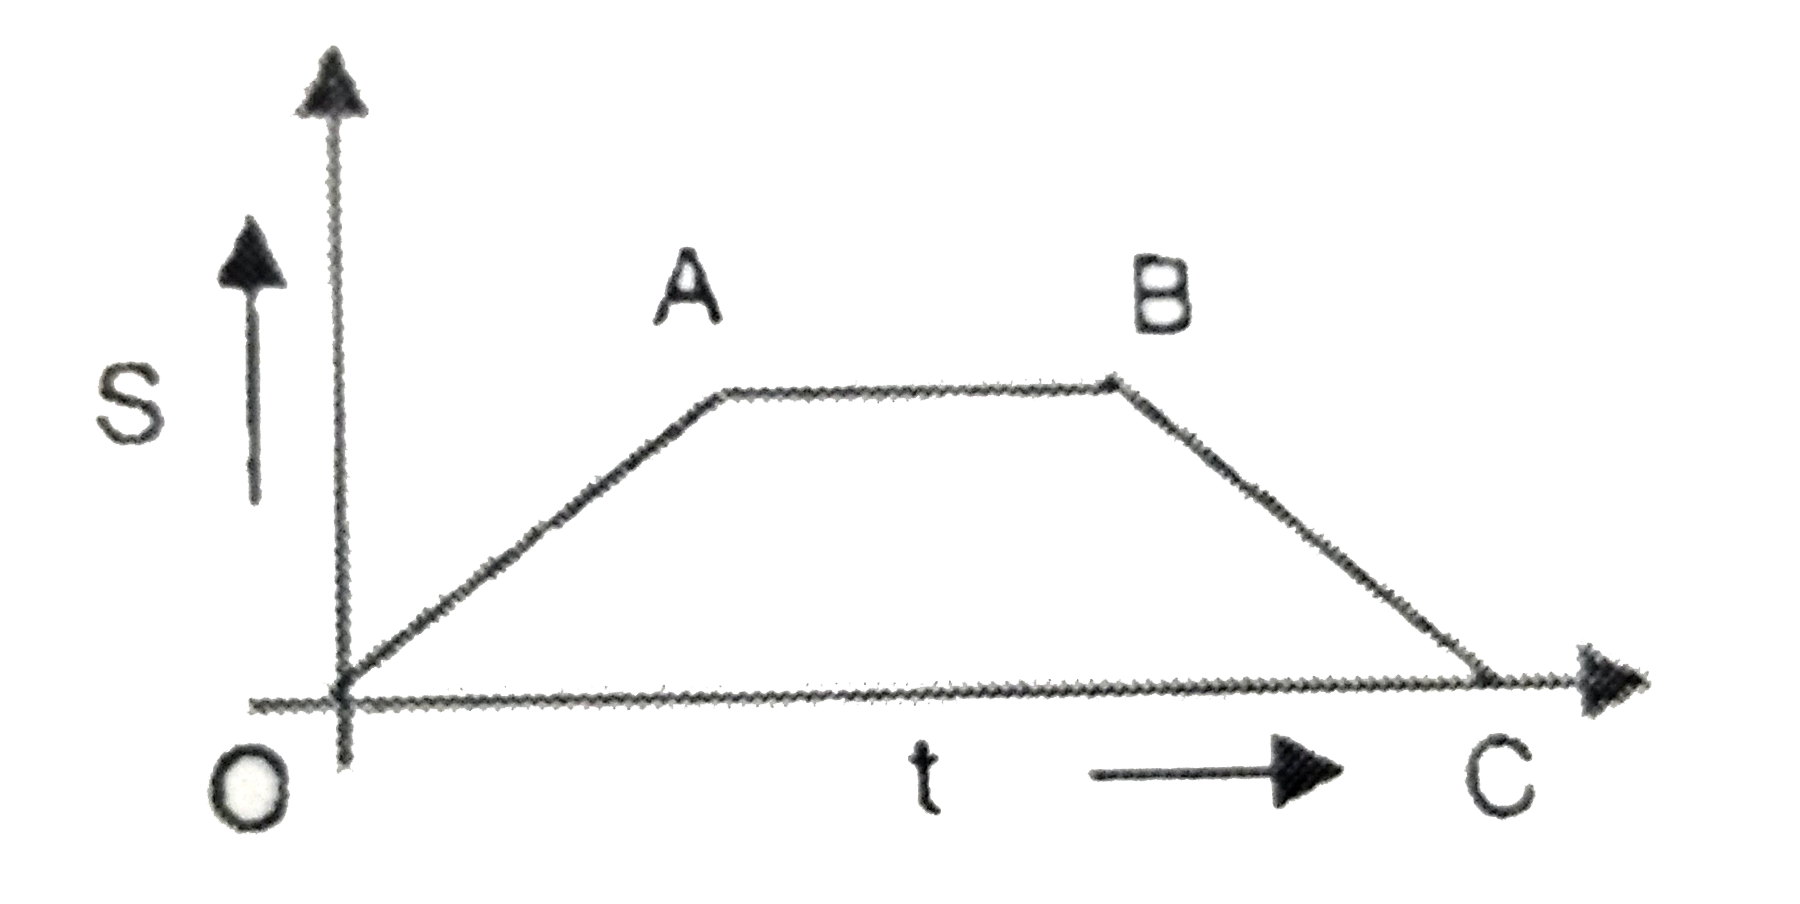
View SolutionThe displacement-time graph of a body is shown in the figure below. The part of the graph that represents the uniform motion of the body is _________
View SolutionThe displacement-time of a moving object is shown in figure. Which of the velocity-time graphs shown in figure could represent the motion of the same body?
View SolutionA : The displacement (s) time graph shown in the figure represents an accelerated motion.
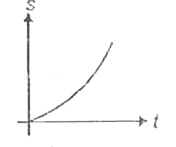
R : Slope of graph increases with time.
View SolutionThe velocity time graph for a particle moving along X-axis is shown in the figure. The corresponding displacement time graph is correctly shown by
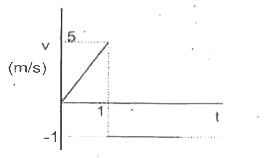
View Solutionकिसी गतिशील वस्तु का वेग-समय ग्राफ चित्र में दर्शाया गया है। उस समयान्तराल में, जिसमें वस्तु का त्वरण तथा मंदन अशून्य रहता है, कुल विस्थापन है
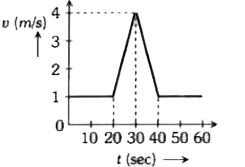
View SolutionThe displacement-time graph of a moving object is shown in figure. Which of the velocity-time graphs shown in figure could represent the motion of the same body ?

View Solution
