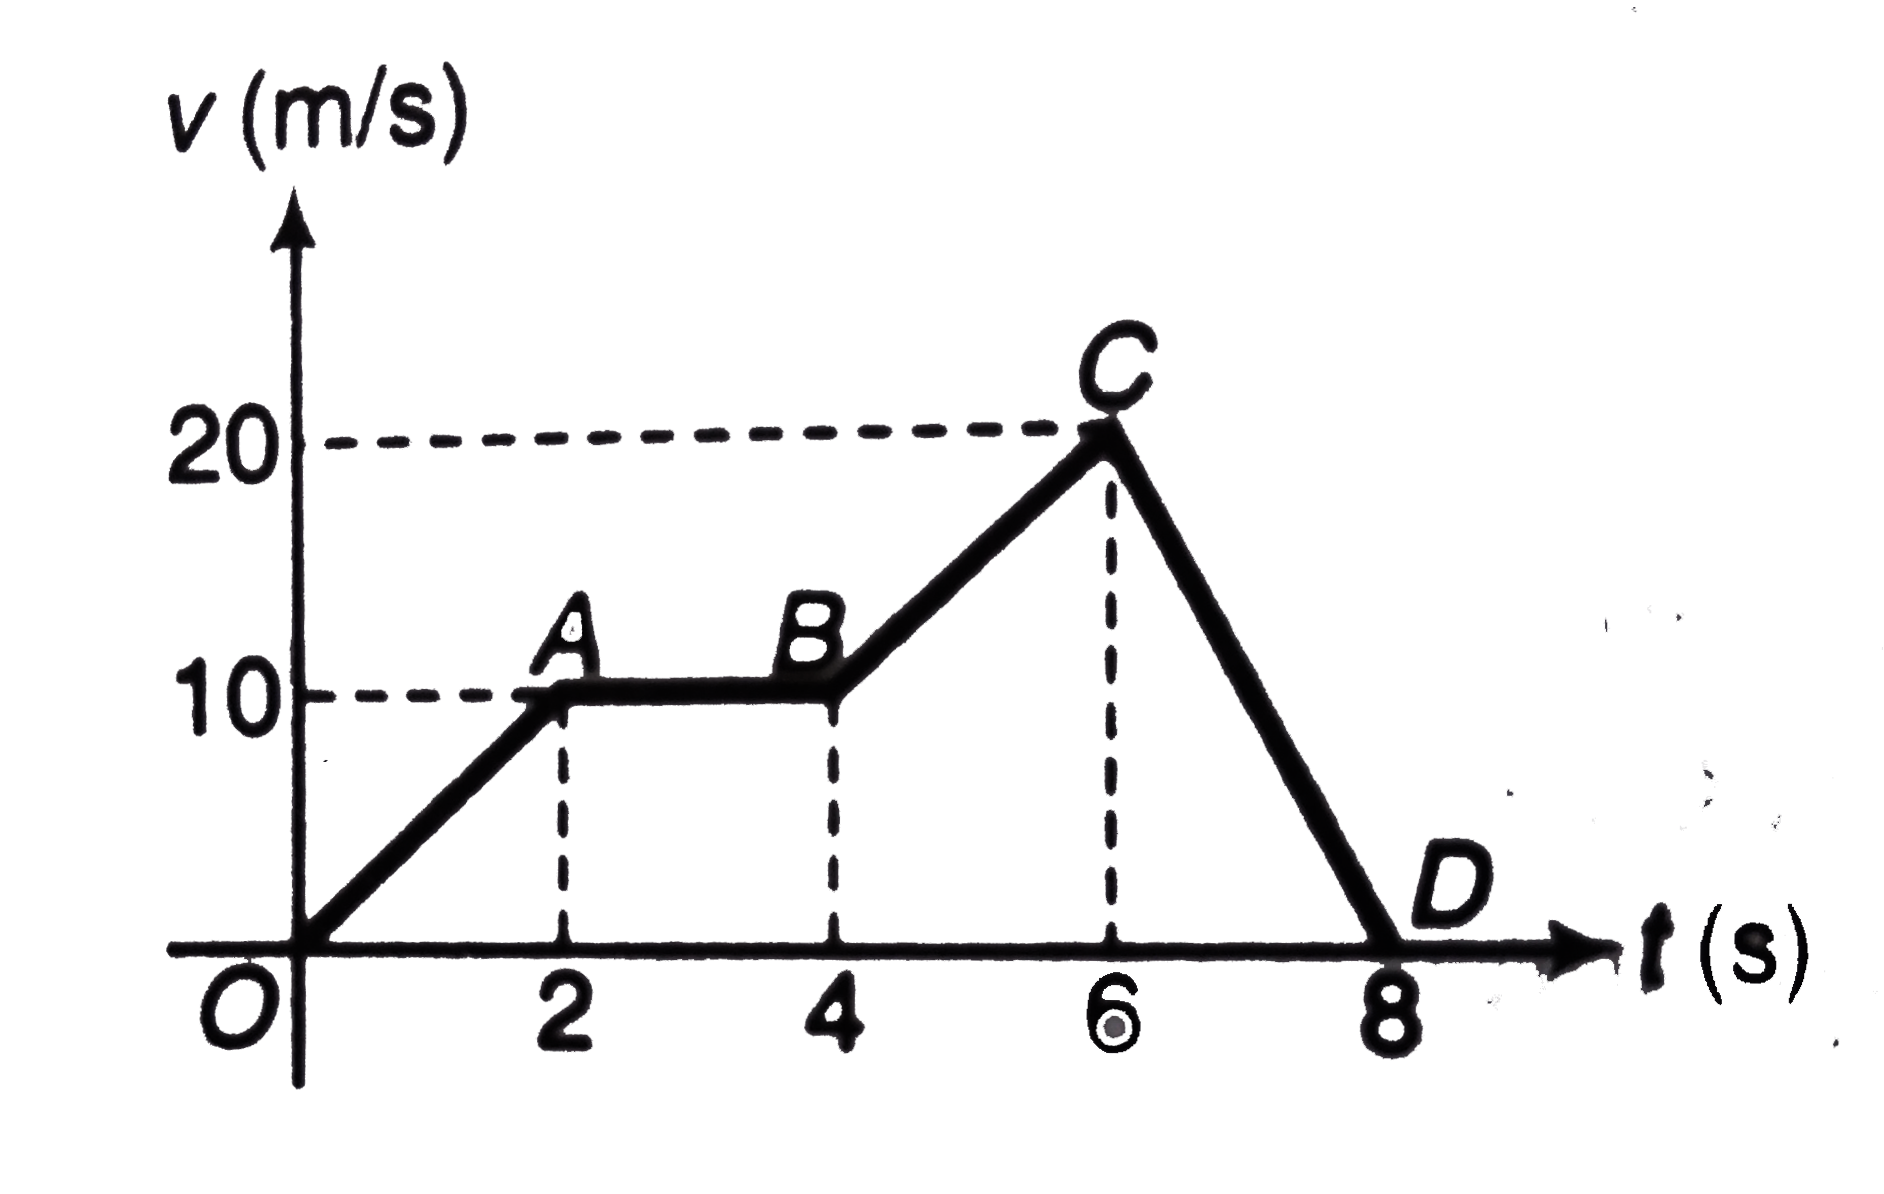
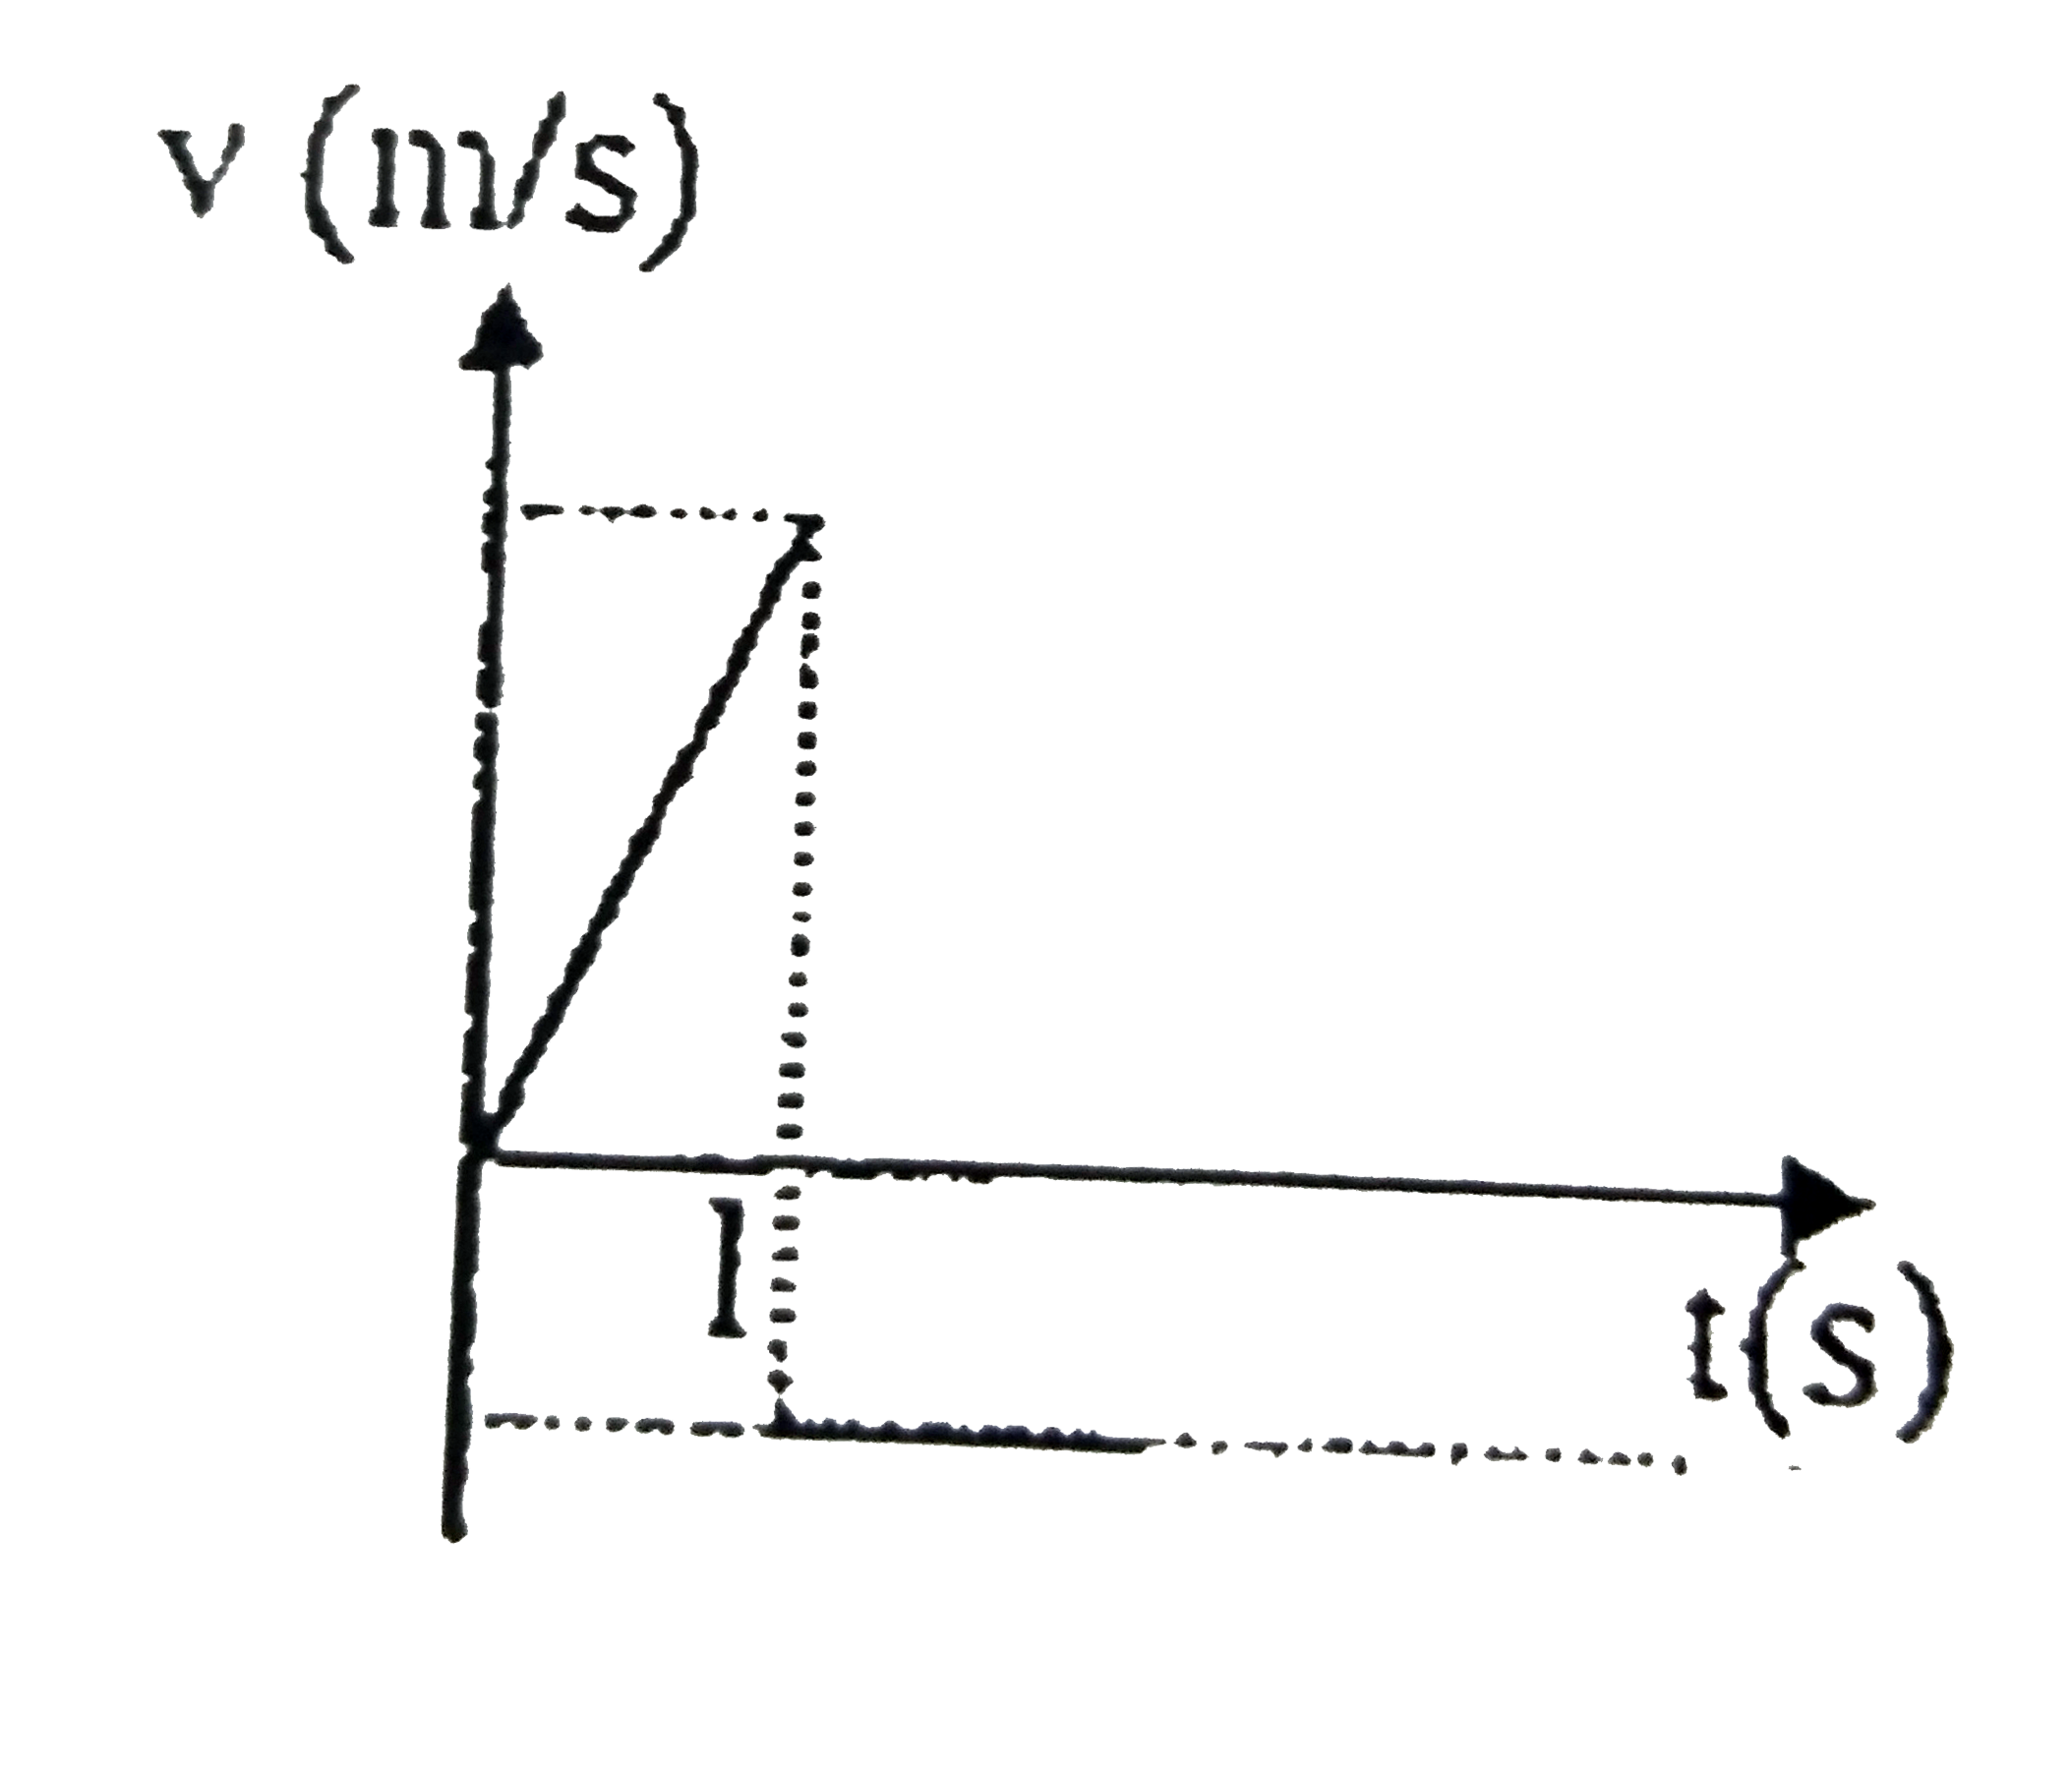
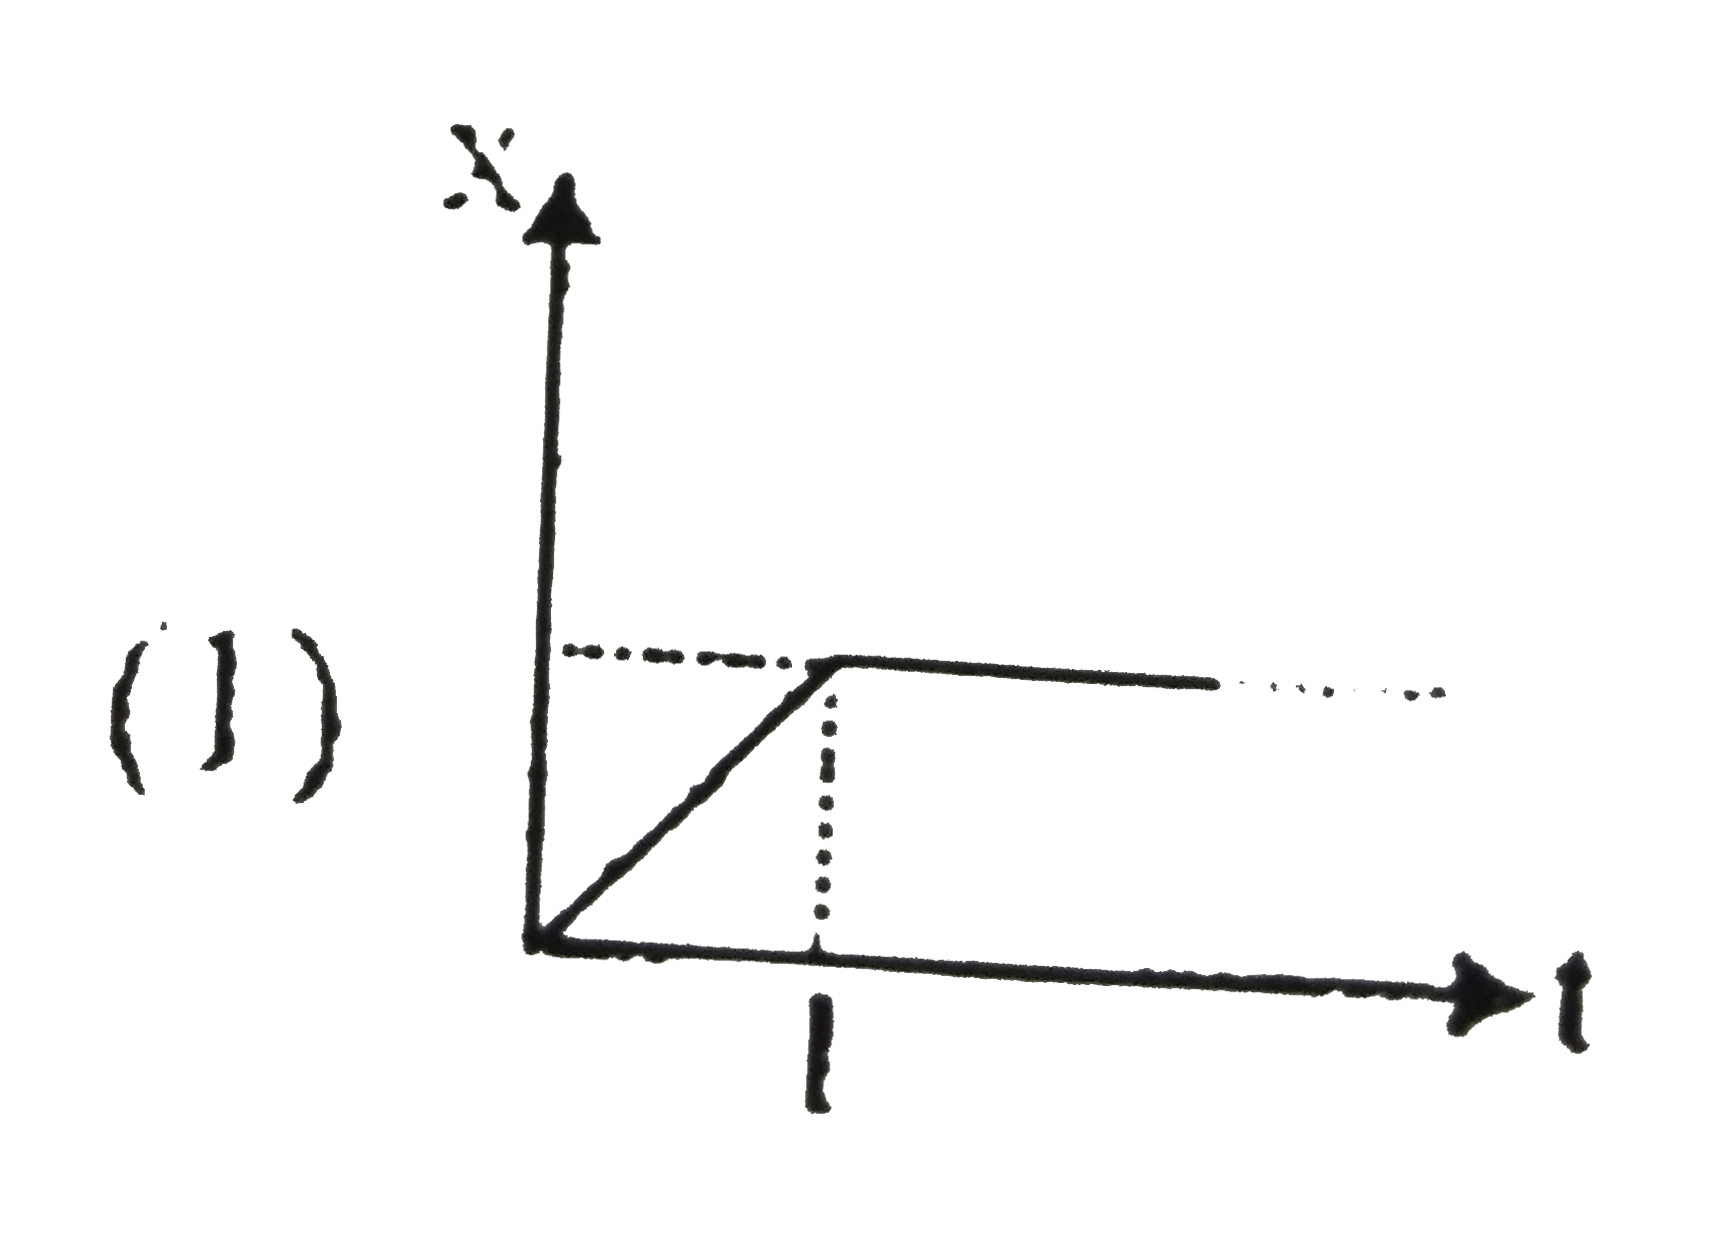
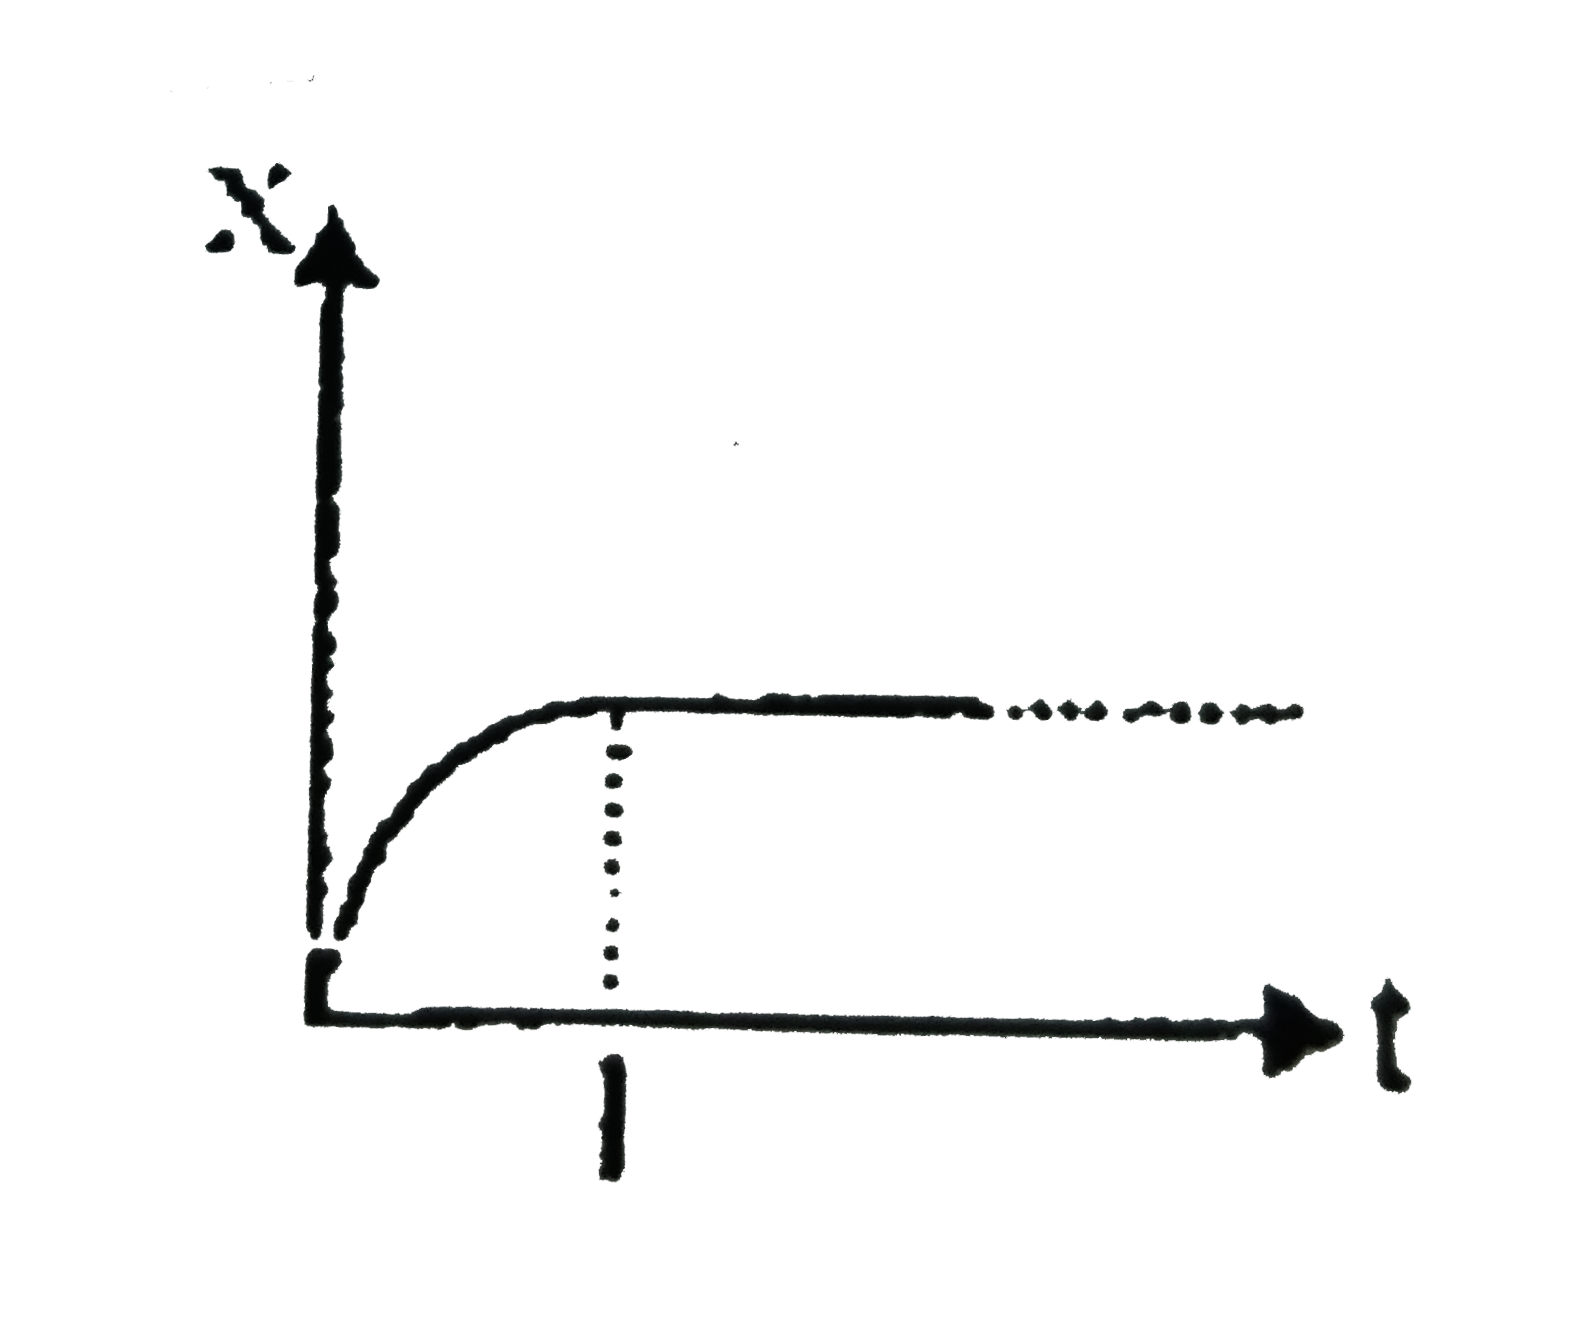
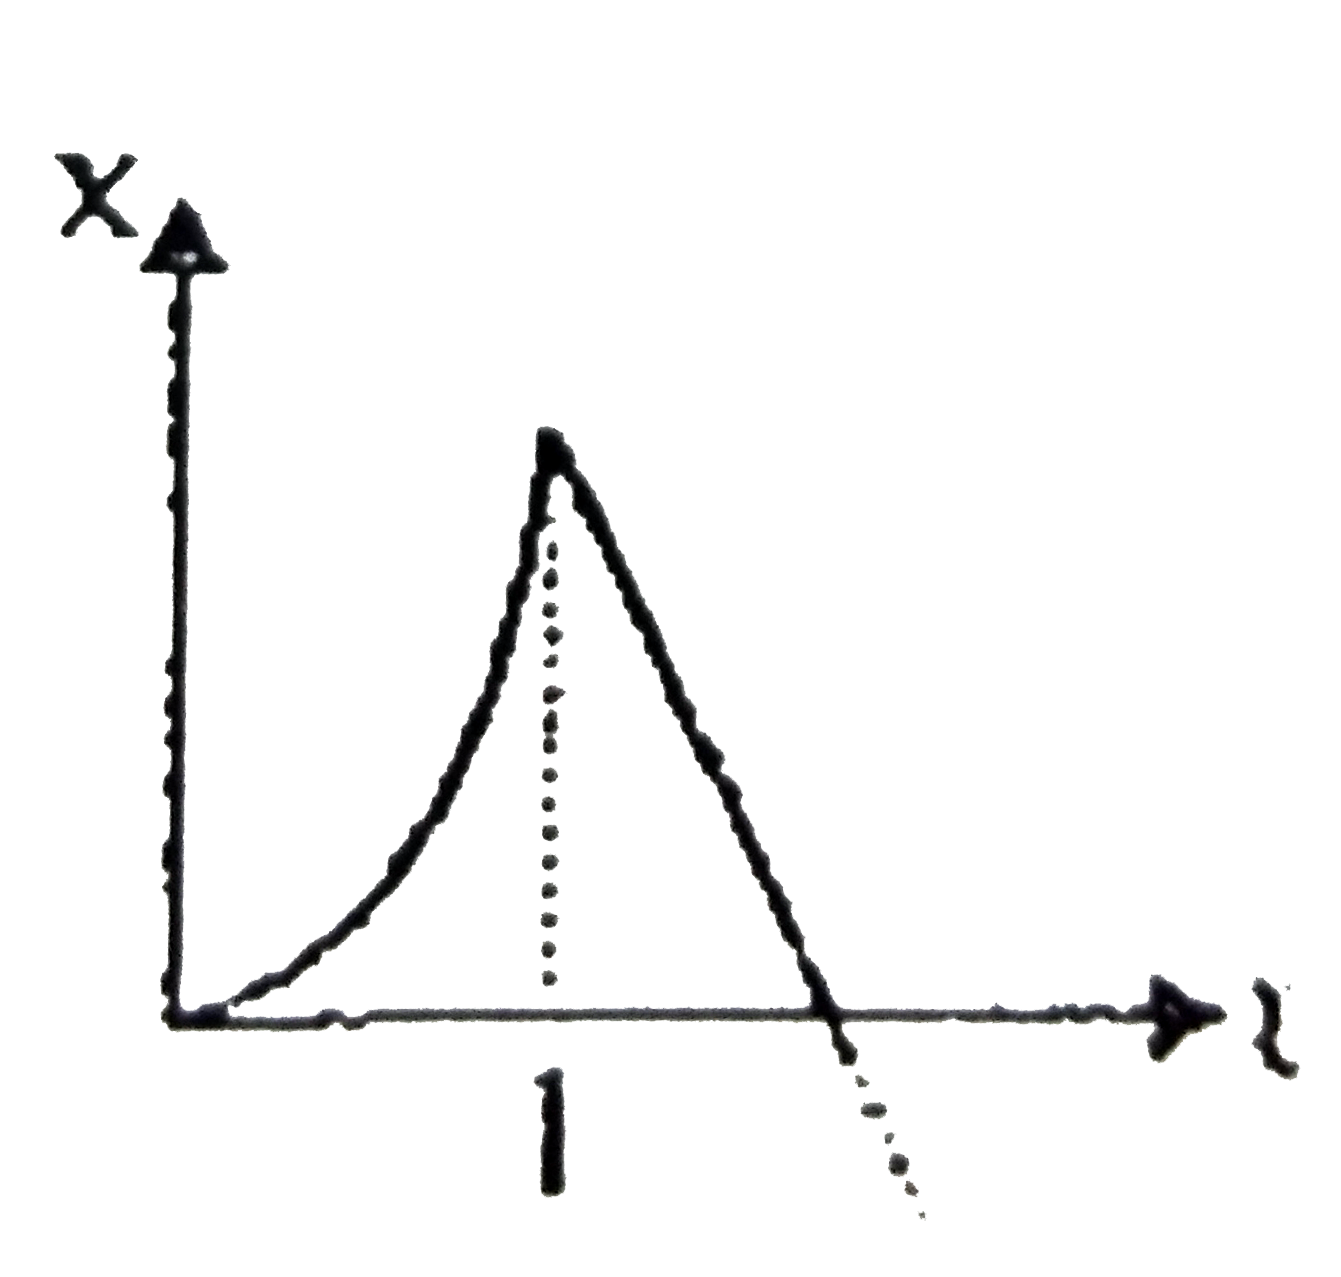
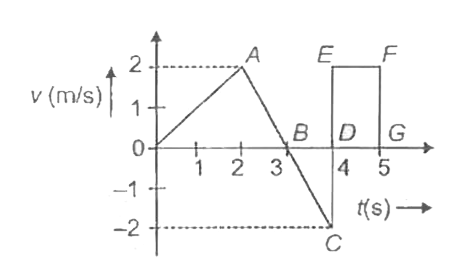
The velocity time graph for a particle moving along x-axis is shown in the figure. The corresponding displacement time graph is correctly shown by
A
B

C
D
Video Solution
Text Solution
t=0 to 1 sec velocity ↑ so slope of x-tcurve ↑ then slop negative and constant.
|
Topper's Solved these Questions
- TEST PAPERSBook:BANSALChapter:TEST PAPERSExercise:PHYSICS PART (A)
Explore 32 Videos
- TEST PAPERSBook:BANSALChapter:TEST PAPERSExercise:PHYSICS PART (B)
Explore 3 Videos
- TEST PAPERSBook:BANSALChapter:TEST PAPERSExercise:PHYSICS PART- C
Explore 4 Videos
- SEMICONDUCTORSBook:BANSALChapter:SEMICONDUCTORSExercise:CBSE Question
Explore 32 Videos
Similar Questions
Knowledge Check
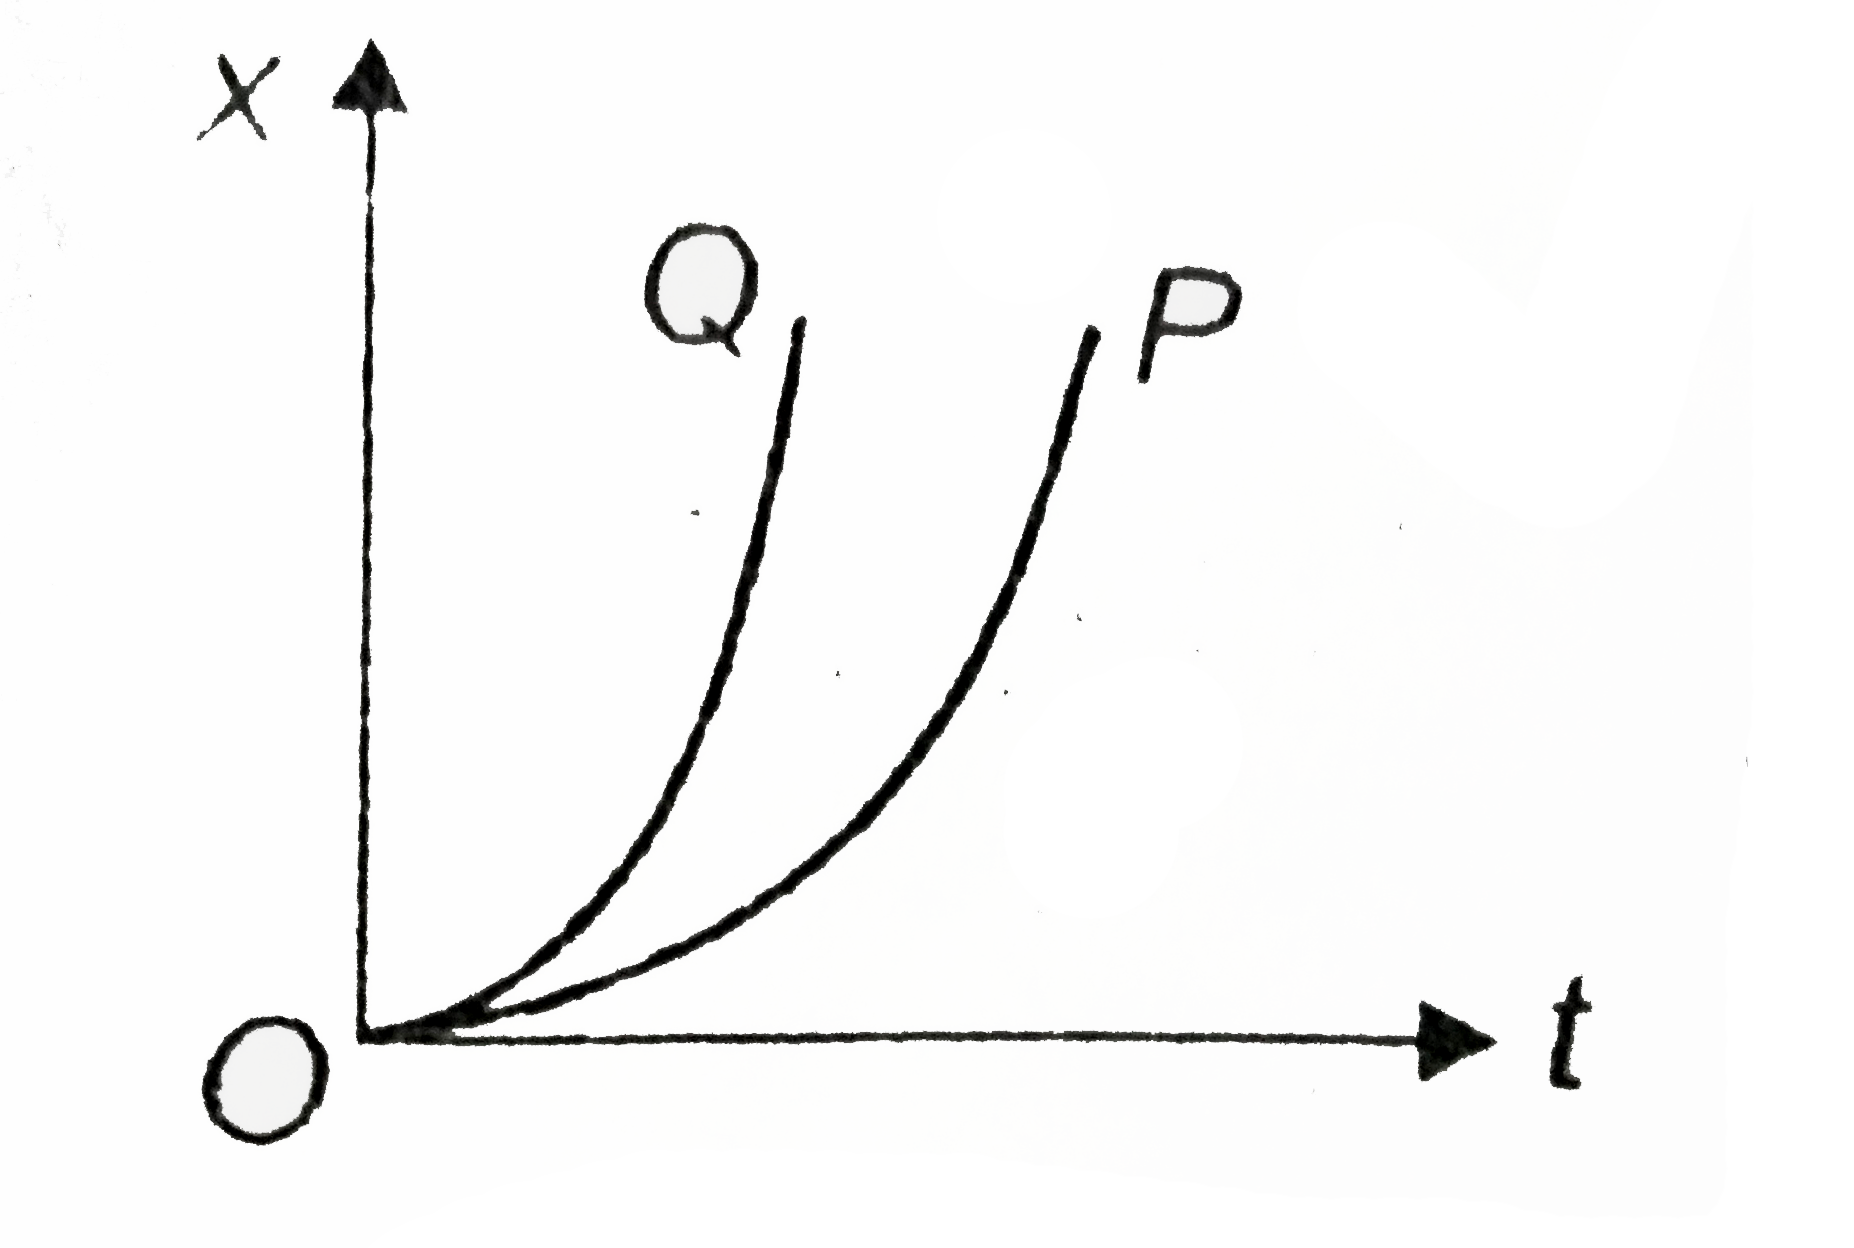
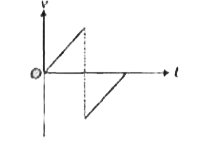
The velocity (v) - time (t) graph for a particle moving along x - axis is shown in the figure. The corresponding position (x) - time (t) is best represented by
 A
A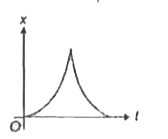 B
B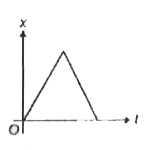 C
C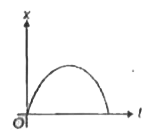 D
D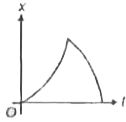
The velocity − time graph of a particle is as shown in figure
 AIt moves with a constant acceleration throughoutBIt moves with an acceleration of constant magnitude but changing direction at the end of every two secondCThe displacement of the particle is zeroDThe velocity becomes zero at t=4 second
The velocity displacement graph of a particle moving along a straight line is shown in figure.
Then the acceleration displacement graph is.A B
B C
C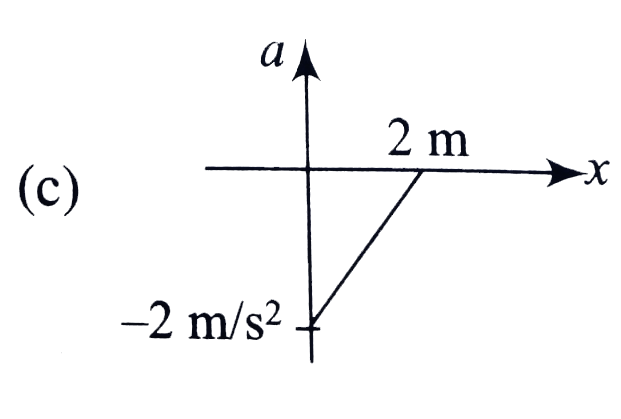 D
D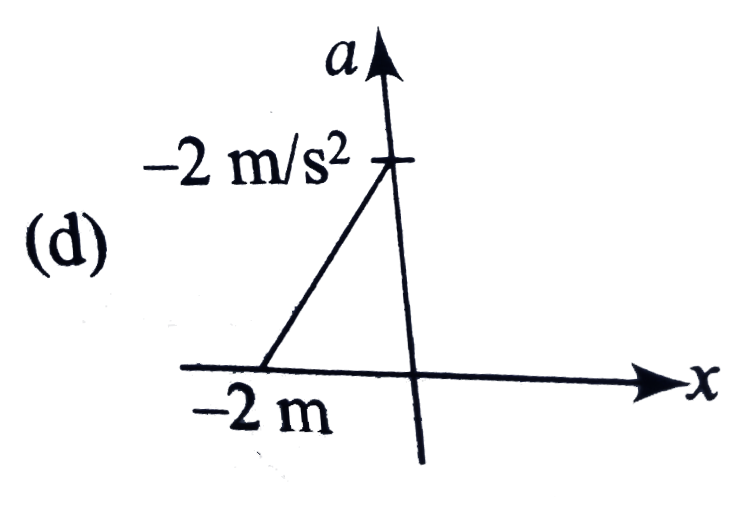
Velocity-time graph of a particle in SHM is as shown in figure. Match the following
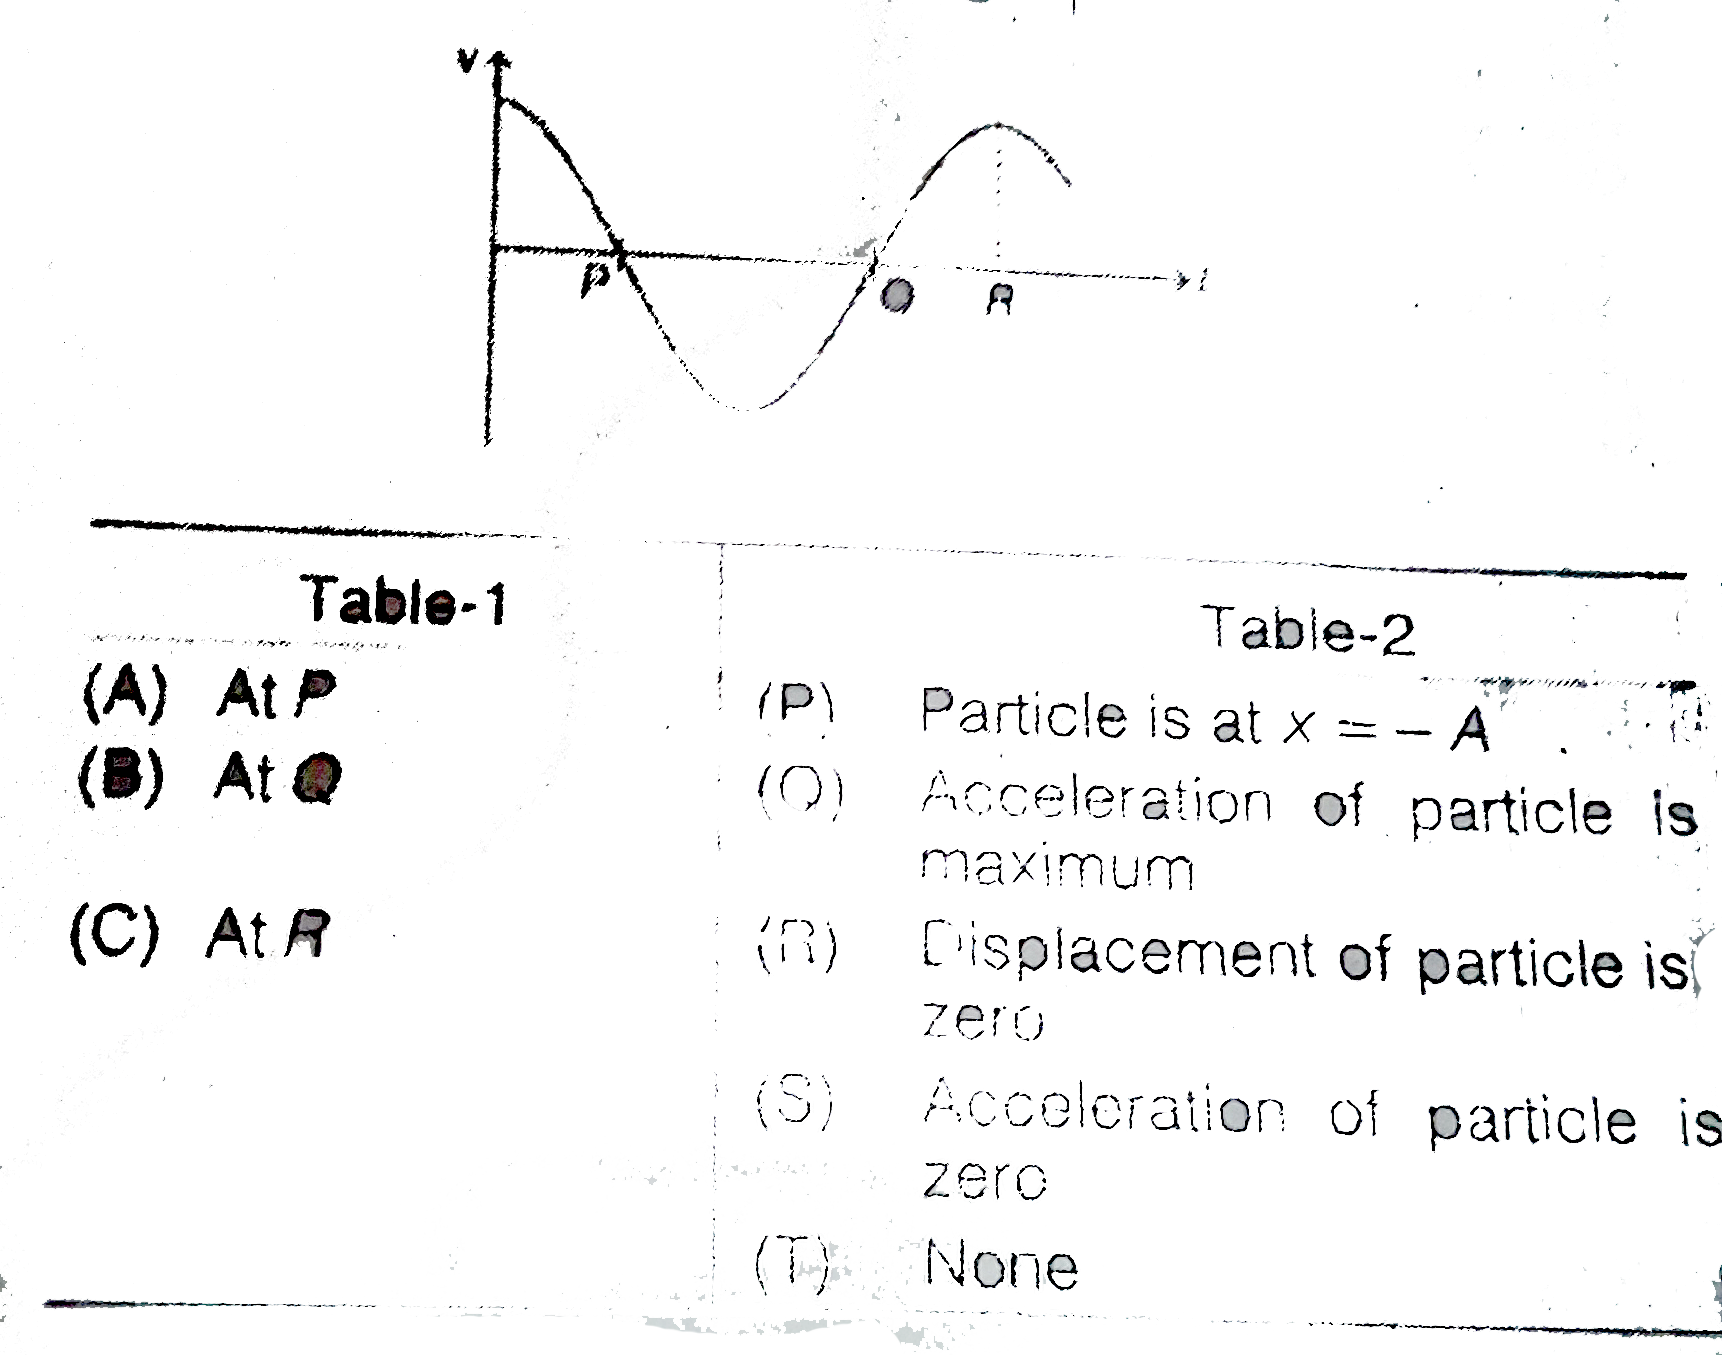
View SolutionThe x-t graph of a particle moving along a straight line is shown in figure
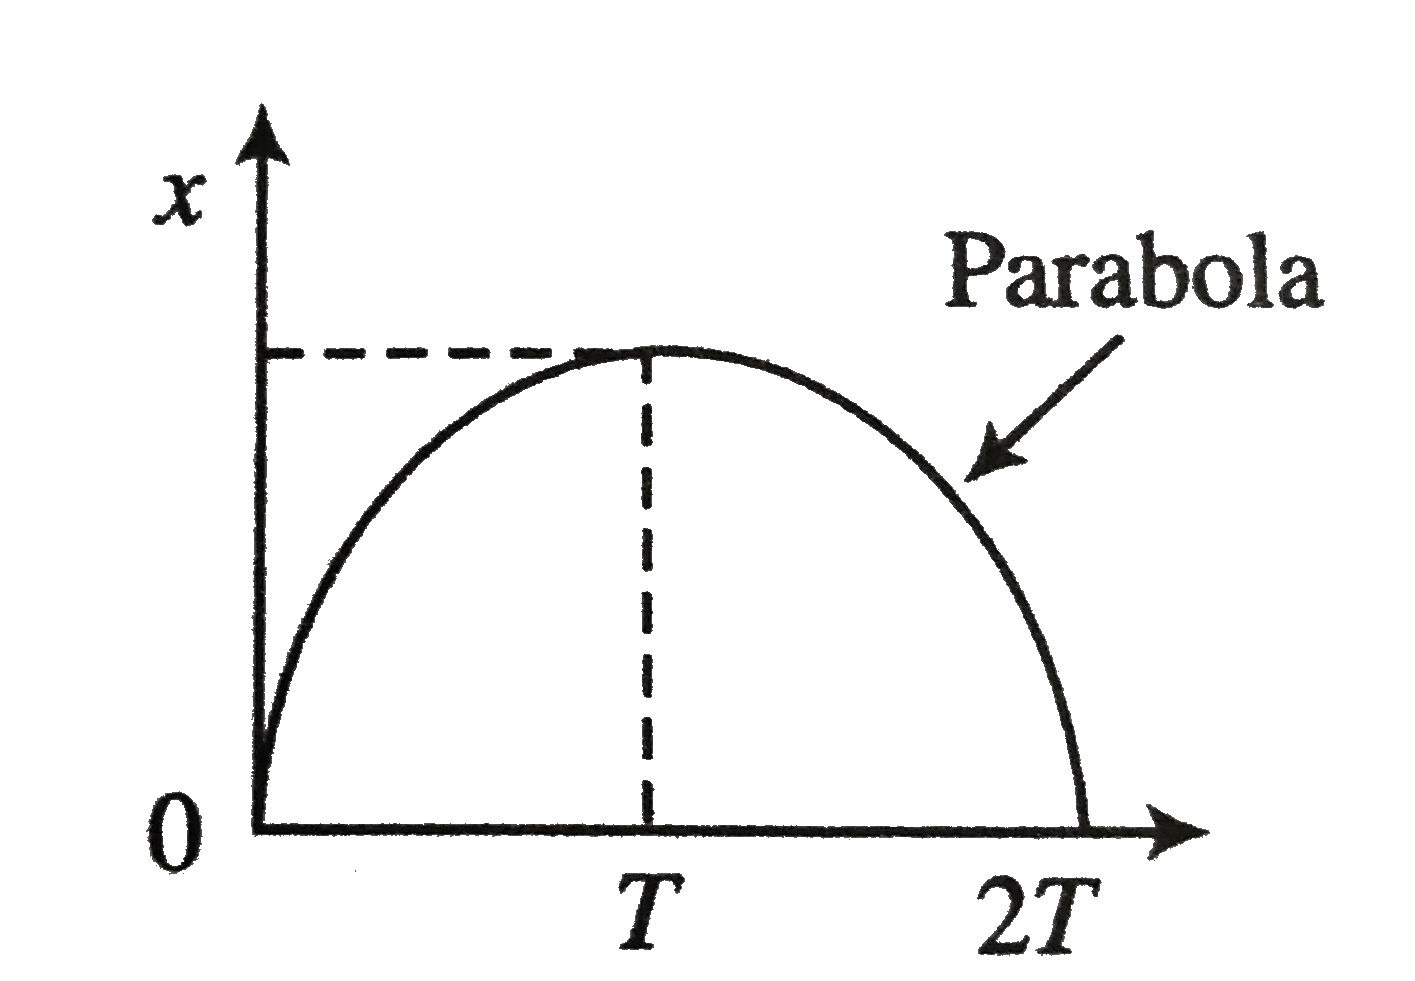
The speed-time graph of the particle is correctly shown by
View SolutionThe figure shows a velocity-time graph of a particle moving along a straight line
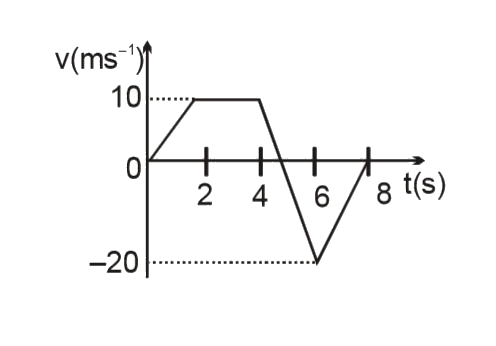
Q. The correct displacement-time graph of the particle is shown as
View SolutionThe velocity - time graph of a particle moving along a straight line is shown in the figure given below
The displacement of the particle in 5 second is
View SolutionThe x−t graph of particle moving along a straight line is shown in figure
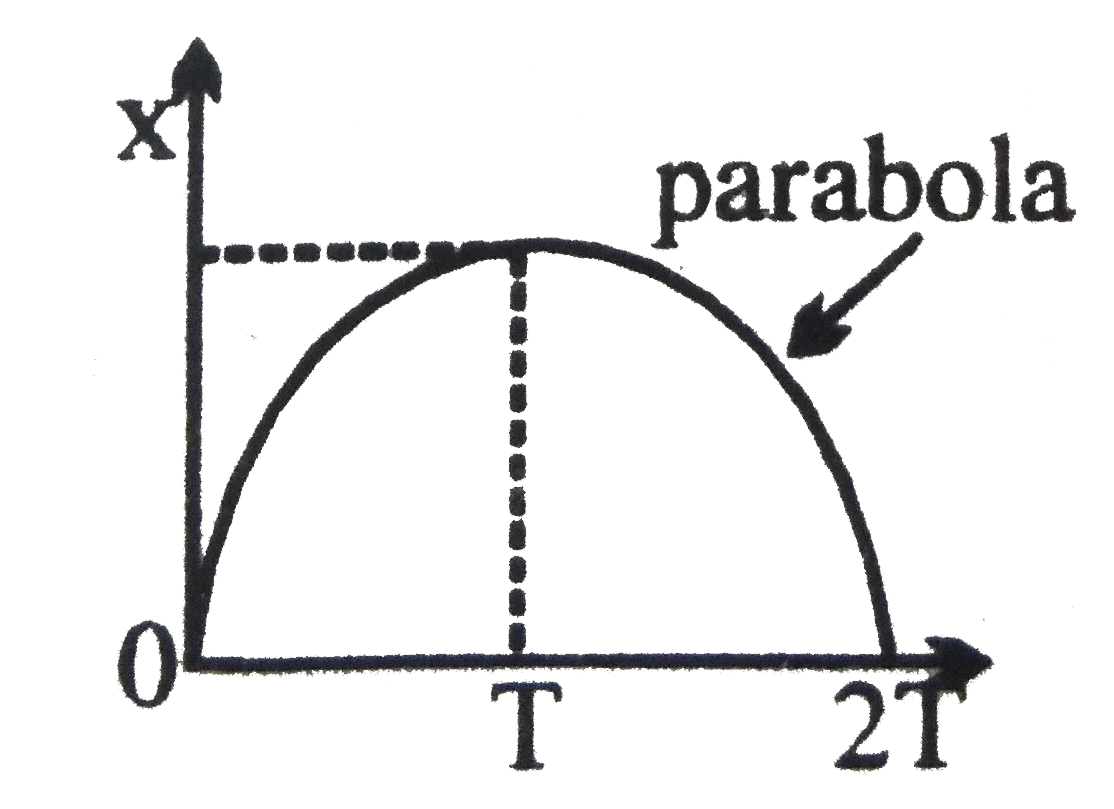
The speed-time graph of the particle si correctly shown by
View Solution


