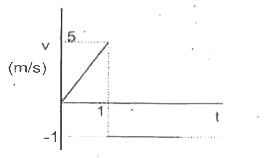
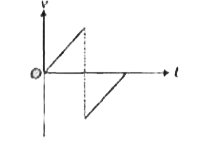
The velocity time graph for a particle moving along X-axis is shown in the figure. The corresponding displacement time graph is correctly shown by
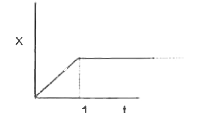
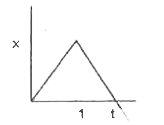
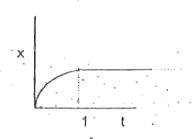
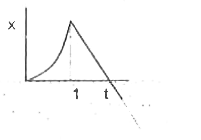
The correct Answer is:D
Step by step video, text & image solution for The velocity time graph for a particle moving along X-axis is shown in the figure. The corresponding displacement time graph is correctly shown by by Physics experts to help you in doubts & scoring excellent marks in Class 12 exams.
Updated on:21/07/2023Topper's Solved these Questions
- KINEMATICSBOOK - FIITJEECHAPTER - KINEMATICSEXERCISE - ASSIGNMENT PROBLEMS (OBJECTIVE) LEVEL-I (ASSERTION REASONING TYPE)
2 Videos
- KINEMATICSBOOK - FIITJEECHAPTER - KINEMATICSEXERCISE - ASSIGNMENT PROBLEMS (OBJECTIVE) LEVEL-II
20 Videos
- KINEMATICSBOOK - FIITJEECHAPTER - KINEMATICSEXERCISE - ASSIGNMENT PROBLEMS (SUBJECTIVE) LEVEL-II & III
15 Videos
- HEAT AND TEMPERATUREBOOK - FIITJEECHAPTER - HEAT AND TEMPERATUREEXERCISE - NUMERICAL BASES QUESTIONS
1 Videos
- LAWS OF MOTIONBOOK - FIITJEECHAPTER - LAWS OF MOTIONEXERCISE - COMPREHENSION-III
2 Videos
Similar Questions
Knowledge Check
The velocity (v) - time (t) graph for a particle moving along x - axis is shown in the figure. The corresponding position (x) - time (t) is best represented by
 A
A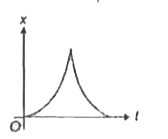 B
B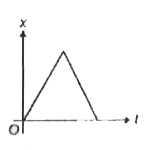 C
C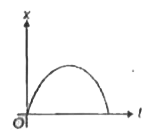 D
D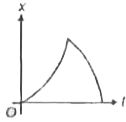
The velocity − time graph of a particle is as shown in figure
 AIt moves with a constant acceleration throughoutBIt moves with an acceleration of constant magnitude but changing direction at the end of every two secondCThe displacement of the particle is zeroDThe velocity becomes zero at t=4 second
The velocity displacement graph of a particle moving along a straight line is shown in figure.
Then the acceleration displacement graph is.A B
B C
C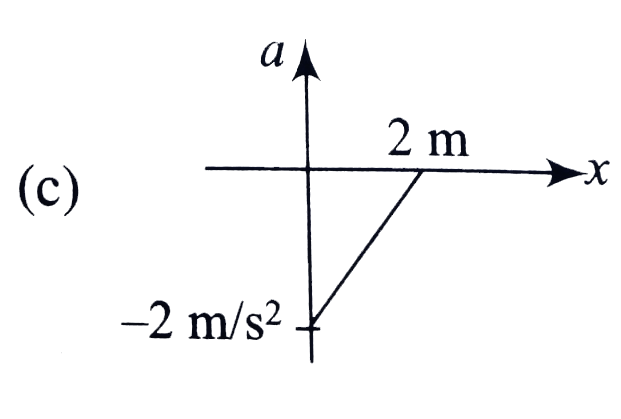 D
D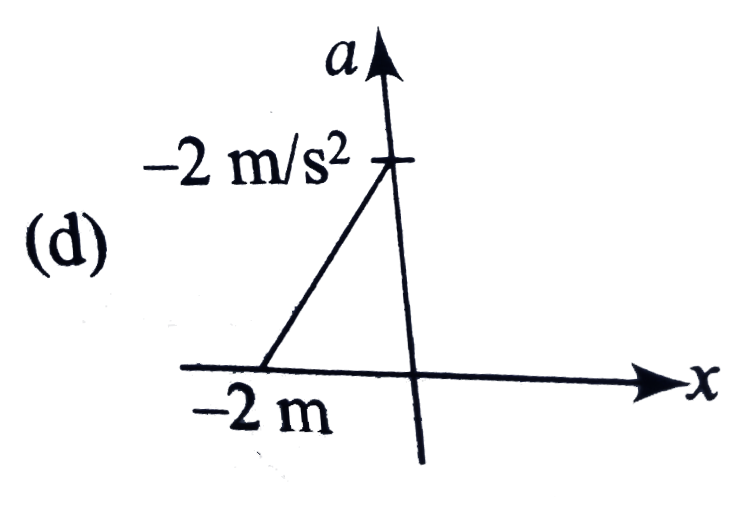
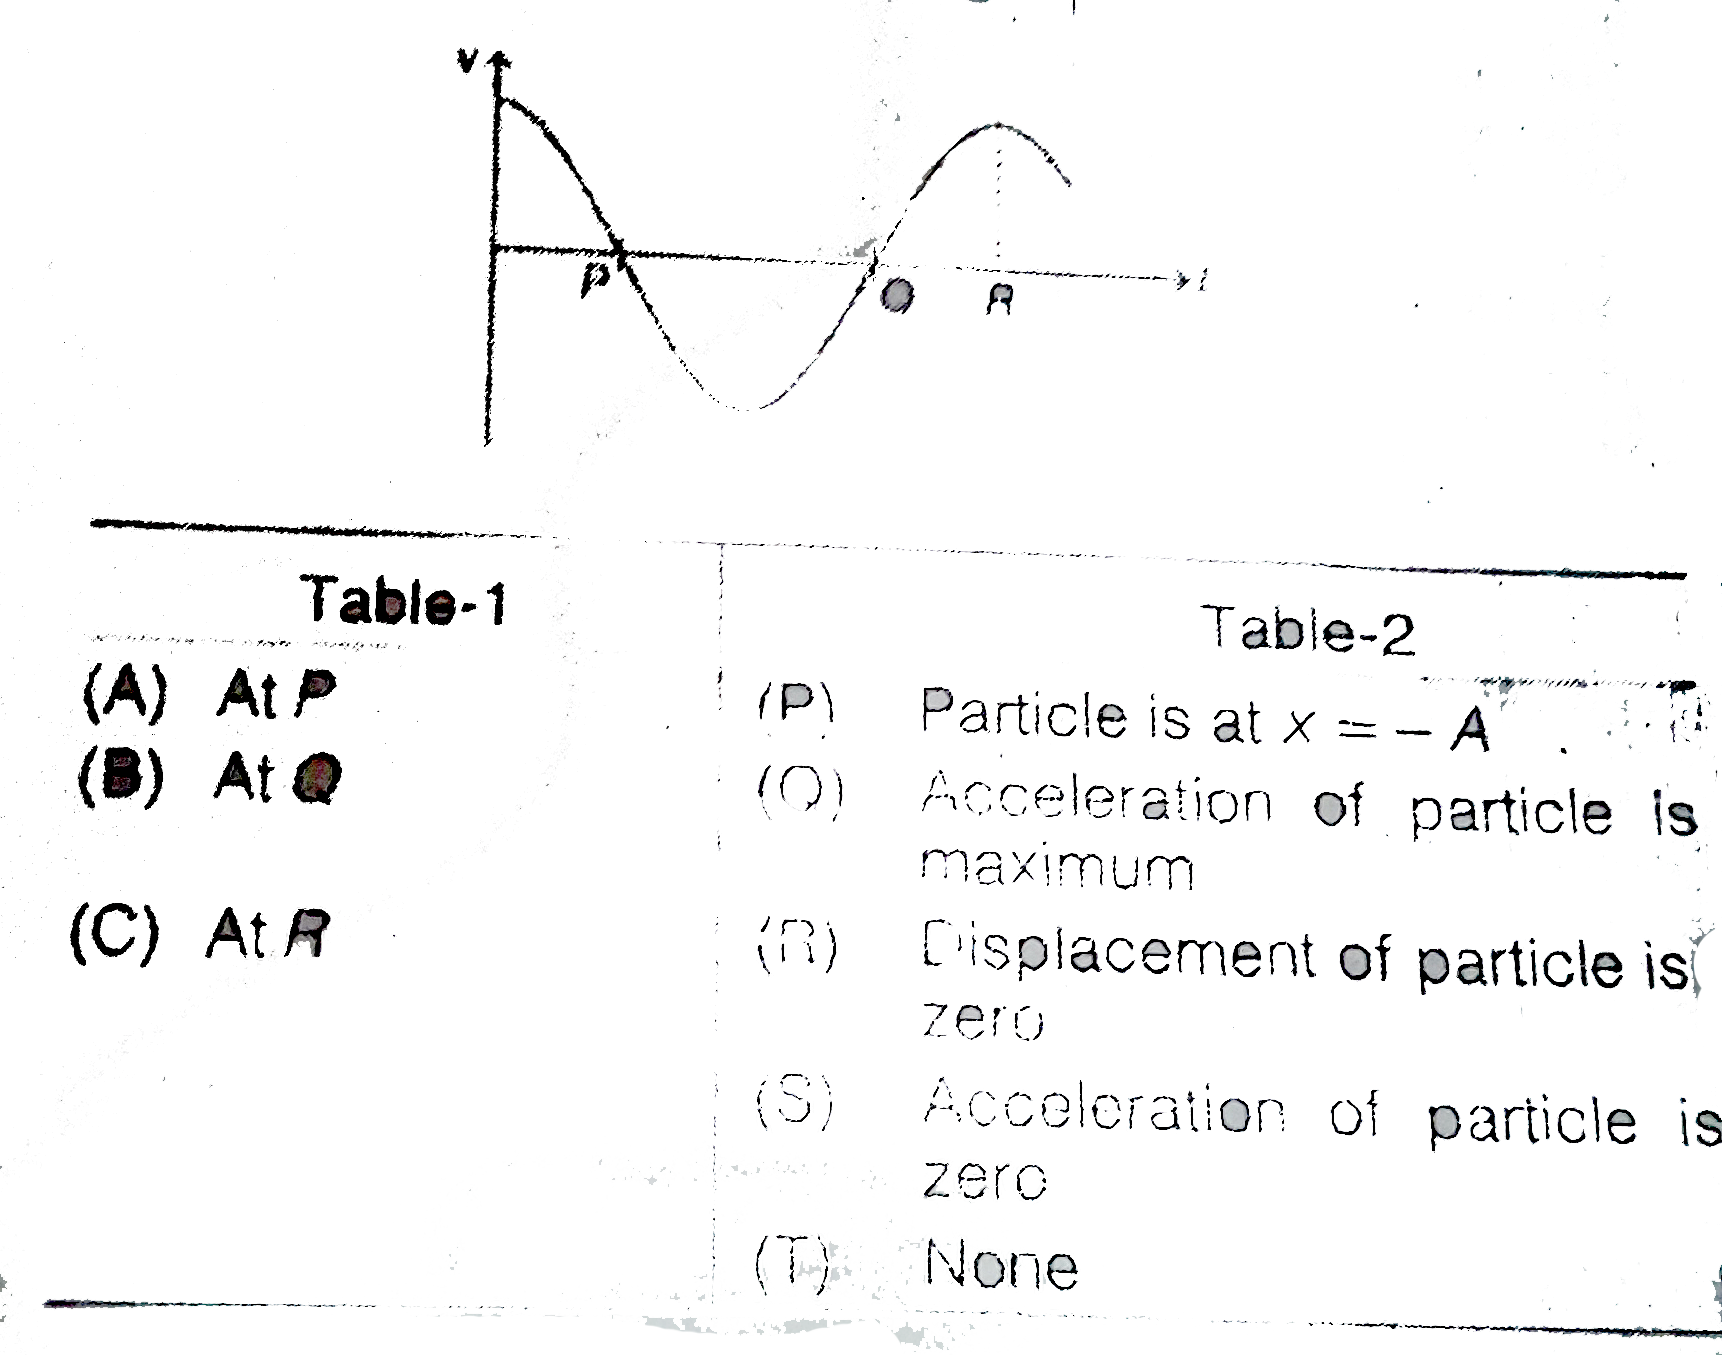
Velocity-time graph of a particle in SHM is as shown in figure. Match the following
View SolutionThe x-t graph of a particle moving along a straight line is shown in figure
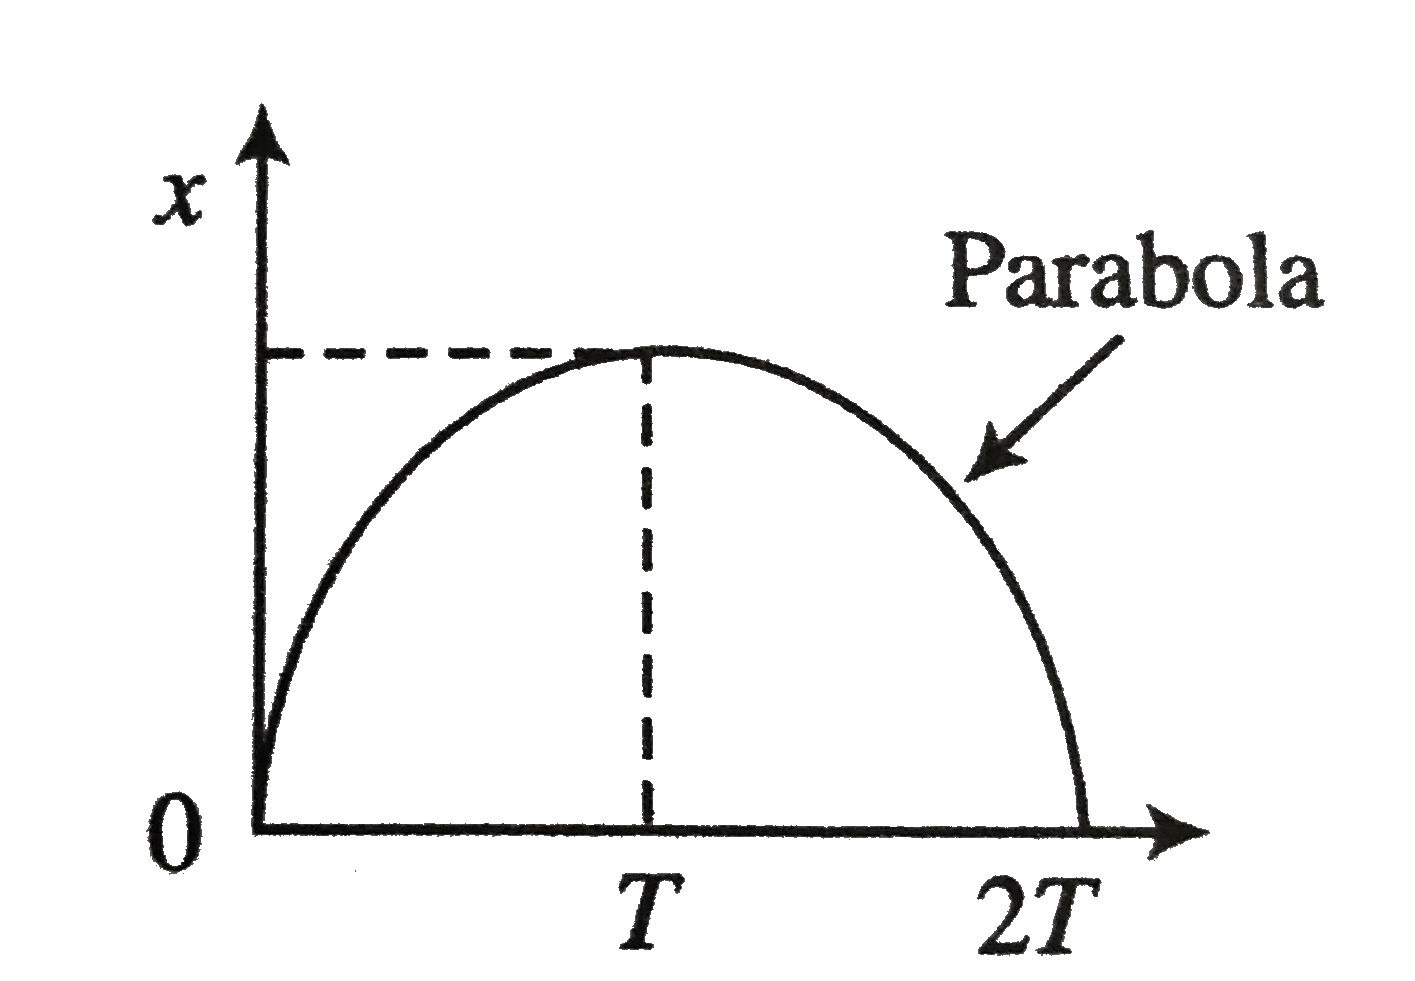
The speed-time graph of the particle is correctly shown by
View SolutionThe figure shows a velocity-time graph of a particle moving along a straight line
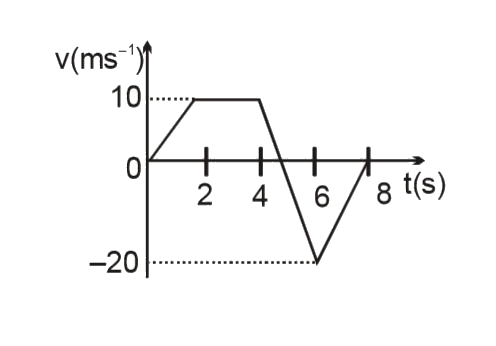
Q. The correct displacement-time graph of the particle is shown as
View SolutionThe velocity - time graph of a particle moving along a straight line is shown in the figure given below
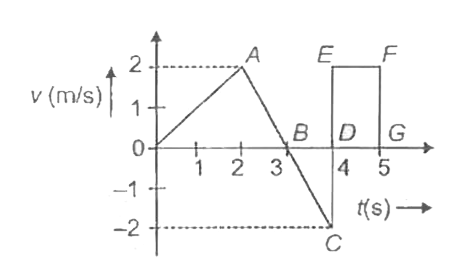
The displacement of the particle in 5 second is
View SolutionThe x−t graph of particle moving along a straight line is shown in figure
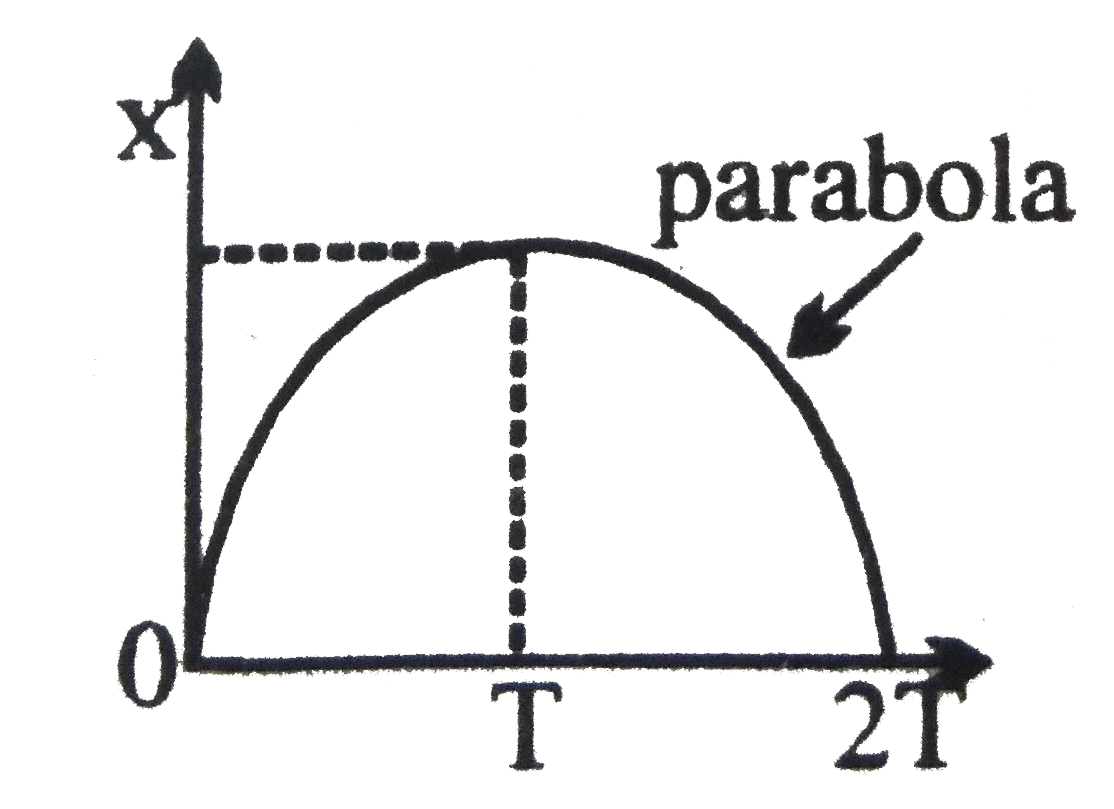
The speed-time graph of the particle si correctly shown by
View Solution

